DOI:
10.1039/C3NJ00576C
(Paper)
New J. Chem., 2014,
38, 198-205
Hollow carbon nanofibers as an effective electrode for brackish water desalination using the capacitive deionization process
Received
(in Montpellier, France)
30th May 2013
, Accepted 3rd September 2013
First published on 2nd October 2013
Abstract
Capacitive deionization (CDI) is strongly recommended as an environmentally friendly and economical technique for removing salt ions from saline water. In this study, highly efficient hollow carbon nanofiber electrodes for capacitive deionization were prepared using co-axial electrospinning of poly(methyl methacrylate) (core) and poly(acrylonitrile) (shell) polymer solutions, followed by oxidative stabilization and then carbonization. The morphology, pore structure and electrochemical performance were characterized by scanning electron microscopy (SEM) and transmission electron microscopy (TEM), nitrogen adsorption–desorption isotherms, and cyclic voltammetry, respectively. The synthesized hollow carbon nanofibers had a specific capacitance of 222.3 F g−1, which is almost 4 times higher than the corresponding value for solid carbon nanofibers (63 F g−1). Moreover, the surface area of the hollow nanofibers (186 m2 g−1) was 10 times greater compared to the surface area of solid carbon nanofibers (17.7 m2 g−1). Accordingly, the salt ion electrosorption capacity of the modified carbon nanofibers was greatly enhanced; the hollow nanofibers exhibited an excellent desalination performance (∼86%) and a better cycling ability. These properties are attributed to the hollow structure. Overall, the proposed modification to carbon nanofibers makes them adequate not only for use as promising electrodes for the CDI process but also for any application requiring carbonaceous materials with a high specific surface area.
1. Introduction
A high percentage of salt in drinking water has serious harmful effects. It can lead to sickness, dehydration, brain damage and death. Furthermore, it can create various problems in the industrial field. It is well known that operating cost and energy consumption are the main dilemmas facing conventional desalination technologies. The increasing awareness of energy conservation and environmental preservation has prompted scientists to develop new alternative technologies.1–4 Compared to various traditional desalination methodologies, such as thermal distillation, multiple-effect distillation (MED), thermal vapor compression (TVC), and reverse osmosis (RO), capacitive deionization (CDI) represents one of the most promising brackish water desalination technologies. This is due to the low energy consumption, low capital and processing costs, easy operational and maintenance processes, and environmentally friendly nature since hazardous chemicals are not required for electrode regeneration.5–9 CDI is an electrochemical water purification method based on the principles of an electric double-layer capacitor (EDLC). The concept of CDI can be simply described as electrosorption–desorption processes. By applying an external electrical potential (approximately 1.3 V), salt ions in the feed water are electrosorbed by the oppositely charged electrodes, then a reduction in the potential leads to ejection of the ions and regeneration of the electrodes for a continuous desalination process.10,11
The optimal electrode should have a good electrical conductivity, high specific surface area with suitable pore sizes, and excellent electrolyte wettability. Currently, carbonaceous materials, including carbon aerogels,12,13 activated carbon (AC),14–16 ordered mesoporous carbon (OMC),17,18 ultrafine carbon fiber (CF),19–21 carbon nanotubes (CNTs),22,23 and graphene,24–26 are the best candidates for CDI electrodes. Carbon nanofibers (CNFs) prepared by the electrospinning process have gradually attracted the attention of researchers because of the associated advantages of the synthesis technique and the obtained product. Moreover, it is easy to control the morphology and the pore structure of the obtained nanofibers.27 Currently, CNFs are widely used in many fields, such as hydrogen energy,28,29 electrochemical capacitors (EDLCs),30 lithium-ion rechargeable batteries (LIBs),31 supercapacitors,32 and fuel cells.33 Poly(acrylonitrile) (PAN) is the most widely used precursor for making CNFs.
The long axial ratio of CNFs leads to a decrease in the total surface area compared to other nanostructural carbonaceous materials. This might have a negative influence when utilizing CNFs as electrodes in the CDI process. However, recently it was reported that the long axial ratio provides an advantage to nanofibers over nanoparticles in electron transfer-based processes as nanofibers show better performances.34 Therefore, overcoming the low surface area characteristic of CNFs can strongly enhance the performance in the CDI process.
Hollow carbon nanofibers (HCNFs) represent a new generation of CNF structures with double the surface area. They therefore propose a promising alternative for many applications.35 Co-axial electrospinning is the most popular technique utilized in the production of core–shell nanofibers due to the simplicity, low cost and high yield. Additionally, it has a great ability to adapt the morphology and pore structure of the obtained nanofibers for serving different applications. In this study, co-axial electrospinning of two polymer solutions (PAN (shell) and poly(methyl methacrylate) (PMMA) (core)) was achieved. There is an extreme difference in the thermal decomposition between the two utilized polymers as PMMA completely disappeared without leaving any residual material during the carbonization step,36 while PAN showed a good stability. Therefore HCNFs with a good morphology were obtained. As a CDI electrode, the synthesized HCNFs revealed an excellent performance in water desalination.
2. Experimental
2.1 Materials
Polyacrylonitrile (PAN, average Mw = 150![[thin space (1/6-em)]](https://www.rsc.org/images/entities/char_2009.gif) 000 g mol−1) and poly(methyl methacrylate) (PMMA, average Mw = 120000 g mol−1) were of analytical grade and were purchased from Sigma-Aldrich. N,N-Dimethylformamide (DMF, 99.5% assay; SAMCHUN Pure Chemical Co., South Korea) without any further modifications was used as the solvent.
000 g mol−1) and poly(methyl methacrylate) (PMMA, average Mw = 120000 g mol−1) were of analytical grade and were purchased from Sigma-Aldrich. N,N-Dimethylformamide (DMF, 99.5% assay; SAMCHUN Pure Chemical Co., South Korea) without any further modifications was used as the solvent.
2.2 Synthesis of hollow carbon nanofibers by co-axial electrospinning
A co-axial set with two stainless-steel capillaries was designed to make the core–shell structure. The needles were gauge 18 and 25 for the inner and outer nozzles, respectively. 10 wt% PAN and 12 wt% PMMA concentration solutions dissolved in DMF were prepared individually in two glass bottles using ultrasonication for 2 h, then heating with stirring in a water bath at 60 °C for 4 h. Two plastic syringes were connected to the designed co-axial set. Electrospinning of these solutions to form the core (PMMA)–shell (PAN) electrospun nanofibers was carried out at 20 kV and with an 18 cm distance between the collector and the tip of the syringe. Oxidative stabilization was carried out at 280 °C for 1 h with a heating rate of 5 degrees per min, and the carbonization was carried out at 1000 °C under an argon atmosphere for 2 h with a heating rate of 5 degrees per min. Fabrication of the normal CNFs was achieved by electrospinning a PAN solution (12 wt%) in DMF using the normal set up. The stabilization and calcination processes were carried out under the same conditions.
2.3 Characterization
The surface morphology and pore structure were studied using a JEOL JSM-5900 scanning electron microscope (JEOL Ltd, Japan) and a field-emission scanning electron microscope (FESEM Hitachi S-7400, Japan). High resolution images and selected area electron diffraction patterns were obtained from a transmission electron microscope (TEM, JEOL JEM-2010, Japan) operated at 200 kV. The physical adsorption properties were determined by N2 adsorption–desorption measurements (ASAP 2010 V5.02H). The Brunauer–Emmet–Teller (BET) method was utilized to calculate the specific surface area and pore size distribution; the pore size distribution curves were calculated from the analysis of the desorption branch of the isotherm based on the Barrett–Joyner–Halenda (BJH) model.
2.4 Electrochemical properties of the prepared electrodes
Cyclic voltammetry measurements were carried out using different concentrations (0.1, 0.5 and 1 M) of NaCl solutions and the sweep potential range was adjusted from −0.4 to 0.6 V in the electrochemical cell. A three-electrode system was used: platinum wire as the counter electrode, Ag/AgCl as the reference electrode and the prepared material as the working electrode. The system was controlled using a VersaStat4 potentiostat device. The specific capacity was calculated by integrating the full CV cycle to determine the average value according to the following equation:37,38| |  | (1) |
where Cs is the specific capacitance (F g−1), I is the response current (A), V is the potential (V), ν is the potential scan rate (V s−1), and m is the mass of the electroactive material in the electrodes (g). Electrochemical impedance spectroscopy (EIS) measurements were also measured using VersaStat4. The symmetrical cells were identical to the three-compartment cells mentioned above. The amplitude of the alternating voltage was 5 mV around the equilibrium potential (0 V). The data were collected in the frequency range from 10 mHz to 10 kHz.
2.5 Electrosorptive capacity measurements
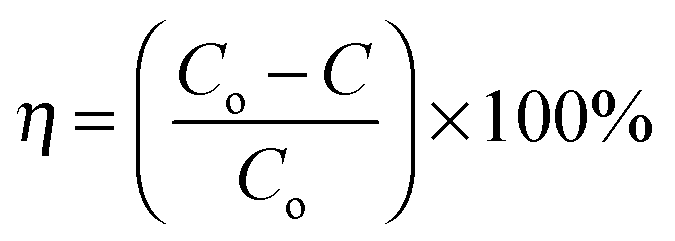
The carbon electrode used as the working electrode was prepared by mixing carbon nanofibers (90 wt%) and polytetrafluoroethylene (10 wt%) with ultrasonication for 1 h. The mixture was coated onto a glassy carbon electrode, and then dried at 100 °C overnight in order to investigate the total electrosorption capacity of the fabricated carbon material. The salt removal efficiency (η) and the electrosorptive capacity (Sc) of the electrode were calculated according to the following equations:39| |  | (2) |
where Co and C (mg L−1) are the initial and final concentrations, respectively, M is the molecular weight and V (L) is the total volume of the NaCl aqueous solution. Meanwhile, m (g) represents the mass of the active components in the working electrode.
3. Results and discussion
3.1 Phase morphology
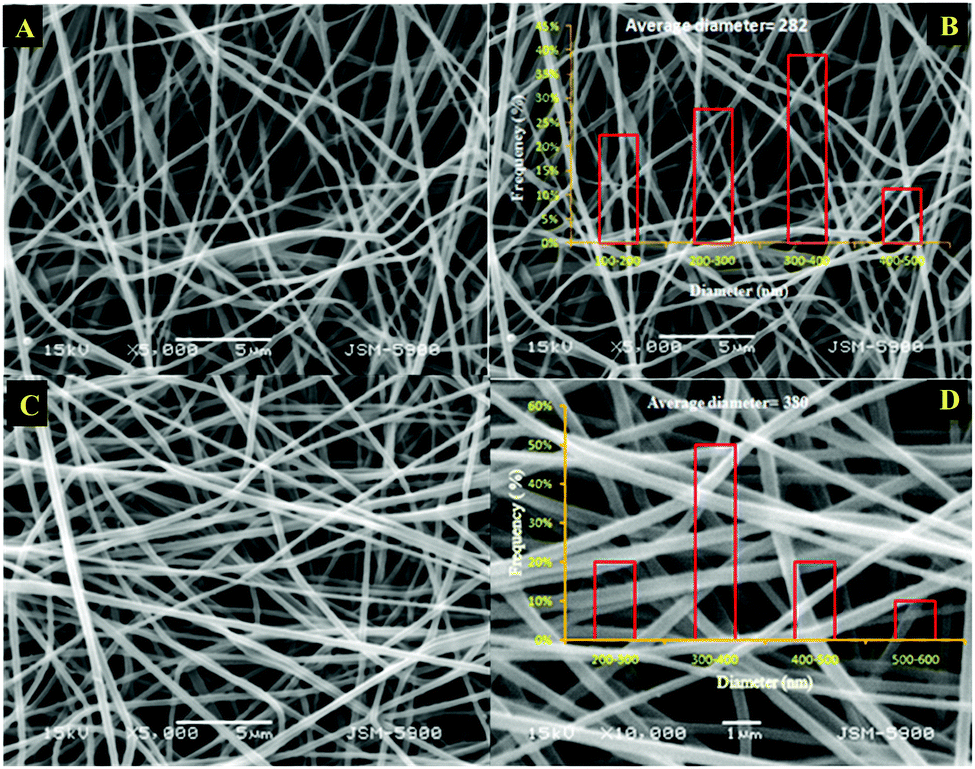
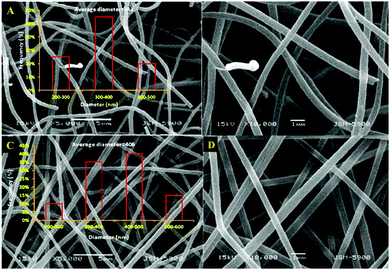
The electrospinning process can be sustained in a variety of modes characterized by the shape of the surface from which the liquid jet originates. Electrospun fibers can adopt a porous or core–shell morphology depending on how the polymers naturally form composites and how the polymer solutions are directed from the syringe nozzle design.40 Accordingly, nanofibers with a good morphology are expected from the co-axial electrospinning of PMMA–PAN. Fig. 1A and B show the low and high magnification SEM images of pristine PAN electrospun mats after drying under vacuum at 60 °C for 24 h. These images show nanofibers with a good morphology. Fig. 1C and D display the SEM images of the dried PMMA–PAN nanofibers obtained from the co-axial electrospinning process. Interestingly, the utilized co-axial electrospinning process resulted in smooth, continuous and bead-free nanofibers. The good morphology obtained in the co-axial electrospinning is attributed to the steering of the polymer solutions from the co-axial nozzle, as well as the homogeneity of PAN and PMMA. It is noteworthy to mention that the diameter frequency charts have been estimated for each formulation (see insets in Fig. 1). From the obtained data, the average diameters were estimated to be 282 and 380 nm for the electrospun nanofiber mats prepared from PAN and the PMMA–PAN coaxial electrospun nanofibers, respectively.
 |
| | Fig. 1 Low and high magnification SEM images of the pristine PAN (A and B) and PMMA–PAN (C and D) dried electrospun nanofibers. | |
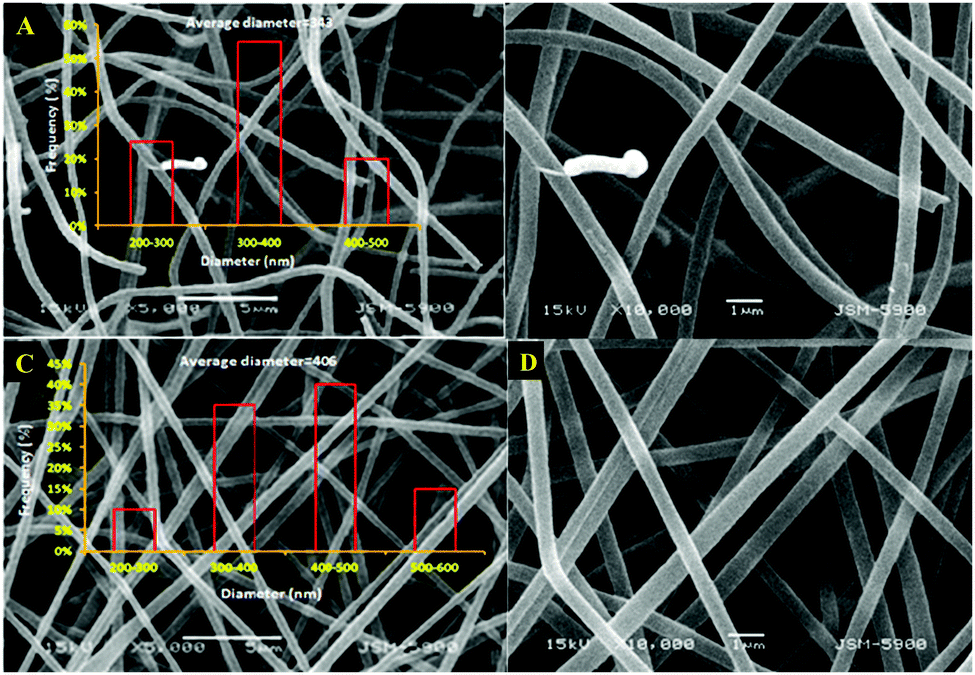
Fig. 2 displays the SEM images after the carbonization process in an Ar atmosphere. As shown, the utilized calcination process did not affect the nanofibrous morphology in both formulations. The corresponding average diameters for the sintered nanofibers were estimated from the diameter frequency curves (insets in Fig. 2). The results indicated that the average diameters of the HCNFs and the solid CNFs were 406 and 330 nm, respectively.
 |
| | Fig. 2 Low and high magnification SEM images of the obtained nanofibers after calcination of the pristine PAN (A and B) and PMMA–PAN (C and D) in an Ar atmosphere at 1000 °C. | |
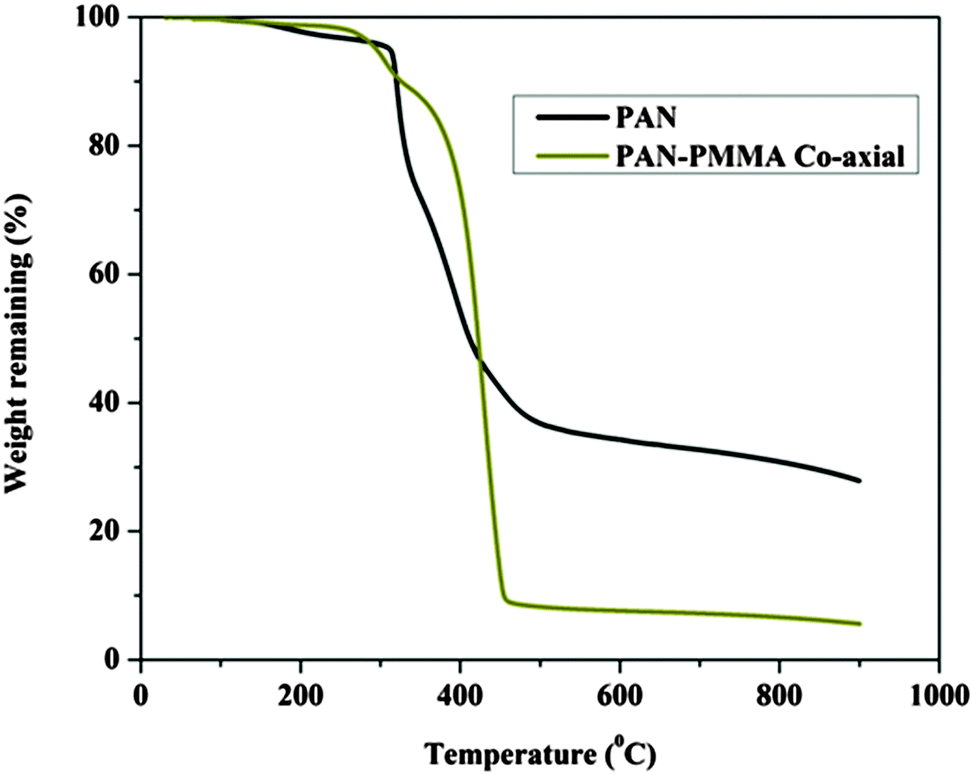
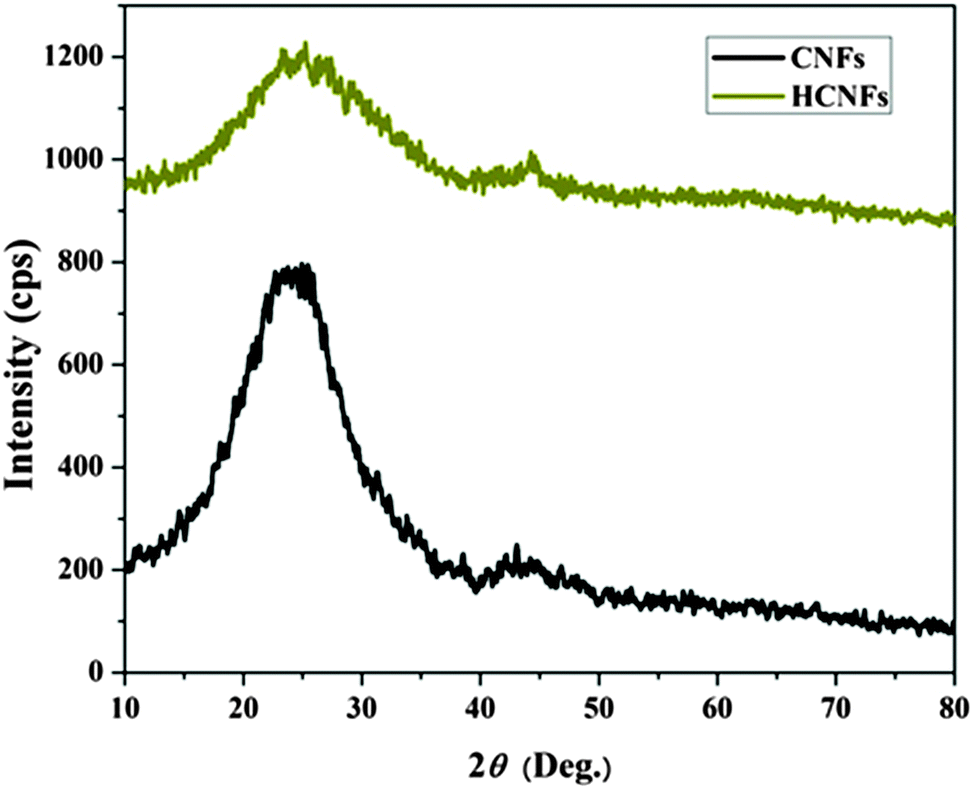
Fig. 3A and B display FESEM and TEM images, respectively, for the prepared CNFs from the PAN solution. As shown in the figures, CNFs with a solid and good morphology were obtained. The corresponding images for the nanofibers obtained from the co-axial electrospinning process are shown in Fig. 3C and D. As shown in these figures, hollow carbon nanofibers (HCNFs) were obtained. A huge difference in the morphology between the solid carbon nanofibers and the hollow core structure in the HCNFs was observed. This is due to using a bi-component polymer in the co-axial technique, which was the proposed strategy in this study to increase the surface area without chemical modification to maintain the chemical stability of the carbon material. The inset image in Fig. 3D indicates that the hollow core tube ran along the fiber edge. As mentioned in the introduction section, PMMA does not have good thermal stability characteristics as it totally decomposes at high temperatures leaving no remaining residual material. To scientifically prove this hypothesis, thermal gravimetric analysis (TGA) was carried out; the results are displayed in Fig. 4. As shown in this figure, pristine PAN left behind a considerable amount of residual material (∼35%), however most of the weight of the PMMA–PAN nanofibers disappeared upon increasing the temperature. Approximately, 93% of the original weight was eliminated when the PMMA–PAN nanofibers were heated to 450 °C as a result of the total thermal decomposition of PMMA into gaseous products.41Fig. 5 displays the XRD patterns from the prepared solid and hollow CNFs. As shown in the figure, the graphite diffraction peaks at 2θ 26.3° corresponding to an experimental d spacing of 3.37 Å, indicate the presence of graphite-like carbon (d (002), JCPDS; 41-1487) in both formulations. However, there is a distinct difference in the peak intensities, which indicates that the graphitization of the hollow carbon nanofiber structures is lower than the graphitization of the solid carbon nanofibers. The broad peak and a complete absence of higher order peaks in the XRD patterns suggest a disordered amorphous structure for the HCNFs.
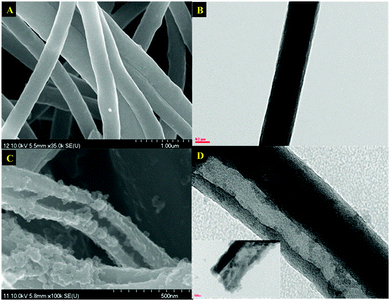 |
| | Fig. 3 FESEM and TEM images for the obtained nanofibers after calcination of the pristine PAN (A and B) and PMMA–PAN (C and D) in an Ar atmosphere at 1000 °C. The inset in D demonstrates the hollow nanofiber edge. | |
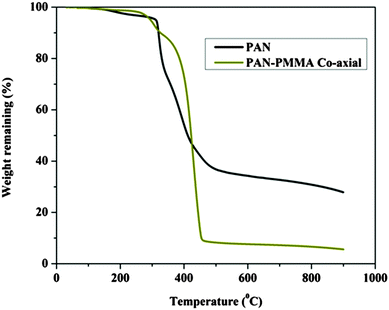 |
| | Fig. 4 TGA thermograms of the PAN and PMMA–PAN electrospun nanofibers. | |
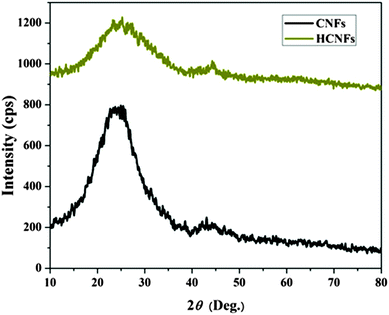 |
| | Fig. 5 XRD analysis of the carbon nanofibers and hollow carbon nanofibers. | |
3.2 Surface area and pore structure of the HCNFs
Undoubtedly, the high surface area and suitable porous structure strongly enhance ion accumulation during the CDI process. The surface area characteristics of the prepared CNFs and HCNFs were evaluated by nitrogen isotherms, and the structure porosities were determined using the Barrett–Joyner–Halenda (BJH) method. The N2 adsorption–desorption isotherms in Fig. 6A indicate that the HCNFs have a typical type-IV isotherm with a clear hysteresis loop between the adsorption and desorption branches. It is known that a hysteresis loop at lower relative pressure (0.4–0.8) indicates the presence of mesopores and one at higher relative pressure (0.8–1.0) is attributed to macropores. The CNFs hysteresis loop refers to the presence of small desirable microspores beside the mesopores that leads to a decrease in the electrosorption capacity.42 The BJH pore size distribution graphs in Fig. 6B indicate that the pore sizes of both types of nanofibers are located in the range of the mesopores zone (2–50 nm). The BET surface areas, pore volumes, and average pore sizes of the prepared nanofibers are summarized in Table 1. The HCNFs have a high surface area (185.97 m2 g−1) with a high volume adsorbed, however the solid CNFs have a surface area of 17.79 m2 g−1, which is almost one tenth of the surface area of the HCNFs. The high increase in the surface area is attributed to the hollow structure of the HCNFs.
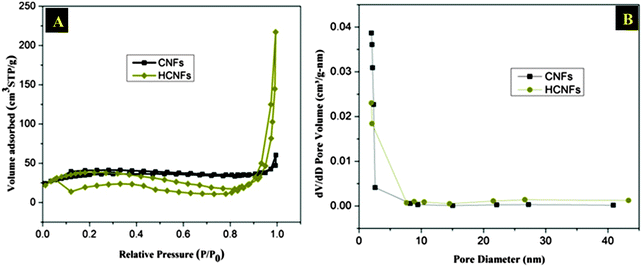 |
| | Fig. 6 (A) Nitrogen adsorption–desorption isotherms and (B) pore size distribution graphs of the synthesized materials. | |
Table 1 Textural characteristics of the CNFs and HCNFs
| Sample |
S
BET (m2 g−1) |
V
BJH(cm3 g−1) |
Average pore size (nm) |
| HCNFs |
185.97 |
0.293121 |
3.5 |
| CNFs |
17.17 |
0.050 |
4.6 |
3.3 Electrochemical performance and specific capacitance of the HCNFs
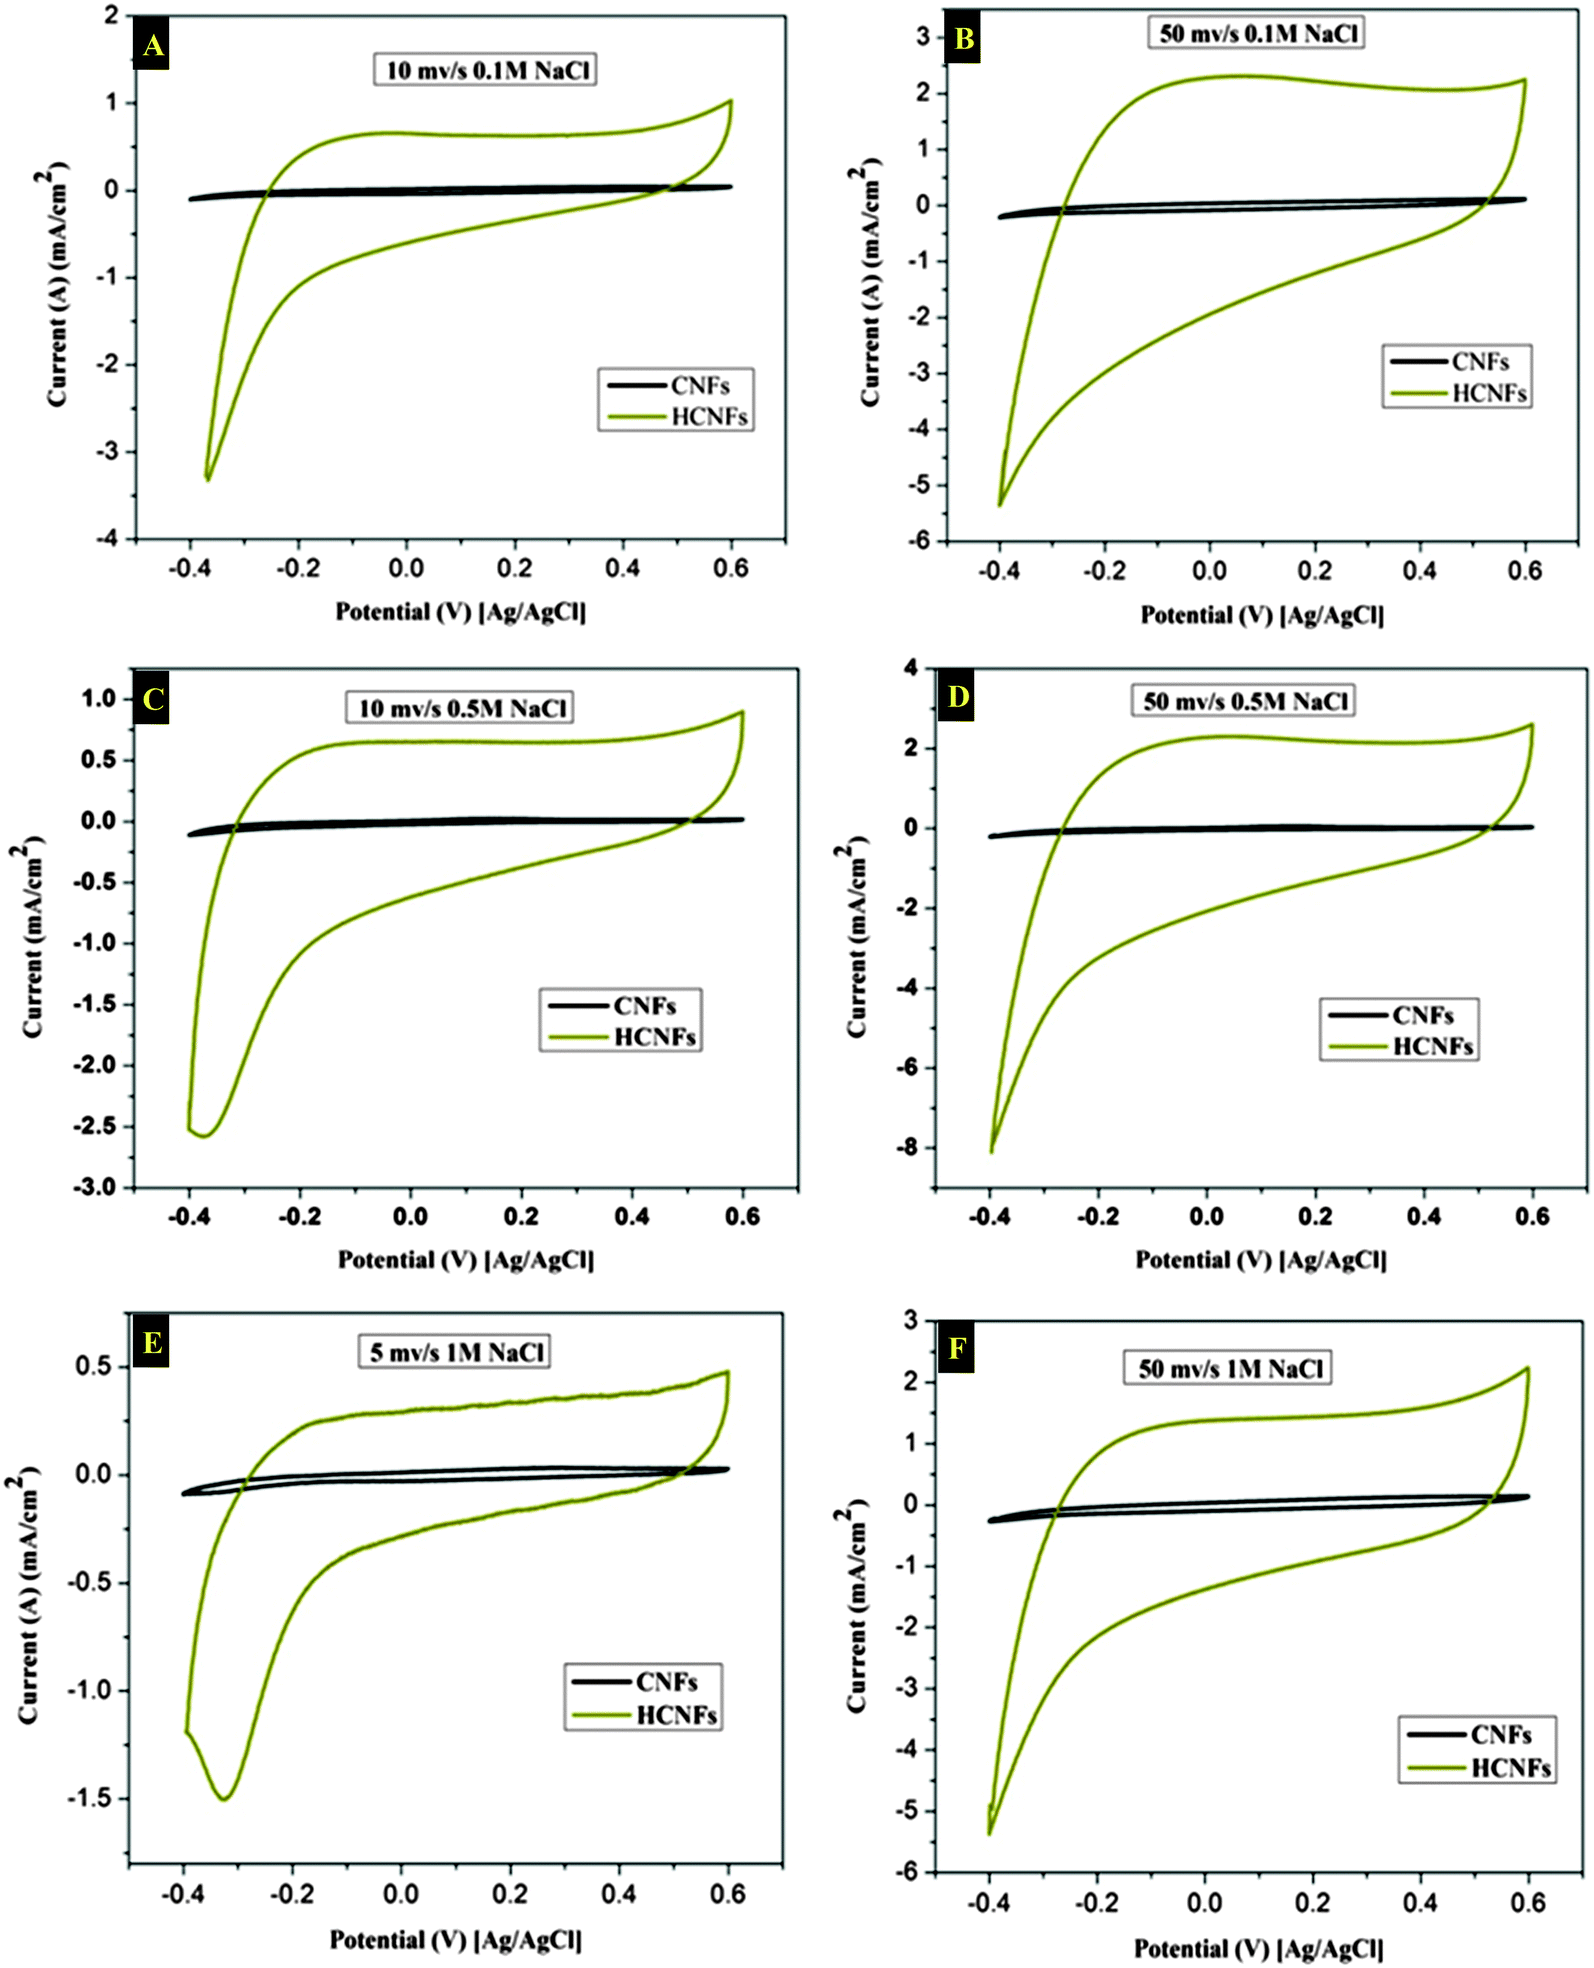
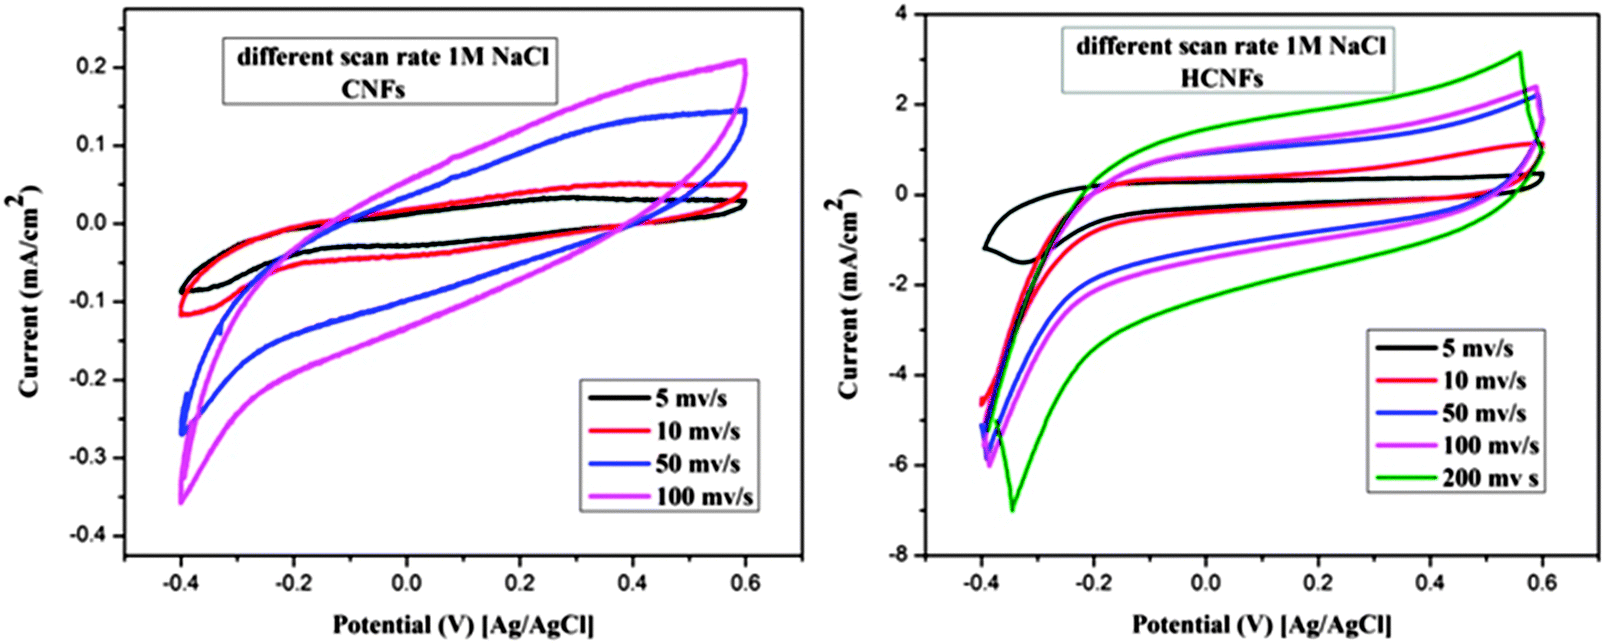
The electrochemical properties of the three electrode samples were investigated using cyclic voltammetry (CV) with the potential range of −0.4 and 0.6 V at different scan rates and using various NaCl concentrations. CV measurements are widely used to evaluate the CDI performance. Fig. 7A and B show the cyclic voltammogram curves of the HCNF and CNF electrodes with scan rates of 10 and 50 mV s−1 at NaCl concentrations of 0.1 and 0.5 M. As shown in the figures, the HCNF electrode displays a high and significant efficiency compared to the CNF electrode. Good symmetry with respect to the x axis and no obvious oxidation–reduction peaks were found for the HCNFs, which elucidate that the capacitive process was highly reversible. Moreover, the obtained rectangular shapes imply excellent electrochemical double-layer capacitance behaviors.43 Interestingly, Fig. 7C–F demonstrate that the HCNFs still have a high electrosorption capacity at high concentrations of NaCl, which indicates the high saturation level of the HCNFs due to the huge amount of mesopores on the outer shell surface and the internal hollow channel structures. The specific capacitance values of the prepared electrodes, which provide an effective way to investigate the performance of CDI electrode materials, were obtained from the CV results. Fig. 8 shows the cyclic voltammograms of the CNFs and HCNFs at different scan rates in 1 M NaCl. Applying eqn (1) to the data obtained in Fig. 8 determined the specific capacitance values. Interestingly, the acute difference in the current at the same scan rate clearly emphasized the enhanced effectiveness of the HCNF electrode towards desalination. As shown in Fig. 9, the corresponding specific capacitance values of the HCNF electrode were noticeably higher compared to the solid CNFs. Typically, at a 5 mV s−1 scan rate, the specific capacitance values were 222.26 and 63.12 F g−1 for the HCNFs and CNFs, respectively. In general, the electrosorption capacitance of the electrodes was higher at lower scan rates. This is because the diffusion of ions from solution had more available access to the electrode surface so led to more surface adsorption–desorption of the ions.44 However, at high scan rates, the effective inner surface adsorption of ions was reduced accordingly.
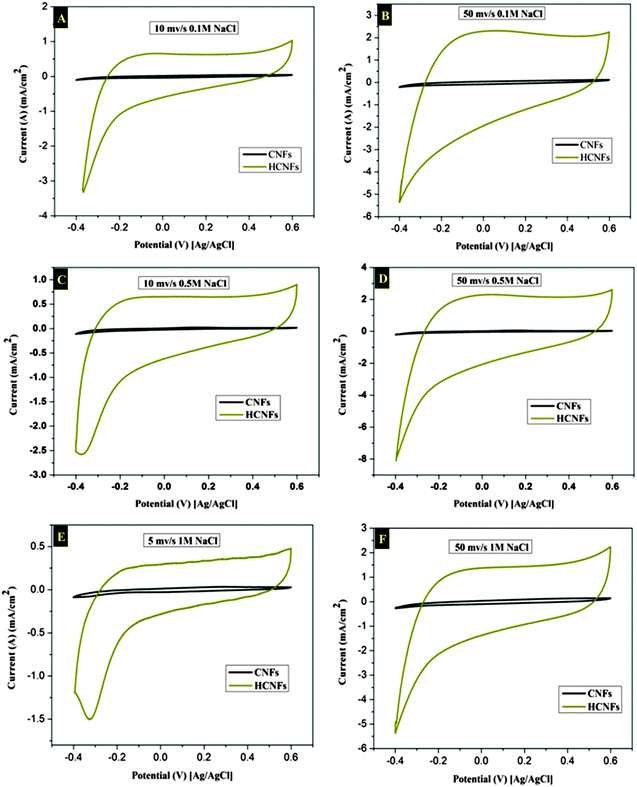 |
| | Fig. 7 Cyclic voltammetry results for the CNFs and HCNFs at scan rates of 5, 10 and 50 mV s−1, and for NaCl concentrations of 0.1, 0.5 and 1 M. | |
 |
| | Fig. 8 Cyclic voltammetry results for the CNFs and HCNFs at different scan rates and 1 M NaCl concentration. | |
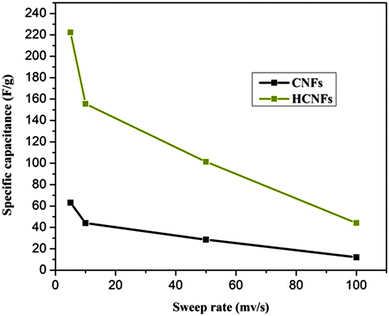 |
| | Fig. 9 Specific capacitance values for the CNFs and HCNFs in 1 M NaCl aqueous solution at different sweep rates. | |
Electrochemical impedance spectroscopy (EIS) is widely employed to evaluate the electrical conductivity and storing of electrical energy for CDI electrodes. In Fig. 10, the Nyquist impedance plots for the CNF and HCNF electrodes show similarities in their shapes including the presence of a small semicircle intersecting the real axis in the higher frequency region and a straight line at the very low-frequency region. Both of these are considered distinct characteristics for carbonaceous materials, making them adequate to be utilized as CDI electrodes.45 The semicircle in the high-to-medium frequency region and the corresponding diameter is referred to as the polarization resistance (Rs) of the carbon electrode and is associated with the charge-transfer resistance between the electrode and the salt solution interface.46 The intercept on the real axis (Z′) corresponds to the equivalent series resistance (ESR) value and reflects the resistance from the electrodes, solution, and contact resistance.47 The impedance spectrum shows that the HCNFs are near the intersection point on the real axis at a high frequency. This refers to an infinitesimal ionic resistance of the salt water with a low contact resistance between the electrodes and the current collectors. Hence, the HCNF electrode exhibits an ideal capacitive behavior with a low inter-resistance and a high conductivity.
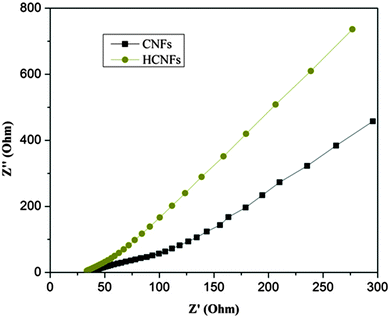 |
| | Fig. 10 Nyquist impedance plots for the CNF and HCNF electrodes. | |
3.4 Salt removal efficiency
The desalination behaviors of the fabricated CNF and HCNF electrodes were estimated using batch mode experiments with a NaCl aqueous solution which had an initial conductivity of ∼89 μS cm−1 (Fig. 11). Obviously, a distinct decrease in the conductivity reflects a noticeable change in the NaCl concentration in the CDI cell, which indicates the capability of the investigated material towards the ionic adsorption–desorption process. The salt removal efficiency plot shown in Fig. 11 demonstrates that the HCNF electrode removed 86.03% of the salt from the brine solution whereas the solid CNF electrode eliminated only 58.1%. The enhancement in salt removal can be attributed to the hollow core structure which gives a great opportunity for ion adsorption from the salt solution to the internal hollow or external punctures on the electrode surface. It is noteworthy to mention that according to eqn (3), the electrosorptive capacity of the HCNF electrode (1.91 mg g−1) was double that of the CNF electrode (0.89 mg g−1) because of the hollow core–shell structure of the modified carbon nanofibers.
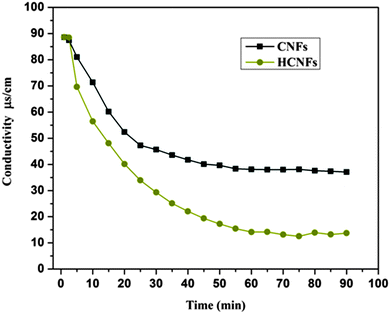 |
| | Fig. 11 CDI performance of the HCNF and CNF electrodes in NaCl solution at 1.2 V. | |
4. Conclusion
Hollow carbon nanofibers were fabricated by utilizing co-axial electrospinning for a bi-polymer system: polyacrylonitrile (PAN) (shell) and poly(methyl methacrylate) (PMMA) (core). Due to the extreme difference in the thermal stability between the two polymers (PMMA completely decomposed during the carbonization step while PAN showed a good stability), hollow carbon nanofibers having a total surface area 10 times larger compared to normal CNFs were synthesized. The synthesised hollow carbon nanofibers had a great ability to adsorb and desorb salt ions compared to the solid carbon nanofibers due to the high specific surface area and small pore diameters. Hence, the synthesised HCNFs can be considered as a promising electrode material for the CDI process.
Acknowledgements
This work was financially supported by the National Plan for Science & Technology (NPST), King Saud University Project No. 11-NAN1460-02. We thank Mr T. S. Bae and J. C. Lim, KBSI, Jeonju branch, and Mr Jong-Gyun Kang, Centre for University Research Facility, for taking high-quality FESEM and TEM images, respectively.
References
- S. Lattemann and T. Höpner, Desalination, 2008, 220, 1–15 CrossRef CAS PubMed.
- P. Storeheier and E. Nordøy, Comp. Biochem. Physiol., Part A: Mol. Integr. Physiol., 2001, 128, 307–315 CrossRef CAS.
- I. Ali and V. Gupta, Nat. Protoc., 2007, 1, 2661–2667 CrossRef PubMed.
- M. A. Shannon, P. W. Bohn, M. Elimelech, J. G. Georgiadis, B. J. Mariñas and A. M. Mayes, Nature, 2008, 452, 301–310 CrossRef CAS PubMed.
- O. N. Demirer, R. M. Naylor, C. A. Rios Perez, E. Wilkes and C. Hidrovo, Desalination, 2013, 314, 130–138 CrossRef CAS PubMed.
- M. A. Anderson, A. L. Cudero and J. Palma, Electrochim. Acta, 2010, 55, 3845–3856 CrossRef CAS PubMed.
- Y. Oren, Desalination, 2008, 228, 10–29 CrossRef CAS PubMed.
- T. Welgemoed and C. Schutte, Desalination, 2005, 183, 327–340 CrossRef CAS PubMed.
- M. Elimelech and W. A. Phillip, Science, 2011, 333, 712–717 CrossRef CAS PubMed.
-
J. Farmer, US Pat., 5,425,858, 1995 Search PubMed.
-
J. H. Richardson, Capacitive deionization system, LLNL, 1996 Search PubMed.
- J. C. Farmer, D. V. Fix, G. V. Mack, R. W. Pekala and J. F. Poco, J. Electrochem. Soc., 1996, 143, 159–169 CrossRef CAS PubMed.
- H. H. Jung, S. W. Hwang, S. H. Hyun, L. Kang-Ho and G. T. Kim, Desalination, 2007, 216, 377–385 CrossRef CAS PubMed.
- L. Zou, G. Morris and D. Qi, Desalination, 2008, 225, 329–340 CrossRef CAS PubMed.
- H. J. Oh, J. H. Lee, H. J. Ahn, Y. Jeong, Y. J. Kim and C. S. Chi, Thin Solid Films, 2006, 515, 220–225 CrossRef CAS PubMed.
- C.-H. Hou and C.-Y. Huang, Desalination, 2013, 314, 124–129 CrossRef CAS PubMed.
- C. Tsouris, R. Mayes, J. Kiggans, K. Sharma, S. Yiacoumi, D. DePaoli and S. Dai, Environ. Sci. Technol., 2011, 45, 10243–10249 CrossRef CAS PubMed.
- Z. Peng, D. S. Zhang, L. Y. Shi and T. T. Yan, J. Mater. Chem., 2012, 22, 6603–6612 RSC.
- G. Wang, Q. Dong, Z. Ling, C. Pan, C. Yu and J. S. Qiu, J. Mater. Chem., 2012, 22, 21819–21823 RSC.
- G. Wang, C. Pan, L. P. Wang, Q. Dong, C. Yu, Z. B. Zhao and J. S. Qiu, Electrochim. Acta, 2012, 69, 65–70 CrossRef CAS PubMed.
- M. Wang, Z.-H. Huang, L. Wang, M.-X. Wang, F. Kang and H. Hou, New J. Chem., 2010, 34, 1843–1845 RSC.
- L. Wang, M. Wang, Z. H. Huang, T. X. Cui, X. C. Gui, F. Y. Kang, K. L. Wang and D. H. Wu, J. Mater. Chem., 2011, 21, 18295–18299 RSC.
- C. Nie, L. Pan, Y. Liu, H. Li, T. Chen, T. Lu and Z. Sun, Electrochim. Acta, 2012, 66, 106–109 CrossRef CAS PubMed.
- D. S. Zhang, T. T. Yan, L. Y. Shi, Z. Peng, X. R. Wen and J. P. Zhang, J. Mater. Chem., 2012, 22, 14696–14704 RSC.
- H. B. Li, L. K. Pan, C. Y. Nie, Y. Liu and Z. Sun, J. Mater. Chem., 2012, 22, 15556–15561 RSC.
- H. B. Li, L. D. Zou, L. K. Pan and Z. Sun, Environ. Sci. Technol., 2010, 44, 8692–8697 CrossRef CAS PubMed.
- M. Inagaki, Y. Yang and F. Kang, Adv. Mater., 2012, 24, 2547–2566 CrossRef CAS PubMed.
- A. Yousef, N. M. Barakat, T. Amna, M. Abdelkareem, A. Unnithan, S. Al-Deyab and H. Kim, Macromol. Res., 2012, 1–6 Search PubMed.
- N. A. M. Barakat, M. Shaheer Akhtar, A. Yousef, M. El-Newehy and H. Y. Kim, Chem. Eng. J., 2012, 211–212, 9–15 CrossRef CAS PubMed.
- X. Tao, X. Zhang, L. Zhang, J. Cheng, F. Liu, J. Luo, Z. Luo and H. J. Geise, Carbon, 2006, 44, 1425–1428 CrossRef CAS PubMed.
- T. Liu, S. Gu, Y. Zhang and J. Ren, J. Polym. Res., 2012, 19, 1–6 CrossRef PubMed.
- J. R. McDonough, J. W. Choi, Y. Yang, F. La Mantia, Y. Zhang and Y. Cui, Appl. Phys. Lett., 2009, 95, 243109 CrossRef.
- M. Tsuji, M. Kubokawa, R. Yano, N. Miyamae, T. Tsuji, M. S. Jun, S. Hong, S. Lim, S. H. Yoon and I. Mochida, Langmuir, 2007, 23, 387–390 CrossRef CAS PubMed.
- N. A. Barakat, M. A. Kanjawal, I. S. Chronakis and H. Y. Kim, J. Mol. Catal. A: Chem., 2012, 336, 333–340 Search PubMed.
- A. Anson, J. Jagiello, J. B. Parra, M. L. Sanjuan, A. M. Benito, W. K. Maser and M. T. Martínez, J. Phys. Chem. B, 2004, 108, 15820–15826 CrossRef CAS.
- C. Kim, Y. I. Jeong, B. T. N. Ngoc, K. S. Yang, M. Kojima, Y. A. Kim, M. Endo and J. W. Lee, Small, 2006, 3, 91–95 CrossRef PubMed.
- N. S. Kwak, J. S. Koo, T. S. Hwang and E. M. Choi, Desalination, 2012, 285, 138–146 CrossRef CAS PubMed.
- N. A. Barakat, A. G. El-Deen, G. Shin, M. Park and H. Y. Kim, Mater. Lett, 2013, 99, 168–171 CrossRef CAS PubMed.
- H. Li, L. Pan, Y. Zhang, L. Zou, C. Sun, Y. Zhan and Z. Sun, Chem. Phys. Lett., 2010, 485, 161–166 CrossRef CAS PubMed.
- Z. Sun, E. Zussman, A. L. Yarin, J. H. Wendorff and A. Greiner, Adv. Mater., 2003, 15, 1929–1932 CrossRef CAS.
- N. E. Zander, K. E. Strawhecker, J. A. Orlicki, A. M. Rawlett and T. P. Beebe Jr, J. Phys. Chem. B, 2011, 115, 12441–12447 CrossRef CAS PubMed.
- J.-H. Lee, W.-S. Bae and J.-H. Choi, Desalination, 2010, 258, 159–163 CrossRef CAS PubMed.
- G. Wang, L. Zhang and J. Zhang, Chem. Soc. Rev., 2012, 41, 797–828 RSC.
- L. Zou, L. Li, H. Song and G. Morris, Water Res., 2008, 42, 2340–2348 CrossRef CAS PubMed.
- D. Zhang, X. Wen, L. Shi, T. Yan and J. Zhang, Nanoscale, 2012, 4, 5440–5446 RSC.
- C. Kim and K. Yang, Appl. Phys. Lett., 2003, 83, 1216–1218 CrossRef CAS.
- H. Xia, Y. Wang, J. Lin and L. Lu, Nanoscale Res. Lett., 2012, 7, 1–10 CrossRef PubMed.
|
| This journal is © The Royal Society of Chemistry and the Centre National de la Recherche Scientifique 2014 |
Click here to see how this site uses Cookies. View our privacy policy here.