Local control of hepatic phenotype with growth factor-encoded surfaces†
Dipali
Patel‡
a,
Amranul
Haque‡
a,
Caroline N.
Jones
a,
Nazgul
Tuleouva
a,
Elena
Foster
a,
Tam
Vu
a,
A. Hari
Reddi
b and
Alexander
Revzin
*a
aDepartment of Biomedical Engineering, University of California, Davis, 451 East Health Sciences St. #2619, Davis, CA, USA. E-mail: arevzin@ucdavis.edu
bDepartment of Orthopaedic Surgery, Center for Tissue Regeneration and Repair, University of California, Davis, Sacramento, 95817 USA
First published on 11th November 2013
Abstract
The goal of the present study was to modulate the phenotype expression of hepatocytes in vitro on surfaces imprinted with growth factors (GFs). Hepatocyte growth factor (HGF) or transforming-growth factor-β1 (TGF-β1) were mixed with collagen (I) and robotically printed onto standard glass slides to create arrays of 300 μm or 500 μm diameter spots. Primary rat hepatocytes were seeded on top of the arrays, forming clusters corresponding in size to the underlying protein spots. The TGF-β1 spots appeared to downregulate markers of hepatic (epithelial) phenotype while upregulating expression of mesenchymal markers. Conversely, hepatocytes cultured on HGF spots maintained high level of epithelial markers. When hepatocytes were seeded onto alternating spots of HGF and TGF-β1, their phenotype was found to depend on center-to-center distance between the spots. At shorter distances cross-expression of epithelial and mesenchymal markers was observed while at distances exceeding 1.25 mm divergence of phenotypes, epithelial on HGF and mesenchymal on TGF-β was seen. Overall, our results demonstrate that GF-encoded surfaces can modulate phenotype within groups of cells cultured on the same surface. Given the importance of phenotype switching in development, fibrosis and cancer, this platform may be used to gain useful insights into the mechanisms of processes such as epithelial-to-mesenchymal transition or stem cell fate selections.
Insight, innovation, integrationThis paper describes the use of micropatterned, growth factor-containing surfaces to deliver divergent signals to groups of primary hepatocytes cultured on the same substrate. Using such surface, we demonstrate that groups of hepatocytes expressing epithelial and mesenchymal phenotype can co-exist hundreds of micrometers away from each other. The concept of phenotype divergence described here has important implications in tissue engineering for generating complex multi-phenotype tissue constructs. |
Introduction
Local signaling is at the core of multiple biological processes related to embryogenesis, regeneration and tissue injury.1–5 For example, in the liver, stem cell niche is purported to be located in the canals of Hering – an anatomical structure where biliary epithelial cell, stem cell and hepatocyte populations are juxtaposed.6,7 It is presumed that perturbation to the microenvironment, during injury for example, triggers local production of paracrine factors which in turn guide stem cell fate selection to biliary or hepatic phenotype.7,8 Another example of location-specific paracrine signaling is related to liver injury. Because injurious agents are carried into the liver through portal vein, their effects are more pronounced in periportal regions. These regions are associated with aberrant matrix deposition, higher levels of pro-fibrogenic growth factors, presence of activated mesenchymal cells that produce such growth factors.9,10 These are but two of many examples highlighting the importance of local paracrine signaling in tissue development and injury.Transforming growth factor (TGF)-β1 and hepatocyte growth factor (HGF) are two key liver-related morphogens. TGF-β, a pro-fibrogenic paracrine factor produced in the injured liver by activated mesenchymal cells, is associated with de-differentiation and epithelial-to-mesenchymal transition (EMT) of hepatocytes.11–13 HGF on the other hand has hepatoprotective properties,14–17 has been shown to antagonize TGF-β1 and help maintain epithelial phenotype of hepatocytes during injury.18
Hepatocytes are epithelial cells that favor cell–cell contact, low motility and express only cytokeratin as intermediate filaments (IF).19 Typically, change from epithelial to mesenchymal phenotypes in hepatocytes is associated with loss of cell–cell contact and acquisition of mesenchymal features including switch from E- to N-cadherin and increase in cellular motility.12,13 There is also progressive replacement of cytokeratin by vimentin IFs.20 As noted in the previous paragraph, this transformation is promoted by pro-fibrogenic cytokines such as TGF-β and is prevented by anti-fibrogenic signals such as HGF.18
In the present work, we wanted to deliver contradictory signals, HGF and TGF-β, to primary hepatocytes residing in the same culture dish in order to study phenotype plasticity and communication between the cells. There are a number of strategies for defining local cell microenvironment, including scaffolds,21–23 micropatterned surfaces24–27 and microfluidic devices.28–30 We chose to build on the strategy for GF patterning reported by us previously,31,32 whereby GF molecules are mixed with carrier ECM protein in solution and are printed on the culture surface. These GF molecules were not only retained on the surface for several days under physiological conditions but were also highly functional, helping to maintain phenotype of primary hepatocytes31,32 and inducing hepatic phenotype in stem cells.26,33–35 In the set of experiments described in the present paper, HGF and TGF-β1 spots were printed side by side and were used for cultivation of primary rat hepatocytes. These GF encoded surfaces where used to characterize how epithelial vs. mesenchymal phenotype of cells varied as a function of local delivery of signals. Additional studies were conducted to control the distance between the GF spots in order to investigate paracrine cross-talk between groups of hepatocytes receiving divergent signals.
Materials and methods
Chemicals and materials
Glass slides (75 × 25 mm2) were obtained from VWR (West Chester, PA). (3-Acryloxypropyl) trichlorosilane was purchased from Gelest, Inc. (Morrisville, PA). Collagenase, collagen from rat tail (type I), AlexaFluor 488 anti-goat IgG, AlexaFluor 546 anti-mouse IgG were purchased from Invitrogen (Carlsbad, CA). Hepatocyte growth factor (HGF) and transforming growth factor-β1 (TGF-β1) were obtained from Sigma-Aldrich (St. Louis, MO). Phosphate-buffered saline (1 × PBS), minimal essential medium (MEM), sodium pyruvate, nonessential amino acids, and fetal bovine serum (FBS) were purchased from Invitrogen. 384-well polypropylene microarray plates were obtained from Genetix (New Milton, Hampshire). Albumin ELISA kits and goat anti-rat cross-adsorbed albumin antibody were obtained from Bethyl Laboratories (Montgomery, TX). Paraformaldehyde was purchased from Electron Microscopy Sciences (Hatfiled, PA). DAPI stain mounting media was purchased from Vectorshield (Burlingame, CA). SU11274 and SB431542 were purchased from Selleckchem.Printing collagen and GF spots on glass substrates
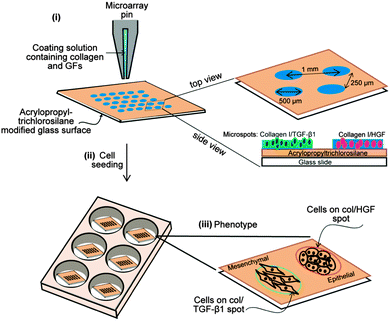
Glass slides were modified with acryloxypropyl trichlorosilane using protocols described previously.31 Collagen was dissolved in 1 × PBS + 0.005% Tween-20 at 0.2 mg mL−1 concentration. GFs were mixed with the ECM solution to the desired final concentration of 500 ng mL−1 for HGF and 250 ng mL−1 TGF-β and allowed to bind to the ECM protein for 30 min at room temperature prior to printing. Protein microarrays were contact-printed under ambient conditions on silane-modified 75 × 25 mm2 glass slides using a hand-held MicroCaster. The pins collected protein from a 384-well plate, dispensing 20–70 nL of solution onto the glass slide and forming circular spots ∼500 μm in diameter. Spots of this size were used for majority of experiments; however, smaller 150 μm diameter spots were printed in some instances to show multiple spots and divergent cell phenotypes in the same field of view. Arrays of alternating collagen control, HGF, TGF-β and a mixture of HGF and TGF-β (HGF + TGF-β) were created as shown in Fig. 1. Pins were cleaned in acetone via sonication for 5 min and subsequently washed with pin-cleaning solution (DI water and isopropanol) between each change in growth factor to avoid growth factor cross-contamination. Pins were dried with nitrogen before protein printing. A spotbot arrayer was used to generate patterns with varying distances between GFs. Protein arrays were kept in a refrigerator overnight prior to cell cultivation.Cultivation of primary hepatocytes on GF microarrays
Adult female Lewis rats weighing 125–200 g were purchased from Charles River Laboratories (Boston, MA) and fed with a commercial diet and water. All animal experiments were performed according to the National Institutes of Health (NIH) guidelines for the ethical care and use of laboratory animals and the experimental protocol was approved by the Institutional Animal Care and Use Committee (IACUC) of the University of California, Davis.Primary hepatocytes were isolated from adult female Lewis rats using a standard two-step collagenase perfusion procedure.36 Typically, 100 to 200 million hepatocytes were obtained with viability >90% as determined by trypan blue exclusion. Primary hepatocytes were maintained in DMEM supplemented with epidermal growth factor (EGF), glucagon, hydrocortisone sodium succinate, recombinant human insulin, 200 units per mL penicillin, 200 μg mL−1 streptomycin and 10% FBS. For cell seeding experiments, a glass slide containing printed arrays of ECM/GF was cut into (1 × 1) squares to fit into a 6-well plate. Typically, GFs were printed into arrays of 500 μm diameter spots. The distance between rows was 250 μm and the center-to-center spacing of the spots was 1 mm. Hepatocytes were seeded to form cellular arrays using protocols described elsewhere.25 In brief, glass slides containing printed ECM/GF spots were first exposed to 3 mL of hepatocytes suspended in culture medium at a concentration of 1 × 10⁶ cells per mL. After 1 h of incubation at 37 °C, hepatocytes bound on ECM/GF domains, but did not attach on the surrounding silane-modified surface. The samples were then washed twice in PBS to remove unbound hepatocytes and fresh media was added to the sample well.
Inhibition of HGF signaling
In order to study the roles of HGF and TGF-β1 in distance-dependent modulation of EMT in rat primary hepatocytes, we administered c-met inhibitor (SU11274, 5 μM), a potent inhibitor of HGF induced signaling pathway and TGF-β1 blockers (SB431542, 5 μM). Following initial adhesion, the hepatocytes were cultured for five days in presence of inhibitors. Hepatocyte cultures without inhibitors were always grown in parallel as controls. Media was changed every second day.Analysis of hepatic phenotype
Expression of hepatic phenotype was assessed by ELISA to measure the albumin and urea secretion. Western blotting and immunostaining was also performed to measure epithelial and mesenchymal markers in protein level. For ELISA, cell culture supernatant was collected everyday and assayed according to manufacturer's instructions (R&D systems).For immunostaining, cells were fixed in 4% paraformaldehyde + 0.3% Triton-X100 in PBS for 15 min. The cells were then incubated in blocking solution (1% bovine serum albumin (BSA) in PBS) for 1 h and exposed to primary antibody for 90 min. The samples were washed for three times, and incubated with appropriate secondary antibodies conjugated with Alexa Fluorophore (Invitrogen) for 1 h. After three times washing, slides were mounted onto cover slips using DAPI stain mounting media. All incubations were performed at room temperature unless otherwise mentioned. Primary antibodies used in this study were mouse anti-E-cadherin (BD Transduction Laboratories, 1![[thin space (1/6-em)]](https://www.rsc.org/images/entities/char_2009.gif) :
:![[thin space (1/6-em)]](https://www.rsc.org/images/entities/char_2009.gif) 50 dilutions), mouse anti-N-cadherin (Sigma, 1
50 dilutions), mouse anti-N-cadherin (Sigma, 1![[thin space (1/6-em)]](https://www.rsc.org/images/entities/char_2009.gif) :
:![[thin space (1/6-em)]](https://www.rsc.org/images/entities/char_2009.gif) 100 dilutions) and goat anti-vimentin (Santa Cruz, 1
100 dilutions) and goat anti-vimentin (Santa Cruz, 1![[thin space (1/6-em)]](https://www.rsc.org/images/entities/char_2009.gif) :
:![[thin space (1/6-em)]](https://www.rsc.org/images/entities/char_2009.gif) 100 dilutions). Secondary antibodies were anti-mouse IgG conjugated with alexa-546 (diluted 1
100 dilutions). Secondary antibodies were anti-mouse IgG conjugated with alexa-546 (diluted 1![[thin space (1/6-em)]](https://www.rsc.org/images/entities/char_2009.gif) :
:![[thin space (1/6-em)]](https://www.rsc.org/images/entities/char_2009.gif) 1000) and anti-goat IgG conjugated with alexa-488 (diluted 1
1000) and anti-goat IgG conjugated with alexa-488 (diluted 1![[thin space (1/6-em)]](https://www.rsc.org/images/entities/char_2009.gif) :
:![[thin space (1/6-em)]](https://www.rsc.org/images/entities/char_2009.gif) 1000). The fluorescence intensity was assessed with imageJ software (http://rsbweb.nih.gov/ij/) to provide semi-quantitative measure of the expression level of target proteins. Fluorescent images of approximately 5 spots in at least three independent experiments of each condition were captured by confocal microscope (Zeiss LSM Pascal). The expression level was normalized with DAPI intensity.
1000). The fluorescence intensity was assessed with imageJ software (http://rsbweb.nih.gov/ij/) to provide semi-quantitative measure of the expression level of target proteins. Fluorescent images of approximately 5 spots in at least three independent experiments of each condition were captured by confocal microscope (Zeiss LSM Pascal). The expression level was normalized with DAPI intensity.
For western blotting, the total cellular protein was extracted with lysis buffer (10 mM Tris-HCl, 150 mM NaCl, 1% Nonidet P-40, 10 mM EDTA, and protease inhibitor cocktail; PH 7.4), and cell lysates were centrifuged at 15![[thin space (1/6-em)]](https://www.rsc.org/images/entities/char_2009.gif) 000×g for 15 min at 4 °C. Samples were separated by electrophoresis on mini-protein precast gels (Bio-Rad) and electrophoretically transferred to a polyvinylidene difluoride membrane (Immobilon-P; Millipore). The primary antibodies were as follows: mouse anti-E-cadherin (BD Transduction Laboratories), rabbit anti-alpha-smooth muscle actin (Abcam), and mouse anti-β-actin (Sigma). The membranes were then reacted with horseradish peroxidase (HRP)-conjugated secondary antibody (1
000×g for 15 min at 4 °C. Samples were separated by electrophoresis on mini-protein precast gels (Bio-Rad) and electrophoretically transferred to a polyvinylidene difluoride membrane (Immobilon-P; Millipore). The primary antibodies were as follows: mouse anti-E-cadherin (BD Transduction Laboratories), rabbit anti-alpha-smooth muscle actin (Abcam), and mouse anti-β-actin (Sigma). The membranes were then reacted with horseradish peroxidase (HRP)-conjugated secondary antibody (1![[thin space (1/6-em)]](https://www.rsc.org/images/entities/char_2009.gif) :
:![[thin space (1/6-em)]](https://www.rsc.org/images/entities/char_2009.gif) 10
10![[thin space (1/6-em)]](https://www.rsc.org/images/entities/char_2009.gif) 000 dilution; Jackson ImmunoResearch Laboratories) for 1 h. HRP activity was assayed using chemiluminescent substrate (Thermo Scientific) according to the manufacturer's instruction.
000 dilution; Jackson ImmunoResearch Laboratories) for 1 h. HRP activity was assayed using chemiluminescent substrate (Thermo Scientific) according to the manufacturer's instruction.
Statistical analyses
Data are presented as the mean ± standard deviations (SD). Statistical analyses were performed with Student's t-test for paired samples. A p-value < 0.05 was considered statistically significant.Results and discussion
The goal of this study was to investigate how phenotype of hepatocytes is affected by local presentation of GFs. Our experiments demonstrate that phenotype of cells bathed in the same medium and cultured on the same surface may be regulated in a spatially-defined manner using imprinted GFs.Location-specific differences in cell morphology on GF-containing surfaces
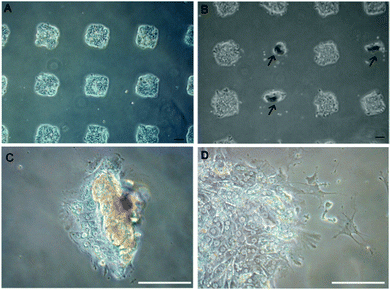
Examples of hepatocytes residing on printed ECM/GF spots are provided in Fig. 2. After 5 days of culture, cells residing on top of HGF started to rolled up into tissue-like spheroids, forming three-dimensional clusters (arrows pointing in Fig. 2), as has been observed previously by our group.31 To monitor the effect of different GFs on the morphology of cells on the same surface, we patterned arrays of alternating col/HGF and col/TGF-β1 spots. The center-to-center distance between spots was 1 mm. In our previous report we observed that hepatocytes cultured on printed HGF spots transitioned form monolayer to spheroids at ∼day 5 in culture and that these spheroids expressed high levels of hepatic markers.31Fig. 2A shows an array of 150 μm diameter GF/ECM spots 24 h after seeding where one can see formation of an array of cell clusters corresponding in size to printed protein spots. As seen from Fig. 2B, dramatic differences in morphology emerge by day 5 in culture, with hepatocytes on HGF forming spheroids while hepatocytes on neighboring TGF-β spots remained as monolayer. Fig. 2C and D provides higher magnification view of the spheroids on HGF as well as cells on TGF-β. In the latter case, some of the cells exhibited spindle like morphology common to mesenchymal cells after 5 days in culture. We also prepared collagen type I spots containing a mixture of HGF and TGF-β1. Interestingly, a divergent population of epithelial-like cells and mesenchymal-like cells was observed from a single population of primary rat hepatocytes cultured on a spot containing a mixture of both GFs (Fig. S1A, ESI†). Overall, micropatterning of HGF and TGF-β on the same surface led to a distinct, location-specific difference in morphology of primary hepatocytes. Given that in hepatocytes HGF and TGF-β promote epithelial and mesenchymal phenotypes respectively, we carried out additional experiments looking at specific markers associated with each phenotype.Characterization of hepatocellular phenotype on homogeneous GF containing surfaces
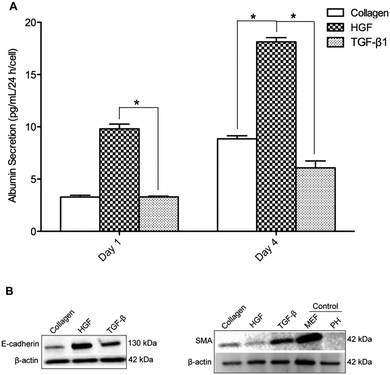
In these experiments we sought to characterize phenotype of hepatocytes cultured on surfaces containing only one type of morphogen. Synthesis of albumin – serum protein produced by the liver – was monitored to assess expression of hepatic (epithelial) phenotype on printed GF spots. Primary rat hepatocytes were cultured for four days on four surface types: collagen type I (col) as a control, col/HGF, col/TGF-β, and col/HGF + col/TGF-β. As shown in Fig. 3A, hepatocytes cultivated on col/HGF exhibited high levels of albumin. The upregulation of albumin production by solid-phase presentation of HGF has been shown by us previously.23,31 In contrast the hepatocytes residing on TGF-β spots exhibited more than 3 fold lower level of albumin at day 4 in culture compared to cells on HGF spots (Fig. 3A). Interestingly, for spots containing a mixture of HGF and TGF-β, we observed intermediate levels of albumin production, higher than on TGF-β alone but lower than on HGF alone (Fig. S1B, ESI†). Moreover, we performed experiments where different concentrations of HGF were printed and the rate of albumin secretion was analyzed (Fig. S2, ESI†). We observed HGF concentration dependent responses in production of albumin in hepatocytes. We would also like to point out our previous work demonstrating GF concentration dependent effects of HGF and BMP7 in protecting hepatocytes against injury.32 Furthermore, urea production rates were also affected by presence of HGF or TGF-β1 on the culture surface (Fig. S3, ESI†). While hepatocytes on TGF-β undergo apoptosis at a higher rate than cells on HGF (17% vs. 7%),32 this cannot explain 2 or 3 fold changes in albumin and urea synthesis. Thus we attribute them to phenotype expression and not cell death.To further verify the effects of HGF and TGF-β1 on hepatocellular phenotype, western blot analysis was performed to assess total E-cadherin and α-smooth muscle actin (SMA) in hepatocytes cultured for four days on three surface types, HGF/col I spots, TGF-β1/col I spots and col I spots. E-cadherin is an epithelial marker that plays a key role in the maintenance of an epithelial phenotype, whereas the expression of SMA was used as a marker of mesenchymal phenotype. Increased expression of E-cadherin and downregulation of SMA was found to occur concurrently in hepatocytes cultured on HGF spots (Fig. 3B). In contrast, SMA expression level was higher on TGF-β1 spots. The data in Fig. 3B show that, similar to albumin, cells atop HGF spots showed strong epithelial markers while cells on TGF-β showed weak expression of epithelial marker but higher levels of mesenchymal marker.
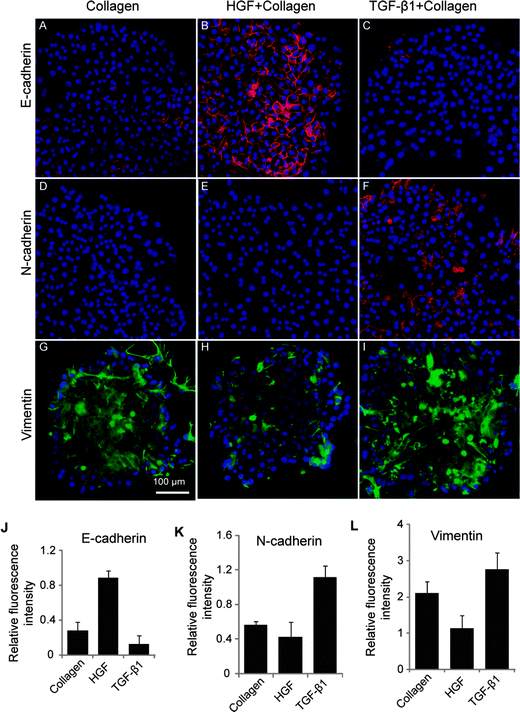
Additional phenotype analysis was carried out by immunofluorescent staining for cell adhesion markers (E- and N-cadherin). N-cadherin is another mesenchymal marker characteristic of fibroblastic cells. The first EMT event during development is the cadherin switch whereby there is repression in E-cadherin expression and an upregulation in N-cadherin expression.37 Expression of E- and N-cadherin in hepatocytes residing on GF spots was assessed in order to ascertain induction of mesenchymal or epithelial phenotype with surface-immobilized GFs. These data presented in Fig. 4A–C reveal several interesting observations. Similar to albumin ELISA and western blot analysis, the highest level of E-cadherin expression was observed on HGF spots. In contrast, E-cadherin expression level was significantly lower on TGF-β1 spots. On the other hand, N-cadherin was sharply upregulated in cells on TGF-β1 spots whereas its expression was undetectable in cells cultured on HGF spots (Fig. 4D–F). Immunofluorescent staining for vimentin, an intermediate filament characteristic of mesenchymal cells and epithelial-to-mesenchymal transition,38 revealed high levels of expression in cells cultured on TGF-β1 spots (Fig. 4G–I). The expression of mesenchymal markers was intermediate in cells on collagen spots without growth factors. The fluorescence intensity associated with intracellular E-cadherin, N-cadherin, and vimentin was assessed with imageJ software (Fig. 4J–L) to provide semi-quantitative measure of the immunofluorescence results.
Phenotype expression on heterogeneous GF-containing surfaces
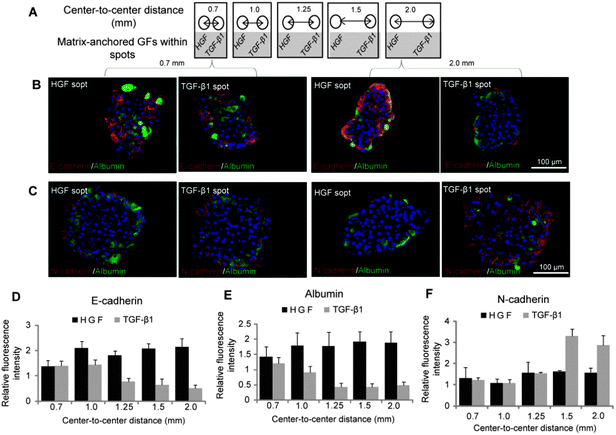
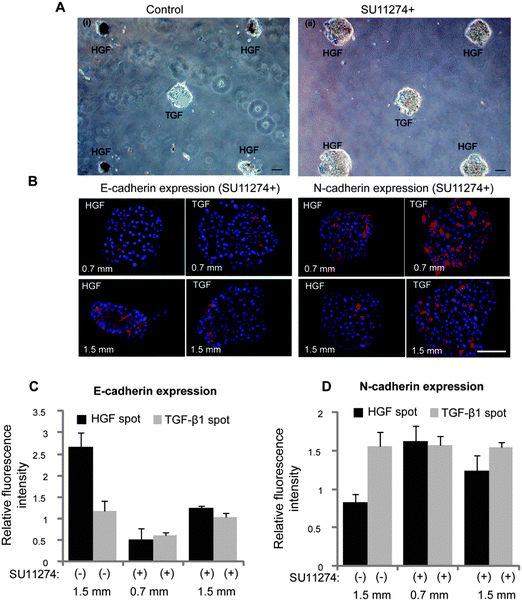
After demonstrating that phenotype of hepatocytes could be modulated by surfaces containing either HGF or TGF-β spots, we wanted to observe how hepatic phenotype would be affected when both types of spots are present on the same culture surface. As described in Fig. 5A, we printed alternating col/HGF and col/TGF-β1 300 μm diameter spots while varying center to center distances as follows: 0.7 mm, 1.0 mm, 1.25 mm, 1.5 mm and 2.0 mm. Immunofluorescent staining for epithelial (E-cadherin and albumin) and mesenchymal (N-cadherin) was used to characterize hepatic phenotype (Fig. 5B and C). In the course of these experiments it was observed that cells cultured on HGF and TGF-β1 spots at shorter distance of 0.7 mm had similar levels of E-cadherin, albumin and N-cadherin expression. However, cells cultured on HGF spots at longer distance (2.0 mm) expressed high levels of E-cadherin and albumin, while cells on TGF-β1 strongly expressed mesenchymal marker N-cadherin (Fig. 5B and C). Quantification of fluorescence intensity of epithelial markers shown in Fig. 5D and E highlights distance-dependent differences in phenotype. Distance-dependent trend was also observed for N-cadherin (Fig. 5F). This mesenchymal marker was expressed at a similar level in cells residing on HGF and TGF-β at shorter center-to-center distances, but as the distance increased to 1.5 mm and beyond a clear difference was observed, with N-cadherin levels in hepatocytes on TGF-β1 spots significantly higher than in cells on HGF spots.Additional experiments were carried out to investigate the contributions of HGF signaling to the phenotype divergence behavior described in Fig. 5. In these experiments, hepatocytes were cultured in presence of HGF receptor (c-met) inhibitor (SU11274) on micropatterned surfaces containing alternating HGF and TGF-β spots. One striking observation was that hepatocytes did not undergo spheroid formation when pre-incubated with c-met inhibitor. Fig. 6A–i shows images of hepatocytes forming spheroids on HGF spots while remaining as monolayer on TGF-β spots. These data highlight local changes in cellular morphology conferred by imprinted GFs. In contrast, hepatocytes treated with c-met inhibitor (SU11274) did not form spheroids (Fig. 6A–ii). The level of E-cadherin expression in hepatocytes exposed to c-met blocker was lower for cells cultured on HGF and TGF-β spots compared to controls not treated with c-met blocker (Fig. 6B and C). Importantly, the same set of data show that c-met inhibition abrogated distance dependent effects in E-cadherin expression on TGF-β spots. Fig. 6B and D also shows that in the presence of c-met inhibitor, N-cadherin went up on HGF spots. Similarly, there is no distance dependent effect in N-cadherin expression on TGF-β spots. This is in contrast to Fig. 5 that shows an increase in N-cadherin expression as distance increases and, presumably, the concentration of paracrine signals secreted from the HGF-stimulated spots decreases. Similarly, Fig. S4 (ESI†) shows dual E-cadherin/albumin and N-cadherin/albumin immunostaining in the presence of TGF-β1 blockers. In this case, the effects of TGF-β1 are mitigated and both cadherin and albumin expression are dominated by the printed HGF. Unlike in the case with no blockers where there are increased mesenchymal phenotype characteristics on HGF spots, the epithelial phenotype on HGF spots is favored in the presence of TGF-β1 blockers. This experiment helps prove that TGF-β1 is primarily responsible for the changes in cadherin and albumin expression on HGF spots at closer spot-to-spot distances.
Overall, we demonstrate that hepatic phenotype may depend on both the types of GF signals being delivered and on the distance between cell clusters receiving divergent GF signal. We also demonstrate that signaling through HGF receptor c-met is central to both changes in cellular morphology and communication between the cell clusters. While this remains to be proven experimentally, we hypothesize that hepatocytes atop HGF-containing protein spots may be stimulated to secrete more HGF or other anti-fibrotic molecules and that these secreted molecules diffuses across to rescue epithelial phenotype in hepatocytes atop TGF-β1 spots. As the inter-spot distance increases the rescue effects of HGF diminish and mesenchymal phenotype promoted by TGF-β1 signaling becomes more pronounced.
Our findings on distance dependence of hepatocellular phenotype are consistent with reports of Bhatia and co-workers who pointed to the presence of diffusible signals effective in stimulating hepatic phenotype at distances of up to 1 mm in stimulating hepatic phenotype.27,39
Conclusions
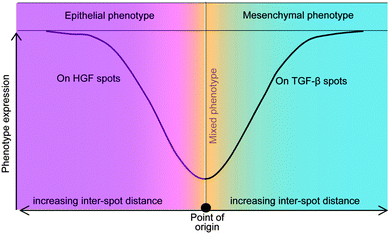
The present study investigated the phenotype of primary rat hepatocytes cultured on printed protein spots containing HGF and TGF-β1 molecules. Cultivation of cells on HGF spots resulted in high levels of hepatic phenotype expression whereas hepatic cultures on TGF-β1 and mixed HGF–TGF spots showed lower levels of liver marker expression. Subsequent characterization revealed that printed TGF-β1 induced hepatocytes to exhibit mesenchymal characteristics, with some cells adopting fibroblast-like morphology, with decreased membrane-bound E-cadherin and increased N-cadherin. Additional set of experiments demonstrated that phenotype of hepatocytes cultured on arrays containing alternating spots of HGF and TGF-β1 spots was dependent on spot to spot distance. When the center to center distance exceeded 1.25 mm, hepatocytes on HGF spots showed high levels of albumin and E-cadherin expression whereas hepatocytes on neighboring TGF-β1 spots exhibited lower levels of these liver markers. This experiment is particularly interesting as it suggests that phenotype expression of cells bathed in the same culture medium may be guided by patterning GFs on culture surfaces. These observations are summarized in a diagram of Fig. 7, with mixed phenotype of hepatocytes (both epithelial and mesenchymal markers expressed) at shorter distances and divergence of phenotypes at longer distances between the spots. The platform described in this paper may be used in the future for further understanding the underlying mechanisms involved in EMT of the liver. There is also potential for surfaces patterned with growth factors to be used in tissue engineering where divergent cell populations are required to recapitulate a tissue or organ of interest.Acknowledgements
The authors would like to acknowledge Prof. Soichiro Yamada and Dr Wentig Shih for assistance with cadherin staining. Financial support for this project was provided by NIH (DK073901 and AA017939-01).References
- D. E. Discher, D. J. Mooney and P. W. Zandstra, Science, 2009, 324, 1673–1677 CrossRef CAS PubMed.
- M. Peifer and P. Polakis, Science, 2000, 287, 1606–1609 CrossRef CAS.
- C. M. Nelson and M. J. Bissell, Annu. Rev. Cell Dev. Biol., 2006, 22, 287–309 CrossRef CAS PubMed.
- M. P. Lutolf and J. A. Hubbell, Nat. Biotechnol., 2005, 23, 47–55 CrossRef CAS PubMed.
- K. Lee, E. A. Silva and D. J. Mooney, J. R. Soc. Interface, 2011, 8, 153–170 CrossRef CAS PubMed.
- R. Saxena and N. Theise, Semin. Liver Dis., 2004, 24, 43–48 CrossRef PubMed.
- M. Tanaka, T. Itoh, N. Tanimizu and A. Miyajima, J. Biochem., 2011, 149, 231–239 CrossRef CAS PubMed.
- J. K. Sicklick, S. S. Choi, M. Bustamante, S. J. McCall, E. H. Perez, J. Huang, Y. X. Li, M. Rojkind and A. M. Diehl, Am. J. Physiol.: Gastrointest. Liver Physiol., 2006, 291, G575G–583 CrossRef PubMed.
- R. Bataller and D. A. Brenner, J. Clin. Invest., 2005, 115, 209–218 CAS.
- T. Kisseleva and D. A. Brenner, J. Gastroenterol. Hepatol., 2007, 22(1), S73–S78 CrossRef CAS PubMed.
- A. Kaimori, J. Potter, J. Y. Kaimori, C. Wang, E. Mezey and A. Koteish, J. Biol. Chem., 2007, 282, 22089–22101 CrossRef CAS PubMed.
- N. M. Meindl-Beinker and S. Dooley, J. Gastroenterol. Hepatol., 2008, 23, S122–S127 CrossRef CAS PubMed.
- W. R. Bi, C. Q. Yang and Q. Shi, Hepato-Gastroenterology, 2012, 59, 1960–1963 CAS.
- D. P. Jiang, Z. T. Jiang, F. Y. Han, Y. B. Zhang and Z. Z. Li, Eur. J. Appl. Physiol., 2008, 103, 489–493 CrossRef CAS PubMed.
- G. H. Xiao, M. Jeffers, A. Bellacosa, Y. Mitsuuchi, G. F. Vande Woude and J. R. Testa, Proc. Natl. Acad. Sci. U. S. A., 2001, 98, 247–252 CrossRef CAS.
- M. Nishino, Y. Iimuro, T. Ueki, T. Hirano and J. Fujimoto, Surgery, 2008, 144, 374–384 CrossRef PubMed.
- C. Schmidt, F. Bladt, S. Goedecke, V. Brinkmann, W. Zschiesche, M. Sharpe, E. Gherardi and C. Birchmeier, Nature, 1995, 373, 699–702 CrossRef CAS PubMed.
- B. C. Narmada, S. M. Chia, L. Tucker-Kellogg and H. Yu, J. Cell Physiol., 2013, 228, 393–401 CrossRef CAS PubMed.
- R. Pagan, I. Martin, M. Llobera and S. Vilaro, Hepatology, 1997, 25, 598–606 CrossRef CAS PubMed.
- R. Pagan, A. Sanchez, I. Martin, M. Llobera, I. Fabregat and S. Vilaro, J. Hepatol., 1999, 31, 895–904 CrossRef CAS.
- R. G. Wylie, S. Ahsan, Y. Aizawa, K. L. Maxwell, C. M. Morshead and M. S. Shoichet, Nat. Mater., 2011, 10, 799–806 CrossRef CAS PubMed.
- B. K. Mann, R. H. Schmedlen and J. L. West, Biomaterials, 2001, 22, 439–444 CrossRef CAS.
- M. Kim, J. Y. Lee, C. N. Jones, A. Revzin and G. Tae, Biomaterials, 2010, 31, 3596–3603 CrossRef CAS PubMed.
- M. Thery, J. Cell Sci., 2010, 123, 4201–4213 CrossRef CAS PubMed.
- A. Revzin, P. Rajagopalan, A. W. Tilles, F. O. Berthiaume, M. L. Yarmush and M. Toner, Langmuir, 2004, 20, 2999–3005 CrossRef CAS.
- J. Y. Lee, N. Tuleuova, C. N. Jones, E. Ramanculov, M. A. Zern and A. Revzin, Integr. Biol., 2009, 1, 460–468 RSC.
- E. E. Hui and S. N. Bhatia, Proc. Natl. Acad. Sci. U. S. A., 2007, 104, 5722–5726 CrossRef CAS PubMed.
- B. G. Chung, L. A. Flanagan, S. W. Rhee, P. H. Schwartz, A. P. Lee, E. S. Monuki and N. L. Jeon, Lab Chip, 2005, 5, 401–406 RSC.
- J. A. Hubbell, Nat. Mater., 2008, 7, 609–610 CrossRef CAS PubMed.
- L. Przybyla and J. Voldman, Annu. Rev. Anal. Chem., 2012, 5, 293–315 CrossRef CAS PubMed.
- C. N. Jones, N. Tuleuova, J. Y. Lee, E. Ramanculov, A. H. Reddi, M. A. Zern and A. Revzin, Biomaterials, 2009, 30, 3733–3741 CrossRef CAS PubMed.
- C. N. Jones, N. Tuleuova, J. Y. Lee, E. Ramanculov, A. H. Reddi, M. A. Zern and A. Revzin, Biomaterials, 2010, 31, 5936–5944 CrossRef CAS PubMed.
- N. Tuleuova, J. Y. Lee, J. Lee, E. Ramanculov, M. A. Zern and A. Revzin, Biomaterials, 2010, 31, 9221–9231 CrossRef CAS PubMed.
- M. Ghaedi, N. Tuleuova, M. A. Zern, J. Wu and A. Revzin, Biochem. Biophys. Res. Commun., 2011, 407, 295–300 CrossRef CAS PubMed.
- M. Ghaedi, Y. Duan, M. A. Zern and A. Revzin, J. Tissue Eng. Regen. Med., 2012 DOI:10.1002/term.1595.
- J. C. Y. Dunn, M. L. Yarmush, H. G. Koebe and R. G. Tompkins, FASEB J., 1989, 3, 174–179 CAS.
- K. Gravdal, O. J. Halvorsen, S. A. Haukaas and L. A. Akslen, Clin. Cancer Res., 2007, 13, 7003–7011 CrossRef CAS PubMed.
- K. Vuoriluoto, H. Haugen, S. Kiviluoto, J. P. Mpindi, J. Nevo, C. Gjerdrum, C. Tiron, J. B. Lorens and J. Ivaska, Oncogene, 2011, 30, 1436–1448 CrossRef CAS PubMed.
- S. March, E. E. Hui, G. H. Underhill, S. Khetani and S. N. Bhatia, Hepatology, 2009, 50, 920–928 CrossRef CAS PubMed.
Footnotes |
| † Electronic supplementary information (ESI) available. See DOI: 10.1039/c3ib40140e |
| ‡ Equally contributing authors. |
| This journal is © The Royal Society of Chemistry 2014 |

