A mesocosm study of the effects of wet–dry cycles on nutrient release from constructed wetlands in agricultural landscapes
Allyson S.
Smith
and
Pierre-Andre
Jacinthe
*
Department of Earth Sciences, Indiana University Purdue University Indianapolis (IUPUI), 723 W. Michigan Street, SL 118H, Indianapolis, IN 46202, USA. E-mail: pjacinth@iupui.edu; Fax: +1 317 274 7966; Tel: +1 317 274-7969
First published on 18th November 2013
Abstract
Given the projection that wet–dry periods will be more frequent in the US Midwest, a study was conducted to understand the impact of these hydro-climatic alterations on nutrient dynamics in wetlands constructed on former croplands in the region. Soil cores were collected from two constructed wetlands and a wooded riparian area (surface: 0–20 cm; subsurface: 40–60 cm) downslope from an agricultural field. Cores were either kept moist or subjected to a 5-week drying treatment, after which all cores were flooded for 36 days. Initial nitrate flux was significantly (p < 0.001) higher in the dry than in the moist treatment (44.5 vs. 1.9 mg N m−2 per day), likely due to mineralization of organic matter. The NO3− released was rapidly denitrified (N2O flux: 18.9 mg N m−2 per day), except in the subsurface soil cores in which processing of available N (N2O flux: 0.33 mg N m−2 per day) was limited by low microbial activity (4 times lower CO2 production rate). The dry treatment also resulted in significantly (p < 0.01) higher inorganic P (Pi) flux (3.1 versus 1 mg P m−2 per day in moist cores), with water-extractable soil P being the best predictor (r2: 0.93, p < 0.03) of that flux. Despite a decline in redox potential (as low as −36.4 mv) and progressive increase in pore-water dissolved Fe, no relationship between floodwater Pi and dissolved Fe was observed, suggesting either limited contribution of reductive dissolution to Pi dynamics or rapid adsorption of the Pi released within the cores. Compared to the moist cores, geochemical modeling showed a consistent shift toward greater solubility of the calcium-phosphate minerals controlling pore-water Pi concentration in the dry treatment cores. These results suggest that dissolution of Ca–phosphate minerals could be a key factor controlling Pi mobility in constructed wetlands subjected to wet–dry cycles.
Environmental impactConstructed wetlands can help reduce nutrients export from intensively-managed and tile-drained croplands of the US Midwest. Several climate models suggest that the region's climate will be marked by frequent droughts followed by periods of excessive rainfall. Here, we presented data to show that, under these circumstances, increased solubility of calcium–phosphate minerals could accelerate inorganic P export from the region's agricultural wetlands. |
Introduction
Intensive agriculture in the US Midwest has resulted in soil nutrient enrichment, and has been linked to various water quality and ecosystem health problems in the Mississippi River basin.1 Export of nitrogen (N) and phosphorus (P) from the region's cropland has been blamed for the eutrophication of surface waters, the proliferation of nuisance algae, and the expanding hypoxic zone in the Gulf of Mexico.2 The interception of agricultural runoff and tile-drainage discharge in treatment wetlands, strategically located downslope of cultivated fields, could help reduce nutrient export and mitigate these water quality challenges.The nutrient retention capacity of treatment wetlands is related to several factors, including antecedent land-use, physico-chemical properties of soils and hydrology.3 As a result of several decades of fertilizer application and/or pasturing, the surface layers of agricultural lands can become nutrient-enriched, especially with regard to P due to the low mobility of this element and its propensity to accumulate in the topsoil.4 Therefore, treatment wetlands built on P-enriched agricultural lands may not have an immediate positive impact on water quality and, in fact, may represent a source of P during the initial period of operation. However, if the topsoil layer is removed prior to wetland establishment, greater rates of P removal can be achieved due to exposure of subsurface soil minerals, especially Fe/Al-oxides which are known to be effective P sorption sites.5,6 This possibility is well illustrated by the data of Liikanen et al.7 who reported increased P removal in a constructed wetland in which the topsoil layer was removed prior to construction.
While numerous laboratory and field studies6–8 have examined the effect of hydrology on constructed wetlands performance, there have been few attempts to understand the significance of wet–dry cycles on nutrient cycling in wetlands. This aspect of wetland hydrology is particularly relevant for US Midwest wetlands considering the projection by several models that the region's climate will be characterized by frequent periods of drought interspaced with short periods of excessive rainfall.9,10 At the present, it is unclear how wetlands in the Midwest would withstand this intensification in wet–dry cycles. In a laboratory experiment involving flooding of wetland soil cores originally maintained under different moisture regimes (saturated, moist and dry), Aldous et al.11 observed the largest release of inorganic P (Pi) from the dry treatment cores, and more so with cores from restored than from natural wetlands. These results were attributed to the reduction of Fe3+ to Fe2+ and the release of P originally bound to Fe-minerals as the redox potential of the flooded soil declined. The mineralization of organic P during the dry treatment could be an additional factor,11 but information on dissolved organic P (DOP) and phosphatase activity was not provided. Similarly, in a laboratory study to simulate water table drawdown and flooding in wetlands, Corstanje and Reddy12 observed substantial increase in floodwater NO3− and Pi upon flooding of wetland cores. Their results11 also showed a marked effect of wetland nutrient status, with cores taken from nutrient-enriched locations releasing significantly more N and P compared to cores from undisturbed sites. While informative, it should be noted that these and other similar studies6,13 were conducted with soils rich in organic matter (>20% C), not typical of wetlands constructed on Midwestern croplands (2–3% C). Due to differences in soil organic matter content and mineralogical properties, it is possible that the results of these past investigations may not reflect the response of US Midwest wetlands to wet–dry cycles. Therefore, the objectives of this study were to: (1) examine the influence of dry–wet cycles on N and P release from agricultural wetlands of varying soil properties, and (2) investigate the biological and chemical processes controlling N and P dynamics in wetlands subjected to drying and wet periods.
Materials and methods
Site description
Intact soil cores and composite soil samples were collected in May 2010 from two constructed agricultural wetlands and from a wooded riparian area slated for the construction of a wetland downslope from an actively-managed agricultural field. One wetland (W-1; area = 3 ha) located in Van Wert County, Northwest Ohio (40°53′ N, 84°45′ W), was constructed in 2002. The second wetland (W-2; area = 0.51 ha), established in 2006, was located at the Northeast Indiana Purdue Agricultural Center (NEPAC) in Whitley County, Indiana (41°5′ N, 85°26′ W). The riparian area was adjacent to Schoolbranch Creek in Hendricks County, Central Indiana (39°53′ N, 86°21′ W). At all sites, soils were poorly drained silty-clay loam developed from Wisconsinan glacial till underlain by dolomite and limestone bedrock.14At each of the constructed wetlands, six soil cores (0–20 cm depth) were collected from three randomly selected sampling areas in order to capture natural site spatial variability. At the riparian area near Schoolbranch Creek, six surface (0–20 cm) and six subsurface (40–60 cm) cores were extracted. Since an agricultural wetland was to be constructed in that riparian buffer, the purpose of obtaining both surface and subsurface cores was to assess the potential effect of antecedent soil conditions and topsoil removal on initial nutrient dynamics once a wetland is established. Hereafter, the Schoolbranch cores will be referred to as SB-a (surface, 0–20 cm) and SB-b (subsurface, 40–60 cm), and will be considered as separate sampling sites.
Soil cores were encased in PVC pipes (L: 40 cm, diam.: 20 cm) that were driven into the soil to a depth of 20 cm, thus leaving 20 cm of headspace. Composite soil samples were collected to assess soil properties. Cores were transported to the laboratory, covered with parafilm to minimize moisture loss and stored at 4 °C in a walk-in cooler until used.
Background soil properties and P fractionation
Soil pH was measured with a pH-meter using a soil suspension (1![[thin space (1/6-em)]](https://www.rsc.org/images/entities/char_2009.gif) :2 soil to water). Finely-ground soil (150 μm) was analyzed for total C and N (dry combustion at 950 °C). Total soil P was determined by the ashing (550 °C, 1 h) and acid extraction (1 N HCl) procedure as described by Andersen.15
:2 soil to water). Finely-ground soil (150 μm) was analyzed for total C and N (dry combustion at 950 °C). Total soil P was determined by the ashing (550 °C, 1 h) and acid extraction (1 N HCl) procedure as described by Andersen.15
The Hedley procedure16 was used to determine various P pools based on their relative solubility in water, alkaline and acidic solutions. Using 0.5 g field moist soil sample, each fraction was sequentially extracted using 30 mL of the appropriate reagent (contact time of 16 h and filtration). The following P fractions were obtained: water extractable inorganic P (WEP), moderately labile Pi extracted with 0.5 M NaHCO3, Fe/Al-bound Pi extracted with 0.1 M NaOH, and Ca/Mg-bound Pi extracted with 1 M HCl.
Experimental setup and pre-flood treatments
The experiment comprised 2 phases: drying and flooding. During the first phase, half of the cores (3 from each site for a total of 12 cores) were allowed to dry under ambient condition in a greenhouse for a period of 5 weeks (dry treatment) whereas the remaining 12 cores were kept in a walk-in cooler (moist treatment). The weight of all the moist cores was monitored and soil moisture was adjusted as needed. One day before the start of the flooding phase, the moist treatment cores were transferred to the greenhouse for acclimation (25 °C).During the flooding phase, all cores (dry and moist) were flooded to a depth of 6 cm above the soil surface with stream water collected adjacent to site W-1. Stream water was transported to the laboratory in LDPE plastic containers, filtered, and stored frozen (−2 °C) until used. Stream water chemical composition is provided in figure captions. Cores were covered with parafilm to reduce evaporative water loss while allowing gas exchange. Water chemistry in the flooded cores was measured on days 2, 5 and approximately every 7 days thereafter, for a total of 6 sampling occasions. From these measurements, nutrient fluxes were estimated. Floodwater pH and ORP were measured in situ using pH and ORP probes (Fisher Scientific, model 300731.1 and 300746.0, respectively) connected to pH-meter. Floodwater samples were withdrawn with a syringe, filtered (0.45 μm GF filter) and stored frozen if not analyzed the same day.
The rate of inorganic P and NO3− release was computed as the difference between concentration in the floodwater above a core (Ct) and initial concentration (Ci) in the stream water used to flood the core at the beginning of the flooding phase. Nutrient flux (F) was expressed in mg m−2 per day and computed as:
To obtain pore-water samples, each core was fitted with a sampling port drilled through the PVC casing (5 cm from bottom of core). A piece of FEP-lined plastic tubing (1.5 mm diam) was horizontally inserted through the soil. The tubing was perforated along its length, covered with nylon membrane (20 μm) to minimize clogging, and plugged at the outer end with a two-way stopcock. Waterproof adhesive was used to secure the sampling port assembly on the side of the PVC casing. Pore-water samples were extracted using a syringe attached to an evacuated glass vial. Once the desired water volume was obtained, an ORP probe was then quickly screwed to the glass vial to avoid air exchange. That was followed by measurement of pH, and filtration of pore-water samples (0.45 μm GF filter). Due to clogging of the sampling ports, however, pore-water sampling began on day 19 (half way through the flooding phase). Therefore, all discussion pertaining to pore-water chemistry refers to roughly the second half of the flooding experiment.
Carbon dioxide and N2O fluxes were also measured. To measure gas flux, core headspace was closed with a PVC plug (Cherne Industries, Minneapolis, MN) fitted with a sampling port made of butyl rubber septum. Once closed, air samples were taken from the headspace at 30 min intervals using a syringe and transferred into evacuated glass vials. Gas flux was calculated from the rate of gas concentration change in the headspace integrated over the surface area of soil cores.
Analytical techniques
Water samples were analyzed for Pi, DOP, phosphatase activity, NO3−, NH4+, DOC, and dissolved cations (Na+, K+, Ca2+, Mg2+, Fe). Inorganic P was determined using the molybdate colorimetric method.17 A persulfate digestion procedure18 was used to determine total P (TP), and dissolved organic P (DOP) was calculated as the difference between TP and Pi. Phosphatase enzyme activity in floodwater samples was measured using methylumbelliferyl phosphate (MUB-P) as substrate.19 Fluorescence was measured on a Cary Eclipse fluorescence reader (Varian, CA) with emission and excitation wavelengths set at 447 nm and 360 nm, respectively. The rate of MUB production was taken as a measure of phosphatase activity. Samples were analyzed for NO3− and NH4+ using EPA methods 350.1 and 375.4 on an Aquachem 20 photometric analyzer (EST Analytical, Fairfield, OH). Dissolved cations were analyzed using inductively coupled plasma atomic emission spectrometry (Leeman Labs, Hudson, NH). DOC was measured using a Vario TOC Cube analyzer (Elementar Inc., NJ). Air samples were analyzed for CO2 and N2O on a Varian CP 3800 gas chromatograph.Data analysis
Data were analyzed using analysis of variance (ANOVA) to assess the effect experimental variables on nutrient dynamics. Using ANOVA, the class variables were pre-flood treatments (moist versus dry) and sampling sites (SB-a, SB-b, W-1, and W-2). When a significant treatment effect was detected on a sampling date, separation of treatment means was done using t-test. One way ANOVA and Kruskal Wallis ANOVA on ranks were used to determine difference in background soil properties. Unless otherwise noted, statistical significance was determined at p < 0.05.Results
General properties of soils and P fractions
Soil pH at the study sites was circum-neutral (6 to 6.9, Table 1). Among the sampling sites, W-2 had the highest total C and C/N ratio whereas SB-b had the lowest levels for most bulk soil properties. Total P content ranged from 352 to 611 mg P kg−1 soil, but no significant difference among sites was found (Table 1). Nonetheless, the sites differed in terms of the distribution of P among the various pools as determined by the Hedley fractionation procedure. The water-extractable P (WEP, 16 h water extraction) was significantly higher (∼2% of TP) at SB-a compared to the other sites (Table 1). Conversely, the SB-a site had a lower proportion of TP in the NaOH- and HCl-extractable P fractions (43% compared to 81% at W-2).| Properties | Study sites | |||
|---|---|---|---|---|
| SB-a | SB-b | W-1 | W-2 | |
| pH | 6.9 ± 0.02 | 6.9 ± 0.02 | 6 ± 0.01 | 6.5 ± 0.02 |
| Soil organic C (g C kg−1) | 21.7 ± 0.8b | 12.4 ± 0.1c | 16.5 ± 0.9b | 27 ± 1.3a |
| Total N (g N kg−1) | 2 ± 0.2a | 1.2 ± 0.1b | 1.4 ± 0.1b | 1.8 ± 0.3a |
| Total P (mg P kg−1 soil) | 611 ± 111 | 352 ± 115 | 550 ± 169 | 489 ± 231 |
| Water extractable P (WEP) | 11 ± 0.9a | 4.8 ± 1.1b | 4.3 ± 0.9b | 5.3 ± 0.2b |
| NaHCO3 extractable P | 23.2 ± 5.2b | 13 ± 4.1b | 33.7 ± 6.6b | 74.6 ± 17.7a |
| NaOH extractable P (Fe/Al bound) | 165.1 ± 13.3bc | 115.2 ± 9.8c | 202.2 ± 13.6b | 288 ± 45.3a |
| HCl extractable P (Ca/Mg bound) | 96.9 ± 4b | 126 ± 21.2ab | 172.9 ± 40.5a | 109.7 ± 42ab |
Nutrients and cations concentration in floodwater
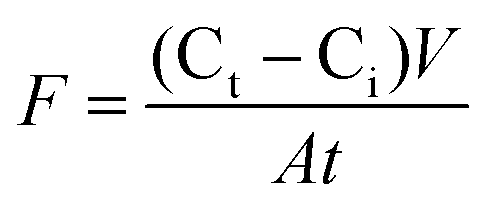
A significant effect of treatment was observed on floodwater concentration of NO3− (p < 0.001) and Pi (p < 0.01) during the first portion of the experiment (days 0–15). During the first week of the experiment, floodwater NO3− was significantly higher in the dry than in the moist treatment cores (Fig. 1). This initial NO3− pulse only lasted for a few days, however. In the dry W-1 and W-2 cores, NO3− rapidly decreased from 3.8 (W-1) and 2.2 (W-2) mg N L−1 to < 0.2 mg N L−1 in less than 5 days (Fig. 1). In contrast to the rapid decline in cores from the established wetland sites, the drop in floodwater NO3− was more moderate in the SB cores (from riparian area) in which the initial NO3− spike (10.8 mg N L−1 in SB-a, 2.7 mg N L−1 in SB-b) dissipated over a 3–4 week period before returning to background (Fig. 1). After day 29, there was no significant difference between treatments with respect to floodwater NO3− concentration. Patterns in floodwater NH4+ concentrations were not as discernible as those observed with NO3−. Aside from an early increase (+0.11 mg L−1 above stream water) in the SB-a cores, no clear temporal trend was detected. Therefore, NH4+ data are not reported.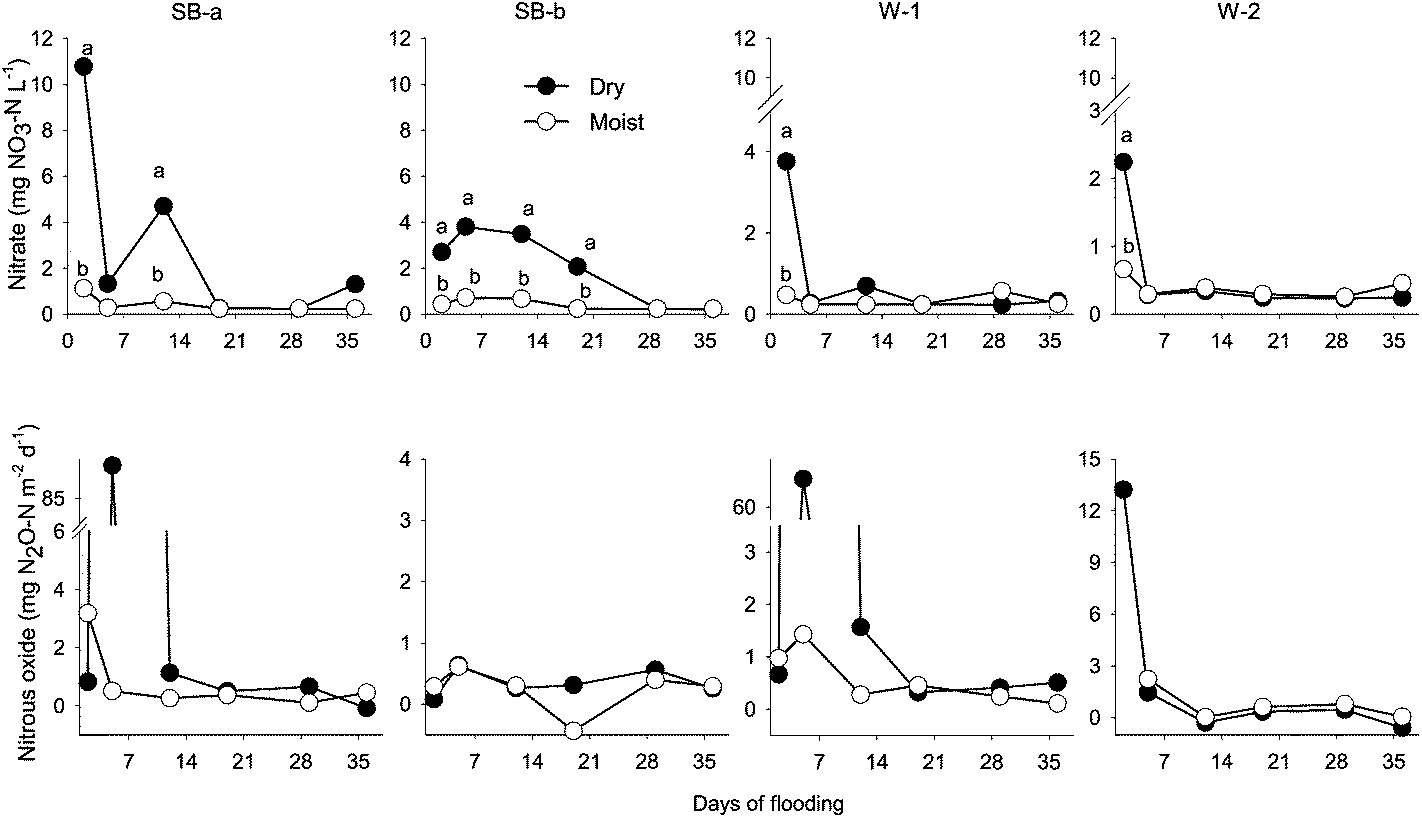 | ||
| Fig. 1 Nitrate concentration in floodwater and nitrous oxide flux during the flood experiment. The average concentration of mineral N in the stream water used to flood the cores was 0.53 mg N L−1. For a given sampling date, data points are labeled with different letters to indicate a significant difference (p < 0.05) between the moist and dry treatments. Abbreviations: SB-a = Schoolbranch (0–20 cm); SB-b = Schoolbranch (40–60 cm); W-1 = Van Wert county wetland; W-2 = Whitley county wetland. | ||
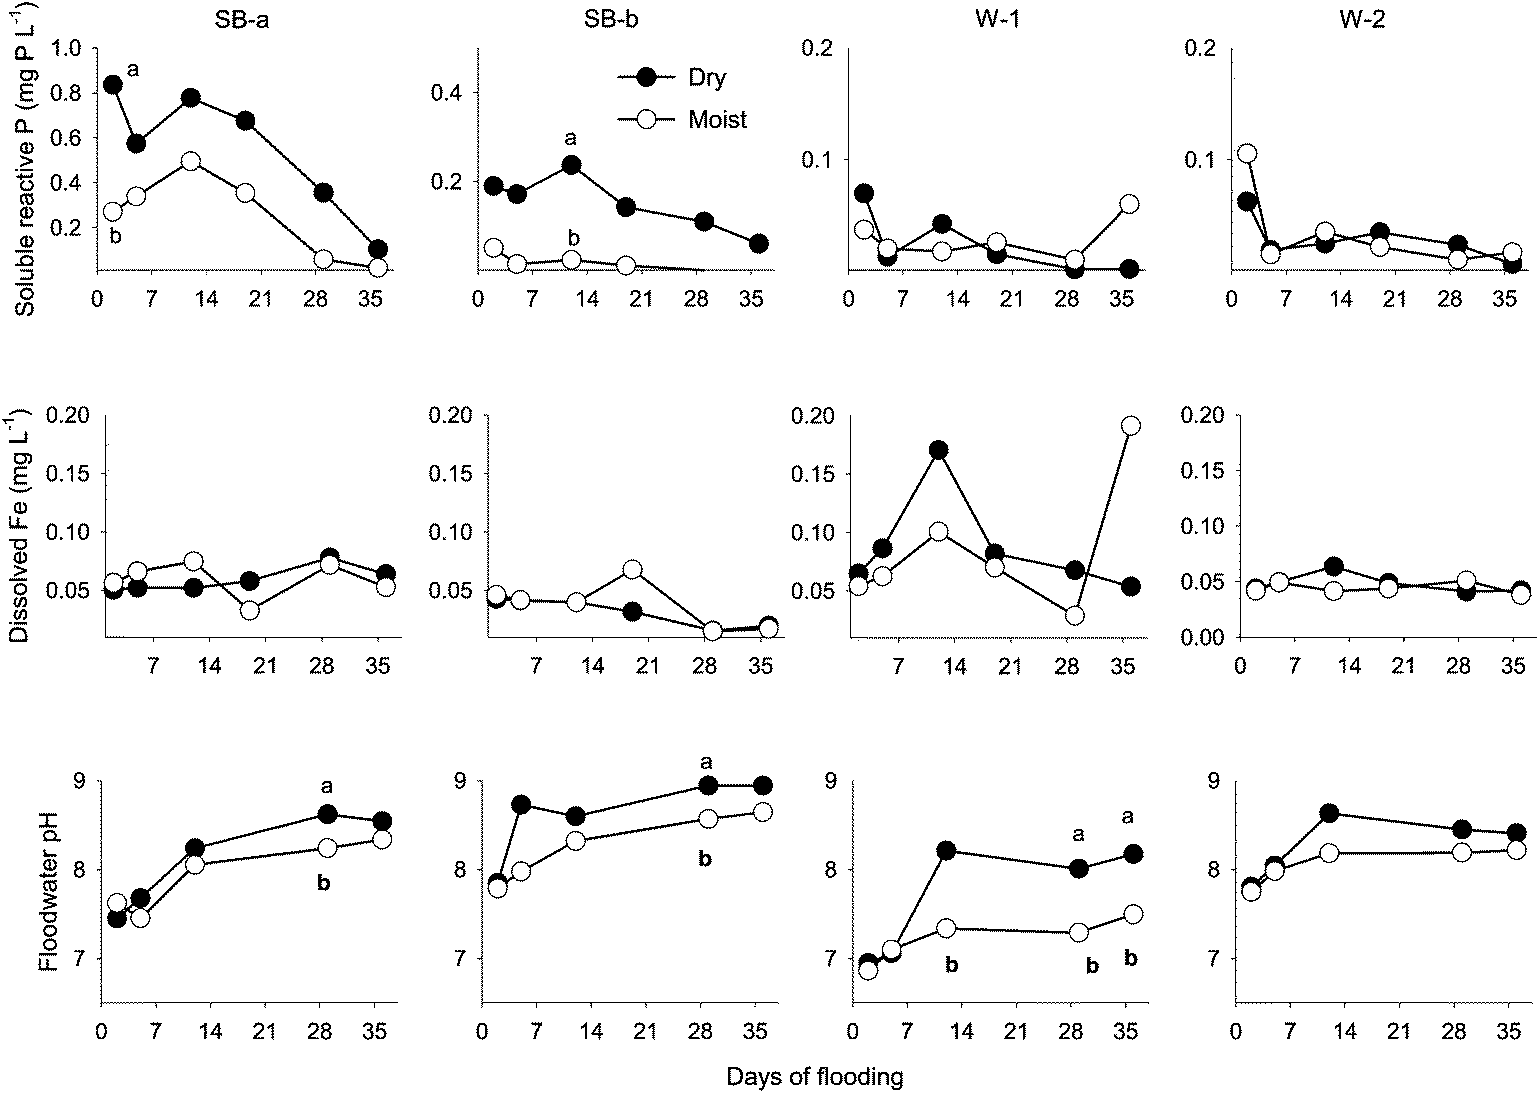
Floodwater Pi concentration was generally higher in the dry than in the moist treatment for SB-a and SB-b cores but, for most sampling dates, the difference was not statistically significant (Fig. 2). In the dry treatment cores, Pi gradually decreased (from 0.84 in SB-a and 0.19 mg P L−1 in SB-b) to <0.10 mg P L−1 around day 36 (Fig. 2). Cores from the established wetland sites (W-1, W-2) released the lowest amount of Pi and no effect of treatment was detected (Fig. 2). In the dry treatment cores, a strong relationship (r2: 0.93, p < 0.03) was found between initial Pi flux (y) and soil water-extractable P (x) (Tables 1 and 2). Across sites and treatments, the contribution of DOP (Fig. 2 and 3) to total dissolved P grew with flooding duration, from 53% on day 2 to 92 % on day 36.
 | ||
| Fig. 2 Soluble reactive P (SRP), pH and dissolved iron concentration in floodwater during the experiment. Chemical composition (mg L−1) of the stream water used to flood the cores: SRP = 0.03; Fe = 0.18. For a given sampling date, data points are labeled with different letters to indicate a significant difference (p < 0.05) between the moist and dry treatments. Abbreviations: SB-a = Schoolbranch (0–20 cm); SB-b = Schoolbranch (40–60 cm); W-1 = Van Wert county wetland; W-2 = Whitley county wetland. | ||
| Pre-flood treatment | Site | NO3− flux (mg N m−2 per day) | SRP flux (mg P m−2 per day) | N2O flux (mg N2O–N m−2 per day) | CO2 flux (g CO2–C m−2 per day) | ||
|---|---|---|---|---|---|---|---|
| Day 0–15 | Day 0–15 | Day 0–15 | Day 25–36 | Day 0–15 | Day 25–36 | ||
| Dry | SB-a | 99 ± 57 | 9.48 ± 1.42 | 29.8 ± 5 | 0.36 ± 0.39 | 0.31 ± 0.12 | 0.28 ± 0.21 |
| SB-b | 33.4 ± 19.6 | 2.22 ± 1.85 | 0.33 ± 0.28 | 0.38 ± 0.16 | 0.12 ± 0.09 | 0.09 ± 0.14 | |
| W-1 | 29.8 ± 40.6 | 0.27 ± 0.48 | 22.3 ± 36.8 | 0.41 ± 0.09 | 0.89 ± 0.2 | 0.08 ± 0.11 | |
| W-2 | 15.7 ± 10.6 | 0.18 ± 0.46 | 4.8 ± 7.35 | 0.07 ± 0.57 | 0.27 ± 0.33 | 0.32 ± 0.14 | |
| Moist | SB-a | 5.7 ± 9.2 | 3.65 ± 3.15 | 1.32 ± 1.62 | 0.31 ± 0.18 | 0.19 ± 0.07 | 0.36 ± 0.12 |
| SB-b | 0.8 ± 0.3 | 0.05 ± 0.07 | 0.4 ± 0.18 | 0.09 ± 0.45 | 0.1 ± 0.07 | 0.12 ± 0.17 | |
| W-1 | −0.5 ± 2.4 | −0.05 ± 0.07 | 0.89 ± 0.58 | 0.27 ± 0.17 | 0.59 ± 0.28 | 0.19 ± 0.26 | |
| W-2 | 1.5 ± 5 | 0.59 ± 0.43 | 1.13 ± 1.56 | 0.49 ± 0.38 | 0.24 ± 0.06 | 0.3 ± 0.37 | |
 | ||
| Fig. 3 Dissolved organic carbon (DOC), dissolved organic phosphorus (DOP), and phosphatase activity during the flooding experiment. Chemical composition (mg L−1) of the stream water used to flood the cores: DOC = 16.6; DOP = 0.06. Abbreviations: SB-a = Schoolbranch (0–20 cm); SB-b = Schoolbranch (40–60 cm); W-1 = Van Wert county wetland; W-2 = Whitley county wetland. | ||
In the first 2 weeks of flooding, floodwater DOC concentration was greater (but not significantly different) in the dry than in the moist treatment cores (Fig. 3). With the exception of the subsurface cores (SB-b), DOC concentrations generally increased as the experiment progressed regardless of treatment (Fig. 3). This rise in DOC concentration was accompanied with increases in floodwater pH, as well as Ca2+ and Mg2+ concentration in the SB-a cores (Fig. 2–4). Significant relationships were found between the concentration of DOC and divalent cations in the floodwater (Ca2+: r2 = 0.63, p < 0.001; Mg2+: r2 = 0.65, p < 0.001). Phosphatase activity in the floodwater ranged between 226 and 662 μg MUB L−1 h−1 (Fig. 3). Although the effect of treatment was limited, phosphatase activity was generally higher (but not always significantly different) in the moist cores. A moderate increase in phosphatase activity was also noted after the third week of flooding (Fig. 3). Consequently, a positive relationship was found between phosphatase activity and the concentration of DOP (r2: 0.21, p < 0.12) and DOC (r2: 0.40, p < 0.03) in the moist soil cores.
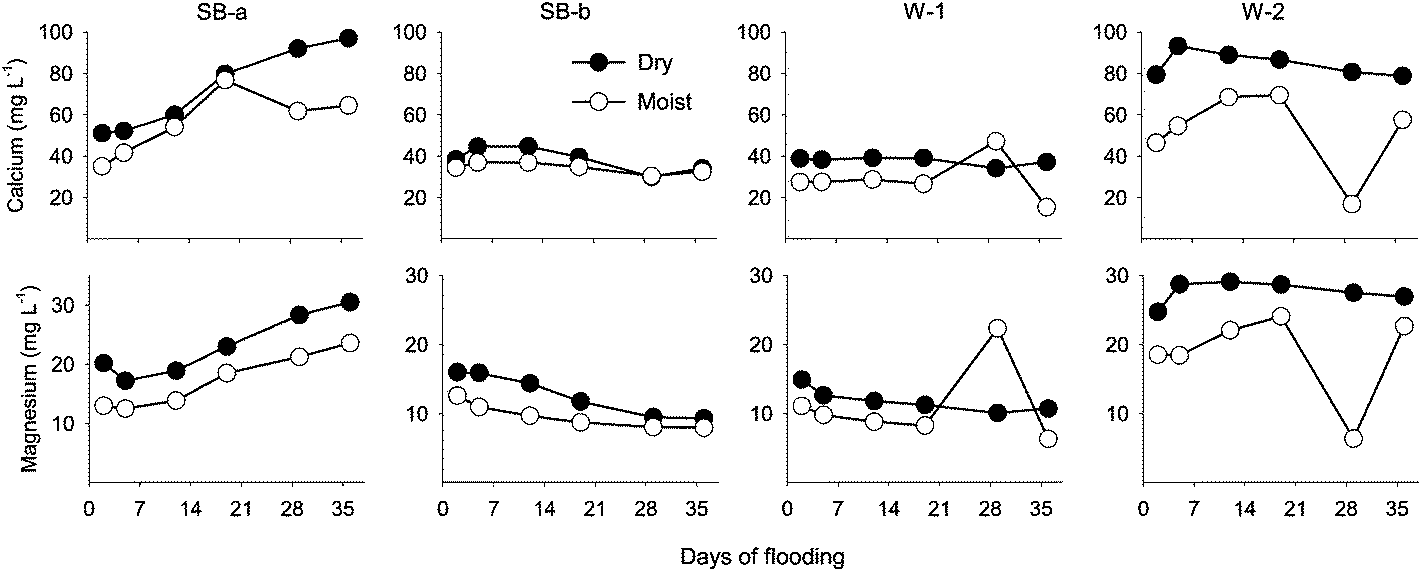 | ||
| Fig. 4 Dissolved Ca2+ and Mg2+ concentration in floodwater during the flooding experiment. Chemical composition (mg L−1) of the stream water used to flood the cores: Ca2+ = 12.7; Mg2+ = 18.9. Abbreviations: SB-a = Schoolbranch (0–20 cm); SB-b = Schoolbranch (40–60 cm); W-1 = Van Wert county wetland; W-2 = Whitley county wetland. | ||
Nutrient and greenhouse gas (GHG) fluxes
Since most of the N and P release occurred during the initial 2 weeks of flooding, nutrient and GHG fluxes were calculated for that period (day 0–15) and for the period after day 25. ANOVA showed a significant effect of site (p < 0.05) and treatment (p < 0.01) on NO3− fluxes. Regardless of site, initial NO3− fluxes were higher (30-fold on average) in the dry compared to the moist treatment (Table 2). Among the dry treatment cores, the highest NO3− fluxes (mg N m−2 per day) were measured in the SB-a (mean: 99), followed by the SB-b (33), W-1 (30), and W-2 (16) cores. Overall, the moist treatment cores produced significantly less NO3−, with flux ranging between −0.5 and 5.7 mg N m−2 per day (Table 2).With the exception of the subsurface (SB-b) cores, the dry treatment resulted in significantly (p < 0.05) higher N2O fluxes during the first week of the experiment (Fig. 1 and Table 2). These initial N2O fluxes (up to 87 mg N2O-N m−2 per day) were particularly strong in the SB-a and W-1 cores (dry treatment). In contrast, the maximum flux in the moist cores (2.2 mg N2O-N m−2 per days−1) was almost 40 times lower. The initial burst in N2O production was short-lived and was followed by a steep decline in emission rate by day 5, dropping to around 0.5 mg N2O-N m−2 per day for the remainder of the experiment (Fig. 1). In accord with the similarity of the temporal pattern exhibited by these variables, a strong correlation (r2 = 0.78, p < 0.01) was found between initial NO3− flux and N2O emission during the first 2 weeks of the experiment. Carbon dioxide emission was not significantly different among treatments throughout the duration of the experiment. In general, during the first 2 weeks of the experiment, the W-1 dry cores had the highest CO2 flux while the SB-b cores had the lowest (Table 2).
Soluble reactive P fluxes ranged from −0.05 to 9.5 mg P m−2 per day (Table 2) and, in accord with the significant effect of site (p < 0.001), the highest rates of P release were recorded in the SB-a cores. The effect of treatment on P fluxes was markedly stronger in the SB cores (riparian buffer) compared to the cores from the established wetlands (W-1 and W-2; Table 2).
Dissolved Fe, electrochemical properties of floodwater and pore-water
Dissolved Fe concentrations in floodwater ranged between 0.015 and 0.19 mg L−1 (Fig. 2). Overall, significantly (p < 0.05) higher dissolved Fe concentration was measured in the W-1 cores compared to cores from the other sites, but there was no significant difference between treatments. Analysis of the data showed no effect of treatment on dissolved Fe. The data also suggested no clear link between the concentration of dissolved Fe in floodwater and that of the other dissolved species considered in the study. Most specifically, and contrary to the study hypothesis, no relationship was observed between Pi and Fe in the floodwater (Fig. 2).Throughout the experiment, floodwater pH steadily increased (Δ = + 0.8 pH unit) irrespective of treatments (Fig. 2). Floodwater ORP ranged between 150 and 240 mV, indicating sub-oxic conditions but, regardless of site or treatment, the temporal variation was weak (data not shown). In contrast, pore-water ORP steadily declined during the flooding experiment (Table 3). Averaged across sites, mean ORP dropped from +68 mV on day 19 to −34 mV on day 36 in the dry treatment cores. In the moist treatment cores, mean ORP varied from +132 to +48 mV during the same period (Table 3).
| Property | Pre-flood treatment | Sampling day | ||
|---|---|---|---|---|
| Day 19 | Day 29 | Day 36 | ||
| pH | Dry | 8.45 ± 0.39 | 8.51 ± 0.39 | 8.52 ± 0.32 |
| Moist | 8.02 ± 0.54 | 8.07 ± 0.55 | 8.17 ± 0.49 | |
| ORP, mV | Dry | 68.3 ± 50.7 | 83.5 ± 21.4 | −34.1 ± 35.3 |
| Moist | 132.3 ± 54.8 | 78.9 ± 87.8 | 47.8 ± 89.2 | |
| Dissolved Fe, mg L−1 | Dry | 0.22 ± 0.3 | 1.95 ± 3.19 | 4.25 ± 5.53 |
| Moist | 0.04 ± 0.02 | 0.37 ± 0.51 | 0.17 ± 0.14 | |
For most sampling days, floodwater cation concentrations were generally higher in the dry than in the moist treatment cores, although differences were not always significant (Fig. 4). There was a noticeable increase in dissolved Ca2+ and Mg2+ toward the end of the flooding experiment, and that increase coincided with a similar increase in floodwater DOC (except subsurface cores).
Discussion
Drying and N dynamics in wetland soils
During the drying phase, organic matter mineralization may have led to the conversion of organic N into NH4+via ammonification and then into NO3− by nitrification. This sequence would explain the vigorous flux of NO3− measured during the first days of the flooding experiment (Fig. 1). The drying treatment may have also contributed the death of soil microbes,20,21 contributing to the higher DOC in the dry than in the moist treatment cores observed during that period (Fig. 3).The combination of DOC (Fig. 3) and NO3− availability (Fig. 1) in the dry treatment cores provided optimal conditions for denitrification as evidenced by the high rates of N2O emission (except in subsurface cores) recorded during the initial weeks of flooding. The strong correlation (r2 = 0.78, p < 0.01) between NO3− concentration and N2O flux (Fig. 1) supports this interpretation and, in accord with the results of past studies,8,22 indicates that denitrification – the microbial reduction of NO3− into nitrous oxide (N2O) and dinitrogen (N2) – was an important N transformation pathway in the flooded soil core. The post-flood NO3− pulse in the dry treatment cores was short-lived, and consequently N2O fluxes significantly dropped later in the experiment despite a gradual increase in floodwater DOC (Fig. 3) toward the end of the experiment, suggesting that denitrification became limited by the availability of NO3− and not by organic C. Depletion of the NO3− pool and development of low redox conditions during the experiment may have led to reduction of N2O to N2 and the observed decrease in N2O fluxes. Previous studies12,20 have documented similar trends in microbial activity and NO3− consumption upon flooding of wetland soils subjected to drying treatments.
In flow-through wetland systems, drought-induced mineral N release and export to surface waters can negatively impact water quality. This outcome is most likely for newly-constructed wetlands in which denitrification capacity is not fully established. Data from the SB-b cores (sub-surface) could help illustrate this reasoning. Unlike the rapid decrease observed in the other cores, the decline in NO3− concentration in the subsurface cores (SB-b) was very gradual throughout the experiment (Fig. 1). In accord with reports of sharp decline of denitrification activity below the top 10–15 cm soil layer,23,24 these results suggest that topsoil removal during wetland construction may result in diminished N removal capacity in newly-installed wetlands due to the limited population of denitrifiers that subsurface soils generally harbor. The low rates of CO2 fluxes from SB-b cores are consistent with that interpretation (Table 2).
Soil P status and relationship with P release
The P fractionation results indicate a link (r2: 0.93, p < 0.03) between water extractable Pi (WEP) and Pi flux (Tables 1 and 2). These results demonstrate the ability of this P pool to easily pass into the aqueous phase, and also suggest that determination of this P fraction could provide a convenient way to predict potential P export from agricultural wetlands.Past studies12,25 investigating the effect of wet–dry cycles on P release from wetlands have suggested a direct linkage between P release and soil P level. In a simulation study involving south Florida peatlands, Corstanje and Reddy (2004)12 reported P fluxes averaging 48 mg P m−2 per day, and ascribed these elevated P fluxes to the high soil organic C (48% C) and total P (TP = 878 mg kg−1) in the studied peatlands. Bostic and White (2007)25 proposed a similar interpretation of their results. If extended to the present study, this line of reasoning would explain the lower rates of P release from the moist cores (Table 2) in comparison to the aforementioned studies12,25 since soil TP was much lower (352–611 mg P kg−1; Table 1) than in the South Florida peatlands.
When analyzing the results obtained with the dry treatment cores, however, the linkage between P release and total soil P did not hold. The dry treatment resulted not only in higher P release (0.3–42 times higher) than from moist cores, but P flux rate was independent of total soil P (Table 2). Under the dry treatment, for example, an appreciable amount of P was released from the SB-b cores even though the SB-b soil had the lowest TP (Table 1). These results highlighted the impact of wetland soil drying on P mobility, and the potential for significant P release from wetlands in response to these hydro-climatic events. They also showed that, regardless of the soil depth used, new wetlands established on actively managed agricultural lands (like the SB site), can release significant amounts of P after prolonged drying and subsequent flooding. Therefore, and contrary to the results of Liikanen et al. (2004),7 removing the topsoil prior to wetland construction may not always lead to less P export from newly-established wetlands affected by drying and wetting cycles.
Based on several past studies,11,26,27 a relationship was expected between dissolution of Fe oxides under flooded conditions and Pi release (in pore-water and floodwater). Results of the present experiment, however, showed no link between P release and either dissolved Fe or the amount of Fe/Al-bound P in wetland soils. Pore-water ORP readings in most of the cores (Table 3) were in the range in which reductive dissolution could occur (+100 to −100 mV).28 Yet, there was no noticeable increase in dissolved Fe and P both in the floodwater (Fig. 2) and pore-water (Table 3). Although pore-water was only collected during the second half of the experiment, this interpretation is still supported by the data because most of the Pi release occurred during the first 2 weeks of the study when strong reducing conditions had not yet developed. The relatively short duration of the flooding experiment (36 days) may have also contributed to the failure to detect reductive dissolution of Fe-bearing minerals. Thus, a different conclusion regarding Fe reduction may have been reached if the flooded mesocosms were monitored over a longer period of time (several months), or if dissolved O2 in floodwater was purposefully removed as was done in other mesocosm studies.7,27,29 However, similar to this study results, Russel and Maltby (1995)30 also failed to find relationships between P release and dissolved Fe, even though experimental conditions were optimized for Fe reduction. Surprisingly, and despite indication of reductive dissolution (low ORP coinciding with increased Fe), a decrease in dissolved P was observed in that above-referenced study,30 suggesting the co-occurrence of P retention processes including biological uptake and mineral precipitation.
The geochemical speciation model PHREEQ model31 was used to determine ion activities in the pore-water of the flooded soil cores. No assumption of true equilibrium was made as this condition is difficult to attain in natural settings but, given the experimental setup (stagnant flood water over several weeks), pore-water chemistry could provide a reasonable approximation of solid phase composition. Using calcium–phosphate double plots,32,33 pore-water ion speciation results were displayed along the stability lines of common calcium-phosphate minerals in cultivated calcareous soils in an effort to infer likely minerals controlling Pi in the flooded soil cores. The results (Fig. 5) indicated, oversaturation with respect to hydroxyapatites [HA, Ca5(PO4)3(OH)2], undersaturation with respect to dicalcium phosphate (DCD, CaHPO4), but a clear clustering within the solubility range of octacalcium phosphate [OCP, Ca8H2(PO4)6·5H2O] and β-tricalcium phosphate (β-TCP; Ca3PO4). This pattern suggests that these latter two minerals are the most likely solid phases controlling pore-water Pi in the flooded soil cores. A striking pattern in the data is a shift to the right along the x-axis of the double plot with drying. Although observed in cores from all sites, the shift was most pronounced in soil cores from the SB-a site. As a result of the drying treatment, data points are plotted closer to the stability lines of the more soluble calcium phosphate minerals. This finding is significant as it suggests that the large fluxes of Pi observed upon flooding of the dry treatment cores were probably a combination of two processes: organic matter mineralization during the drying phase and increased solubility of calcium–phosphate minerals controlling Pi concentration. Thus, drought events can increase P mobility in agricultural wetlands, and accelerate P export to surface waters during subsequent wet periods.
 | ||
| Fig. 5 Calcium–phosphate double function plot for pore-water samples collected after 19 days (top) and 36 days (bottom) of flooding of soil cores. Ion activities were computed using the PHREEQ model. Stability lines are drawn for various Ca–phosphate minerals, including hydroxyapatite (HA), β-tri-calcium phosphate (β-TCP), octacalcium phosphate (OCP), dicalcium phosphate (DCP), and di-calcium phosphate dehydrate (DCPD). Empty symbols represent moist treatment, filled symbols represent dry treatment. Abbreviations: SB-a = Schoolbranch (0–20 cm); SB-b = Schoolbranch (40–60 cm); W-1 = Van Wert county wetland; W-2 = Whitley county wetland. | ||
With longer duration of flooding (after day 19), clear changes were noted with regard to floodwater electrochemistry and well as dissolved P composition. In particular, the bulk (75–93%) of the dissolved P was present as DOP with longer flood duration (Fig. 2 and 3). Increased pore-water pH may have led to organic matter dispersion which, in turn, could result in the release of DOC, DOP and cations such as Ca2+ and Mg2+. This interpretation is supported by observed relationships between these variables, and is in agreement with previous studies29,34 that have documented the role of these divalent cations in the formation of organo–mineral complexes and stable soil aggregates. Conversely, soil structural destabilization and loss of Ca2+ have been reported in flooded soils.29 These past findings would help explain observed trends between floodwater concentration of divalent cations and organic matter (DOC and DOP) in the present study. The release of DOP (concomitant with increase in phosphatase activity, Fig. 3) is a concern as this could provide a mechanism for the transport of P from agricultural wetlands and its subsequent transformation into bioavailable Pi in receiving water bodies.
Implications for construction and management of agricultural wetlands
The study has demonstrated the effect of soil drying and nutrient status on the release of N and P from agricultural wetlands. In particular, marked difference in nutrient release was noted between croplands targeted as future wetland locations and sites where wetlands have already been established. These results can help wetland managers anticipate the range of nutrient release to expect in wetlands built on former cropland in the US Midwest. Since wetland construction typically requires landscape modifications and soil removal, a question examined in the study is whether a reduction in nutrient release can be achieved if the topsoil is removed and the subsurface layer is flooded instead. While nutrient fluxes were low in the moist treatment, appreciable amounts of nutrients were released from subsurface soil cores subjected to the dry treatment. These results therefore suggest a limited effect of topsoil removal on initial nutrient fluxes in wetlands that are periodically affected by drying and wetting events. To minimize nutrient release, recently-constructed wetlands should be kept moist, but this is not always possible because these systems are most often not connected to a permanent water source (e.g. seep). Nonetheless, flow-through wetland systems can be designed with adjustable water flow rates, allowing managers to select hydraulic retention times that optimize in situ removal of the nutrients released at the end of dry cycles. Further, because of the low respiration and denitrification activity in subsurface cores, mineral N released is most likely to be exported to adjacent surface water bodies instead of being transformed in situ in wetlands constructed with subsurface materials. With time however, a progressive improvement in these biological functions would be expected.Conclusions
The results of this study help identify the mechanisms controlling nutrient release in response to drying and wetting cycles in wetlands established on agricultural soils. In soil cores from riparian areas and from established wetlands, the dry treatment caused significant release of NO3− N upon flooding probably due to organic matter mineralization. However, initial NO3− pulses were short-lived and were rapidly denitrified in most cases (except in subsurface soil cores). The release of Pi could also be significant in newly constructed wetlands affected by wet–dry conditions, and was related to water extractable soil P. Although the magnitude was lower, Pi release was also important in subsurface soil cores. This was contrary to previous reports4–6 suggesting that P retention in constructed wetlands could improve with topsoil removal. Also contrary to the study hypothesis, no trend was observed between P release and dissolved Fe despite development of reducing conditions (low ORP) during the flooding experiment. These results suggest that, at least for US Midwest soils developed in calcareous glacial till, reductive dissolution is not the dominant factor controlling P release. An alternative hypothesis is that, in these soils, drought-induced Pi dynamics is related to the solubility of Ca–phosphate minerals. Indeed, geochemical modeling has shown that, with the dry treatment, pore-water Pi concentration consistently shifted closer to the stability lines of more soluble calcium-phosphate minerals. These geochemical alterations argue that seasonal drying and wetting events can cause significant pulses of P release from newly constructed wetlands.Acknowledgements
The authors thank Dr Gabriel Filippelli and Rosalice Buehrer who graciously analyzed the water samples for dissolved cations. Authors also thank Lauren Thomas and Adam Ahmadi for laboratory assistance, Vince Hernly, Katelin Fisher, Anchal Bangar and Andrea Shilling for field support. A.S. Smith was supported by an NSF GK-12 fellowship administered by the School of Science at IUPUI. Logistical support provided by the Center for Earth and Environmental Science (CEES) is gratefully acknowledged.References
- R. E. Turner and N. N. Rabalais, Linking landscape and water quality in the Mississippi river basin for 200 years, Bioscience, 2003, 53, 563–572 CrossRef.
- S. R. Carpenter, N. F. Caraco, D. L. Correll, R. W. Howarth, A. N. Sharpley and V. H. Smith, Nonpoint pollution of surface waters with phosphorus and nitrogen, J. Appl. Ecol., 1998, 8, 559–568 CrossRef.
- S. K. Skagen, C. P. Melcher and D. A. Haukos, Reducing sedimentation of depressional wetlands in agricultural landscapes, Wetlands, 2008, 28, 594–604 CrossRef PubMed.
- W. Koerner, J. L. Dupouey, E. Dambrine and M. Benoit, Influence of past land use on the vegetation and soils of present day forest in the Vosges mountains, France, J. Ecol., 1997, 85, 351–358 CrossRef.
- R. H. Kadlec, Phosphorus removal in emergent free surface wetlands, J. Environ. Sci. Health, Part A: Environ. Sci. Eng., 2005, 40, 1293–1306 CrossRef CAS PubMed.
- E. J. Dunne, K. R. Reddy and M. W. Clark, Phosphorus release and retention by soils of natural isolated wetlands, Int. J. Environ. Pollut., 2006, 28, 496–516 CrossRef CAS.
- A. Liikanen, M. Puustinen, J. Koskiaho, T. Vaisanen, P. Martikainen and H. Hartikainen, Phosphorus removal in a wetland constructed on former arable land, J. Environ. Qual., 2004, 33, 1124–1132 CrossRef CAS.
- D. A. Kovacic, M. B. David, L. E. Gentry, K. M. Starks and R. A. Cooke, Effectiveness of constructed wetlands in reducing nitrogen and phosphorus export from agricultural tile drainage, J. Environ. Qual., 2000, 29, 1262–1274 CrossRef CAS.
- Z. Kothavala, Extreme precipitation events and the applicability of global climate models to the study of floods and droughts, Mathematics and Computers in Simulation, 1997, 43, 261–268 CrossRef.
- V. Mishra, K. A. Cherkauer and S. Shukla, Assessment of drought due to historic climate variability and projected future climate change in the midwestern United States, J. Hydrometeor., 2010, 11, 46–68 CrossRef.
- A. Aldous, P. McCormick, C. Ferguson, S. Graham and C. Craft, Hydrologic regime controls soil phosphorus fluxes in restoration and undisturbed wetlands, Restoration Ecology, 2005, 13, 341–347 CrossRef.
- R. Corstanje and K. R. Reddy, Response of biogeochemical indicators to a drawdown and subsequent reflood, J. Environ. Qual., 2004, 33, 2357–2366 CrossRef CAS.
- M. M. Fisher and K. R. Reddy, Phosphorus flux from wetland soils affected by long-term nutrient loading, J. Environ. Qual., 2001, 30, 261–271 CrossRef CAS.
- NRCS, Land Resource Regions and Major Land Resource Areas of the United States, the Caribbean, and the Pacific Basin, US Department of Agricultural Handbook 296, National Resource Conservation Service, 2006.
- J. M. Andersen, Ignition method for determination of total phosphorus in lake Sediments, Water Res., 1976, 10, 329–331 CrossRef CAS.
- M. J. Hedley, J. W. B. Stewart and B. S. Chauhan, Changes in inorganic and organic soil-phosphorus fractions induced by cultivation practices and by laboratory incubations, Soil Sci. Soc. Am. J., 1982, 46, 970–976 CrossRef CAS.
- E. D'Angelo, J. Crutchfield and M. Vandiviere, Rapid, sensitive, microscale determination of phosphate in water and soil, J. Environ. Qual., 2001, 30, 2206–2209 CrossRef CAS.
- A. P. Rowland and P. M. Haygarth, Determination of total dissolved phosphorus in soil solutions, J. Environ. Qual., 1997, 26, 410–415 CrossRef CAS.
- R. L. Sinsabaugh and C. M. Foreman, Activity profiles of bacterioplankton in a eutrophic river, Freshwater Biol., 2001, 46, 1239–1249 CrossRef.
- M. M. Mikha, C. W. Rice and G. A. Milliken, Carbon and nitrogen mineralization as affected by drying and wetting cycles, Soil Biol. Biochem., 2005, 37, 339–347 CrossRef CAS PubMed.
- I. A. Mian, M. Riaz and M. S. Cresser, What controls the nitrate flush when air dried soils are rewetted?, Chemical ecology, 2008, 24, 259–267 CrossRef CAS.
- P. G. Hunt, T. A. Matheny and K. S. Ro, Nitrous oxide accumulation in soils from riparian buffers of a coastal plain watershed-carbon/nitrogen ratio control, J. Environ. Qual., 2007, 36, 1368–1376 CrossRef CAS PubMed.
- P. A. Jacinthe, W. A. Dick and L. B. Owens, Overwinter soil denitrification activity and mineral nitrogen pools as affected by management practices, Biol. Fertil. Soils, 2002, 36, 1–9 CrossRef CAS.
- M. Raubuch and F. Beese, Influence of soil acidity on depth gradients of microbial biomass in beech forest soils, Eur. J. For. Res., 2005, 124, 87–93 CrossRef CAS.
- E. M. Bostic and J. R. White, Soil phosphorus and vegetation influence on wetland phosphorus release after simulated drought, Soil Sci. Soc. Am. J., 2007, 71, 238–244 CrossRef CAS.
- E. O. Young and D. S. Ross, Phosphate release from seasonally flooded soils: A laboratory microcosm study, J. Environ. Qual., 2001, 30, 91–101 CrossRef CAS.
- P. A. Jacinthe, P. M. Groffman and A. J. Gold, Dissolved organic carbon dynamics in a riparian aquifer: Effects of hydrology and nitrate enrichment, J. Environ. Qual., 2003, 32, 1365–1374 CrossRef CAS.
- W. J. Mitsch and J. G. Gosselink, Wetlands, John Wiley and Sons, New Jersey, 2007 Search PubMed.
- A. B. De-Campos, A. I. Mamedov and C. H. Huang, Short-term reducing conditions decrease soil aggregation, Soil Sci. Soc. Am. J., 2009, 73, 550–559 CrossRef CAS.
- M. Russel and E. Maltby, The role of hydrologic regime on phosphorous dynamics in a seasonally waterlogged soil, in Hydrology and Hydrochemistry of British Wetlands, ed. J.M.R. Hughes and A.L. Heathwaite, Wiley, Chichester, U.K, 1995, pp. 245–260 Search PubMed.
- D. L. Parkhurst and C. A. J. Appelo, User's guide to PHREEQC (Version 2), USGS, Reston, VA, 1999 Search PubMed.
- S. Tunesi, V. Poggi and C. Gessa, Phosphate adsorption and precipitation in calcareous soils: the role of calcium ions in solution and carbonate minerals, Nutr. Cycling Agroecosyst., 1999, 53, 219–227 CrossRef.
- M. Jalali, Phosphorous concentration, solubility and species in the groundwater in a semi-arid basin, southern Malayer, Western Iran, Environ. Geol., 2009, 57, 1011–1020 CrossRef CAS PubMed.
- I. R. Phillips and M. Greenway, Changes in water-soluble and exchangeable ions, cation exchange capacity, and phosphorus (max) in soils under alternating waterlogged and drying conditions, Commun. Soil Sci. Plant Anal., 1998, 29, 51–65 CrossRef CAS.
| This journal is © The Royal Society of Chemistry 2014 |