Monitoring low-radioactivity caesium in Fukushima waters
Akiko
Kitajima
a,
Hiroshi
Ogawa
a,
Takeshi
Kobayashi
b,
Tatsuya
Kawasaki
b,
Yoshiaki
Kawatsu
b,
Tohru
Kawamoto
a and
Hisashi
Tanaka
*a
aNanosystem Research Institute, National Institute of Advanced Industrial Science and Technology (AIST), 1-1-1 Higashi, Tsukuba, Ibaraki, Japan. E-mail: a-kitajima@aist.go.jp; hisashi.tanaka@aist.go.jp; Fax: +81-29-861-6288; Tel: +81-29-861-6288
bGroup I, Central Research Laboratory, Japan Vilene Company, Ltd., 7Kita-Tone, Koga City, Ibaraki, Japan
First published on 11th November 2013
Abstract
A new monitoring system has been established to assess low-level radioactive caesium in Fukushima waters directly using caesium adsorbents: plastic containers, U8 containers, and a germanium (Ge) detector container packed with nanoparticle–Prussian blue (PB) immobilized on a polymer. The results show that the calibration coefficient for a flow rate of 0.3 L min−1 was 1.27 in Fukushima waters for germanium semiconductor scintillations related to 133Cs concentrations and radioactive caesium amounts.
Environmental impactThis work was performed for monitoring low-level radioactive caesium in waters at Fukushima. We have performed the direct measurement by using a U8 container containing Cs adsorbent with a Ge semiconductor detector. We focused on the radioactive contamination of waters, such as paddy field water, river water and pond water in Fukushima. It is said that the radioactive caesium amount in water is very low, 0.01 Bq kg−1. It is impossible to determine in these waters, so we condensed the water to filter from 100 L to 300 L of effluents. Radioactive caesium in waters undergoes a change with rain or snow or season fluctuation. We will have to monitor waters in Fukushima at least for 10 years. |
Introduction
The Fukushima Daiichi nuclear disaster entailed a series of equipment failures, nuclear meltdowns, and releases of radioactive materials such as caesium and iodine at the Fukushima I Nuclear Power Plant, affecting a broad area of eastern Japan following the Great East Japan Earthquake and tsunami on 11 March 2011.1 Because of their long half-lives and large amounts, 134Cs and 137Cs are among the most harmful radioactive elements. Their removal from the environment is an urgent task to be addressed although the event had occurred over two years ago.2 Especially important is 137Cs, which is a radioactive caesium isotope formed by nuclear fission. Therefore, it has not occurred on Earth. Its half-life is about 30.17 years. It decays to a metastable nuclear isomer of 137Ba by beta emission. One gram of 137Cs has an activity of 3.215 terabecquerel (TBq).Small amounts of radioactive caesium have been released into the environment during nearly all nuclear weapons tests and some nuclear accidents, the most notable being the Chernobyl disaster.3 In fact, 137Cs was among the isotopes distributed by the reactor explosion, which constituted the greatest risk to human health.
Caesium reacts with water to produce a water-soluble compound (caesium hydroxide). Biological metabolism can replace potassium with caesium. After entering the body, caesium becomes distributed more uniformly throughout the body, with higher concentrations in muscle tissues and lower concentrations in bones.3 Moreover, radioactive caesium in water is reportedly transferred to crops such as unpolished rice. In waters of Fukushima, low-level radioactive caesium poses health issues.4
Prussian blue, PB, is known as a caesium adsorbent. Accidental ingestion of caesium can be treated with PB, which binds to it chemically and speeds its expulsion from the body.3 In fact, it was administered to children in Russia and to domestic animals in Ukraine, Belarus, Norway, and Sweden to remove radioactive caesium after the Chernobyl disaster.5,6 Known as a dark blue pigment used in arts and industry for three centuries since its discovery in 1704, PB has the idealized formula of Fe7(CN)18.7 It was easily obtained historically from ferrocyanide anions and iron cations in their dilute solution through co-precipitation. In addition, Prussian blue nanoparticles smaller than 20 nm have been established with dispersion control.8 Recently, PB and PB analogues (transition metal hexacyanides or transition metal hexacyanometalates) have come used as remarkable compounds for electrochromic materials,9 catalysts,10 batteries,11 sensors,12–14 photomagnets,15 and hydrogen storage.16 PB has been synthesized most readily as an insoluble precipitate in quantitative yield from Na4[Fe(CN)6]·10H2O and Fe(NO3)3·9H2O. It has been granulated using a spray dryer with thermal denaturation.
Yasutaka et al.17 developed a radioactive-caesium condensation unit for monitoring their concentration in waters using caesium-adsorbents of PB. Tsuji et al.18 developed a direct measurement method for low-level radioactive caesium in environmental waters using cylindrical plastic cartridges containing nonwoven fabric impregnated with Prussian blue.
We have developed a new monitoring system that directly determines low-level radioactive caesium in the dissolved form in waters in the environment passed using caesium adsorbents. The U8 container is a cylindrical plastic container with a volume of about 100 ml (47 mm in diameter and 60 mm in height). It is a standard container for radioactive measurement in Japan. The radioactive standard sources in U8 are available from the Japan Radioisotope Association, for Ge semiconductor detectors packed with nanoparticle–PB immobilized on a polymer. Reportedly, radioactive caesium of the waters in Fukushima is less than 0.01 Bq L−1.19 Ge semiconductor detectors show a limit of detection (LOD) of 0.3 Bq L−1, for 12 h measurement. Direct determination is therefore impossible. This new monitoring system shows the LOD of 0.018 Bq L−1 for even 0.5 h measurement in experiments. Through these U8 containers with adsorbents were passed from 100 to 300 L of water such as paddy field water, pond water, and river water from Fukushima. The count rate of Ge detector is proportional to the inverse square of the axial distance r from the source to the front of it (r-2),20 whereas the adsorbed U8 container has distribution gradient of radioactive caesium, that is, higher at the entrance side than that of the exit one. Consequently, a calibration coefficient is necessary to estimate an accurate value from the U8 container measurement. Furthermore, it is necessary to ascertain the amount of radioactive caesium dependent on or independent of the effluent volume. Laboratory experiments were conducted to determine the calibration coefficient for the Ge semiconductor detector.
Because 133Cs, stable caesium, exists in environmental waters, the 133Cs concentration affects the radioactive caesium amount not only in terms of adsorption efficiency but also counting efficiency with the Ge semiconductor detector. The isotopic ratio of radioactive caesium/133Cs is on the order of about 1/106. It is therefore important for radioactive caesium decontamination to ascertain the 133Cs concentration. If higher concentrations of 133Cs occur mainly at the entrance of the U8 container with an adsorbent, then the radiation amount would be smaller than the actual value.
Materials and methods
We filled a water-permeable organic polymer on which nanoparticle–PB is immobilized in the U8 container. A hole was punched into the U8 container with an adsorbent, nanoparticle–PB of about 1.0 g and a polymer of about 17.8 g, to pass water through it, as shown in Fig. 1(a)–(c).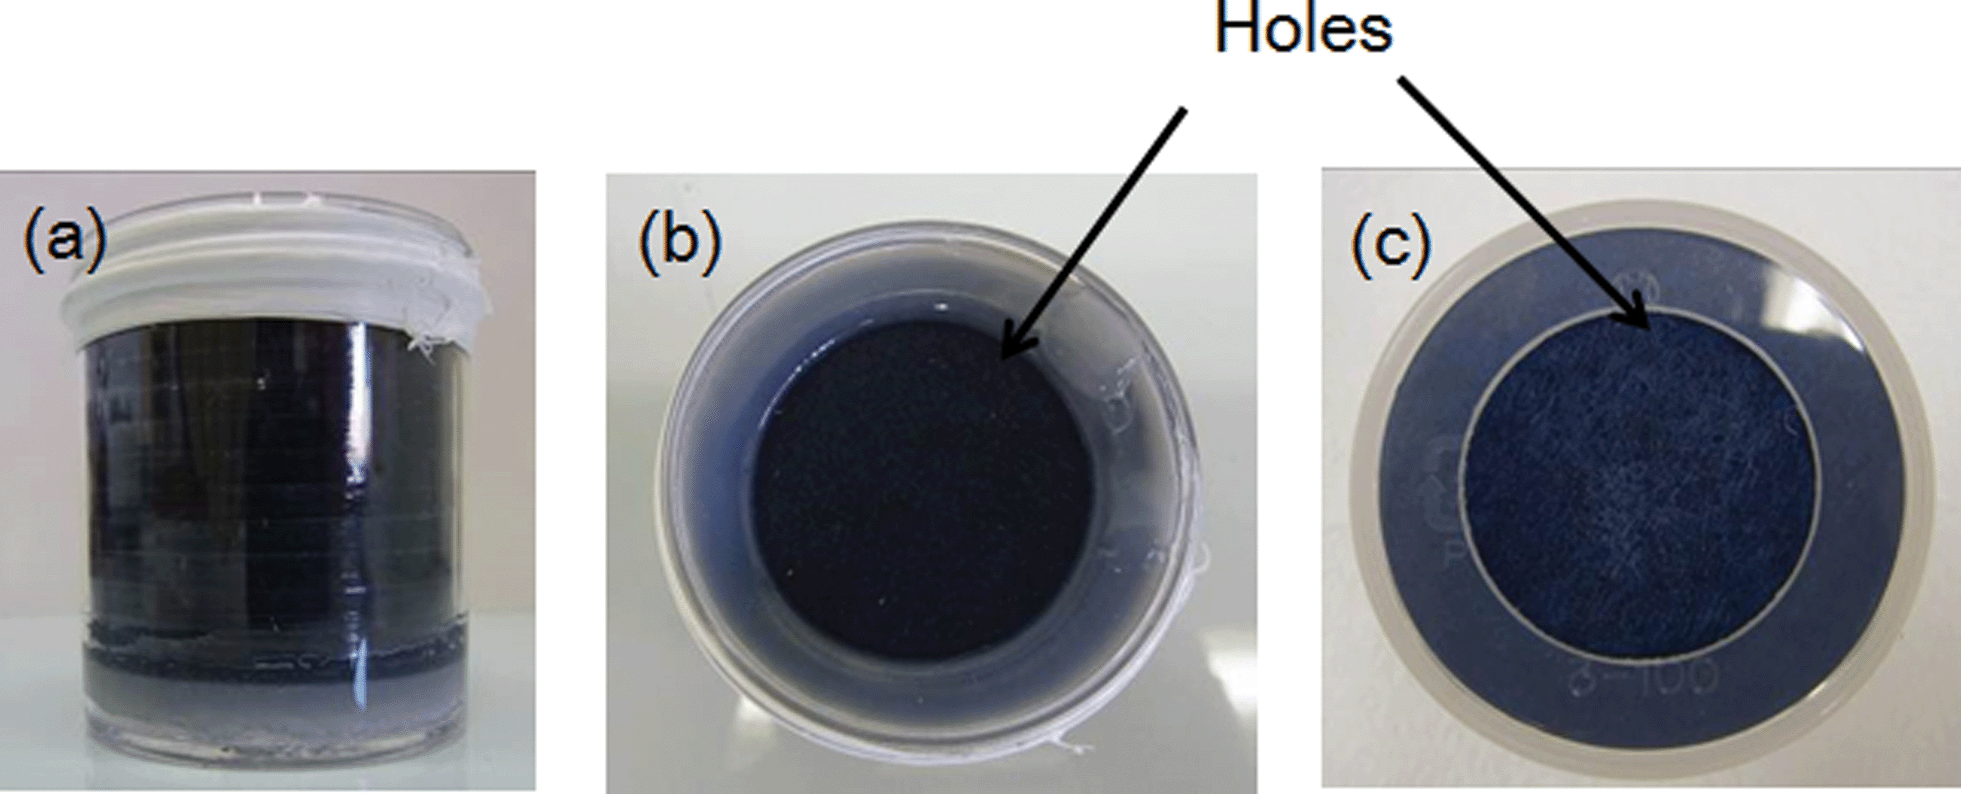 | ||
| Fig. 1 Appearance of a U8 container packed with a caesium adsorbent applied in this study: (a) a side-view, (b) a top-view and (c) a bottom-view. | ||
We first sought to determine the caesium distribution on the adsorbent between 133Cs and radioactive-caesium at several concentrations. If any correlation was found among them, the radioactive caesium amount in the U8 container with an adsorbent showed a difference of distribution in the 133Cs concentration. Therefore, simulated water with different concentrations of radioactive caesium was prepared as follows: 133Cs 0.35, 1.0 and 5.0 μg L−1, the sum of 134Cs and 137Cs, 0.10, 0.05 and 0.033 Bq L−1 with 100, 200 and 300 L of effluent, respectively, produced from aqueous extraction from incineration ash. All of these U8 containers were designed with an adsorbent containing 10 Bq during passage of the simulated waters. We prepared simulated waters that had radioactive caesium of 10 Bq in every effluent volume, 100 L, 200 L and 300 L.
Linear regression was conducted for 133Cs and radioactive caesium. Prepared simulated-water contains calcium, potassium and sodium within a few milligrams per litre. Experiments using these U8 containers with an adsorbent achieved three times the performance under the same conditions as those with 100 L of effluent with 0.3 L min−1 flow rate. Each 200 and 300 L of effluent was concentrated to 2 L. Subsequently, they were assessed for radioactive caesium using a Ge semiconductor detector (GEM35-70, GEM20-70; Seiko EG&G Co. Ltd.). The 133Cs concentration of each fraction was determined using an inductively coupled plasma mass spectrometer (ICP-MS, NexIon300D; PerkinElmer Inc.). The radioactive caesium concentration of each U8 container with an adsorbent was measured using a Ge semiconductor detector. All chemicals were of analytical reagent grade, and all aqueous solutions were prepared using deionized and charcoal-treated water (specific resistance > 18.2 MΩ cm) obtained using a Milli-Q reagent-grade water system (Millipore Corp., Bedford, MA). Fig. 2 shows a schematic illustration of the experimental equipment used in this study.
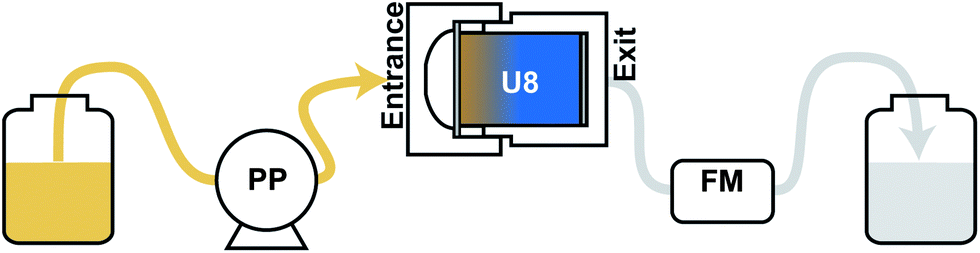 | ||
| Fig. 2 Schematic drawing of this monitoring system. PP, peristaltic pump; U8, U8-type PB column container; FM, flow meter. | ||
Results and discussions
Table 1 presents results of the radioactive caesium amount of each U8 container with an adsorbent through 100 L effluent determined by using a Ge semiconductor detector for only 0.5 h measurement. ND means that the measurement value is less than the level of detection. When placing the entrance side of U8 containers with a caesium adsorbent towards the Ge detector, the radioactive caesium amounts were slightly larger than the predicted value in all cases, while the radioactive caesium amounts were about one-third of the predicted value in all cases, when placing the exit side of U8 containers towards the Ge container. These facts demonstrate that the U8 container with an adsorbent has a distribution of caesium concentration, namely caesium concentration at the entrance of it is the highest. In contrast, that at the exit is the lowest. When the 133Cs concentration of each fraction was almost at the LOD, it was applied to the limit of quantitation value, <0.00125 μg L−1. It was a LOQ value of analytical equipment, ICP-MS which was used in this study. ICP-MS showed no detectable amount of 133Cs. Therefore, these U8 containers with an adsorbent were able to adsorb both 133Cs and radioactive caesium through water.| Sample name | Radioactive caesium (Bq kg−1) | Error (±Bq kg−1) | Limit of detection (Bq kg−1) | |||||
|---|---|---|---|---|---|---|---|---|
| Caesium-134 | Caesium-137 | Radioactive caesium | Caesium-134 | Caesium-137 | Caesium-134 | Caesium-137 | ||
| Caesium-133 1.0 μg L−1 no. 1 | Entrance | 48.5 | 92.4 | 140.9 | 5.25 | 6.99 | 10.2 | 9.55 |
| Caesium-133 1.0 μg L−1 no. 1 | Exit | 14.7 | 37.1 | 51.8 | 3.91 | 4.51 | 11.1 | 7.71 |
| Caesium-133 1.0 μg L−1 no. 2 | Entrance | 36.3 | 82.9 | 119.2 | 4.66 | 6.34 | 10.3 | 8.74 |
| Caesium-133 1.0 μg L−1 no. 2 | Exit | N.D | 25.9 | 25.9 | — | 4.12 | 10.0 | 9.44 |
| Caesium-133 1.0 μg L−1 no. 3 | Entrance | 47.6 | 81.5 | 129.1 | 4.66 | 5.96 | 8.69 | 8.17 |
| Caesium-133 1.0 μg L−1 no. 3 | Exit | 11.7 | 27.2 | 38.9 | 2.75 | 3.61 | 7.40 | 6.86 |
| Caesium-133 0.35 μg L−1 no. 1 | Entrance | 44.1 | 76.8 | 120.9 | 5.38 | 7.08 | 9.87 | 8.63 |
| Caesium-133 0.35 μg L−1 no. 1 | Exit | 15.6 | 24.2 | 39.8 | 3.78 | 4.60 | 10.1 | 10.8 |
| Caesium-133 0.35 μg L−1 no. 2 | Entrance | 62.2 | 105 | 167.2 | 6.76 | 9.22 | 11.3 | 13.1 |
| Caesium-133 0.35 μg L−1 no. 2 | Exit | 17.5 | 22.6 | 40.1 | 4.02 | 3.66 | 11.1 | 7.83 |
| Caesium-133 0.35 μg L−1 no. 3 | Entrance | 44.2 | 95.9 | 140.1 | 5.97 | 8.60 | 12.3 | 12.3 |
| Caesium-133 0.35 μg L−1 no. 3 | Exit | 11.3 | 25.6 | 36.9 | 3.20 | 3.86 | 9.23 | 8.26 |
| Caesium-133 5.0 μg L−1 no. 1 | Entrance | 38.9 | 89.0 | 127.9 | 4.89 | 6.71 | 10.6 | 8.85 |
| Caesium-133 5.0 μg L−1 no. 1 | Exit | 18.8 | 30.4 | 49.2 | 3.39 | 4.29 | 8.04 | 8.84 |
| Caesium-133 5.0 μg L−1 no. 2 | Entrance | 51.5 | 98.4 | 149.9 | 5.22 | 6.92 | 9.77 | 8.24 |
| Caesium-133 5.0 μg L−1 no. 2 | Exit | 16.2 | 17.1 | 33.3 | 3.29 | 3.46 | 8.32 | 8.54 |
| Caesium-133 5.0 μg L−1 no. 3 | Entrance | 35.6 | 81.5 | 117.1 | 4.88 | 6.60 | 11.3 | 10.2 |
| Caesium-133 5.0 μg L−1 no. 3 | Exit | 17.6 | 35.4 | 53.0 | 3.66 | 4.42 | 9.60 | 8.12 |
Fig. 3 shows the relationship between 133Cs and the radioactive caesium adsorption rate using the same adsorbents in U8 container contents. This caesium adsorbent shows a good linear relationship with a R2 of 0.991 between 133Cs and radioactive caesium. The 133Cs adsorption rate of this adsorbent and radioactive caesium of that are strongly correlated, even at low-level radiation. Both radioactive caesium and 133Cs have a marked tendency for adsorption toward the Prussian blue nanoparticles. Therefore, by examining only the 133Cs adsorption behaviour of adsorbents, the results of radioactive caesium are obtainable.
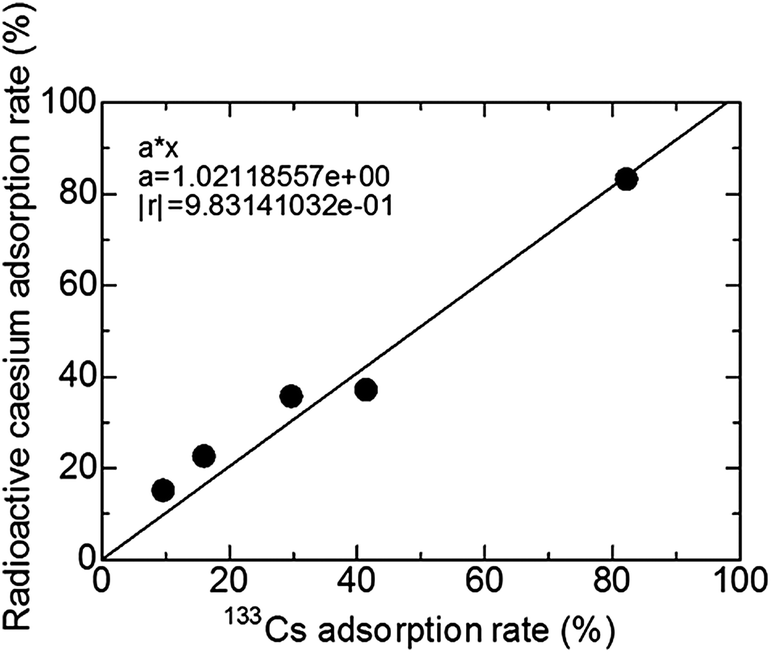 | ||
| Fig. 3 Relationship between 133Cs and radioactive caesium adsorption rate. | ||
Tables 2 and 3 show the results of radioactive caesium concentrations of each U8 container with an adsorbent through 200 L and 300 L of effluent. Each effluent was concentrated to 2 L, and was later determined using a Ge semiconductor detector. Each effluent was ND. The measured value was less than the LOD, meaning that these U8 containers adsorbed almost all the radioactive caesium.
| Sample name | Radioactive caesium (Bq kg−1) | Error (±Bq kg−1) | Limit of detection (Bq kg−1) | |||||
|---|---|---|---|---|---|---|---|---|
| Caesium-134 | Caesium-137 | Radioactive caesium | Caesium-134 | Caesium-137 | Caesium-134 | Caesium-137 | ||
| Caesium-133 1.0 μg L−1 200 L | Entrance | 43.7 | 81.8 | 125.5 | 5.02 | 6.44 | 10.3 | 8.81 |
| Caesium-133 1.0 μg L−1 200 L | Exit | 15.8 | 32.3 | 48.1 | 3.83 | 4.62 | 10.6 | 10.1 |
| Caesium-133 1.0 μg L−1 300 L | Entrance | 49.8 | 90.8 | 140.6 | 5.21 | 6.64 | 10.0 | 7.88 |
| Caesium-133 1.0 μg L−1 300 L | Exit | 17.7 | 31.4 | 49.1 | 3.74 | 4.36 | 9.86 | 8.98 |
| Sample name | Sample (L) | Radioactive (Bq kg−1) | Error (±Bq kg−1) | Limit of detection (Bq L−1) | ||||
|---|---|---|---|---|---|---|---|---|
| Caesium-134 | Caesium-137 | Radioactive caesium | Caesium-134 | Caesium-137 | Caesium-134 | Caesium-137 | ||
| 200 L concentrated to 2 L | 2.0 | N.D | N.D | N.D | — | — | 0.000817 | 0.000812 |
| 300 L concentrated to 2 L | 2.0 | N.D | N.D | N.D | — | — | 0.000748 | 0.000939 |
Fig. 4 presents the average of three times standard deviation of the radioactive caesium amount in U8 containers with an adsorbent, when the concentrations of 133Cs were 0.35, 1.0, and 5.0 μg L−1 of the effluent 100 L. All values are slightly greater than the predicted value and depend on the 133Cs concentration. Some calibration values are needed for practical demonstration experiments in waters of Fukushima. It must be noted that the calibration coefficient should be determined when the flow rate is changed. The error of the calibration coefficient is calculated to be ±14% at the most. The error is the count error in the radioactivity evaluation, calculated with the sample dependence, and the linear suppression procedure. Therefore linear regression can be determined. The 133Cs concentrations in paddy fields and ponds in a village at Fukushima were also determined; they were 0.002–0.008 μg L−1. Accordingly, the calibration coefficient of 1.27 was derived from linear regression and the 133Cs concentration in waters in a village at Fukushima. Fig. 5 shows the amounts of radioactive caesium in U8 containers with an adsorbent when the concentration of 133Cs was 1.0 μg L−1 with 100, 200, and 300 L of effluent. When placing the front side of U8 container with a caesium adsorbent towards the Ge detector, the radioactive caesium amounts were slightly larger than the predicted value in any case of 100, 200, or 300 L of effluent. The radioactive caesium amount was expected to decrease as shown in Fig. 4 but it did not. The 133Cs concentration of 1.0 μg L−1 might be too low to identify small differences.
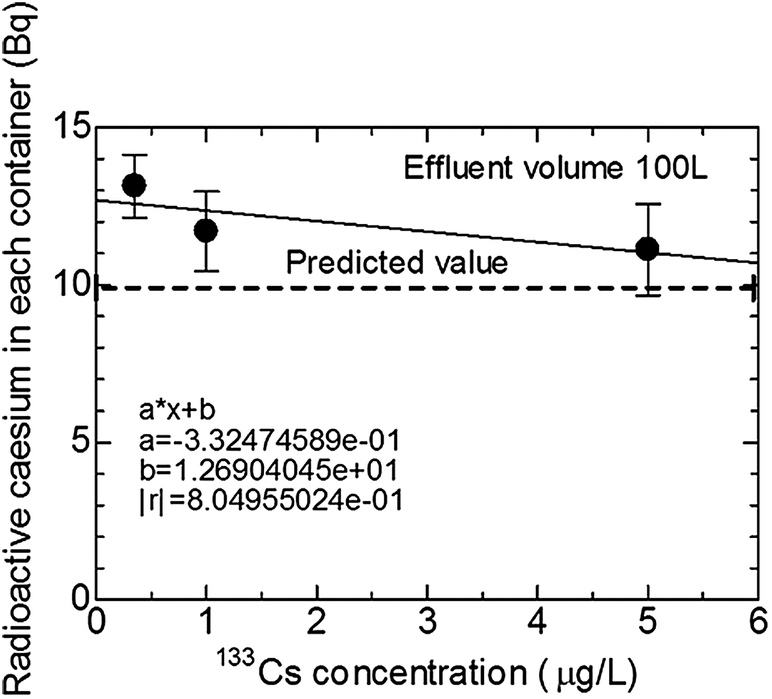 | ||
| Fig. 4 Average of radioactive caesium amounts in U8 containers with standard deviation when the concentrations of 133Cs were 0.35, 1.0, and 5.0 μg L−1 of effluent 100 L. | ||
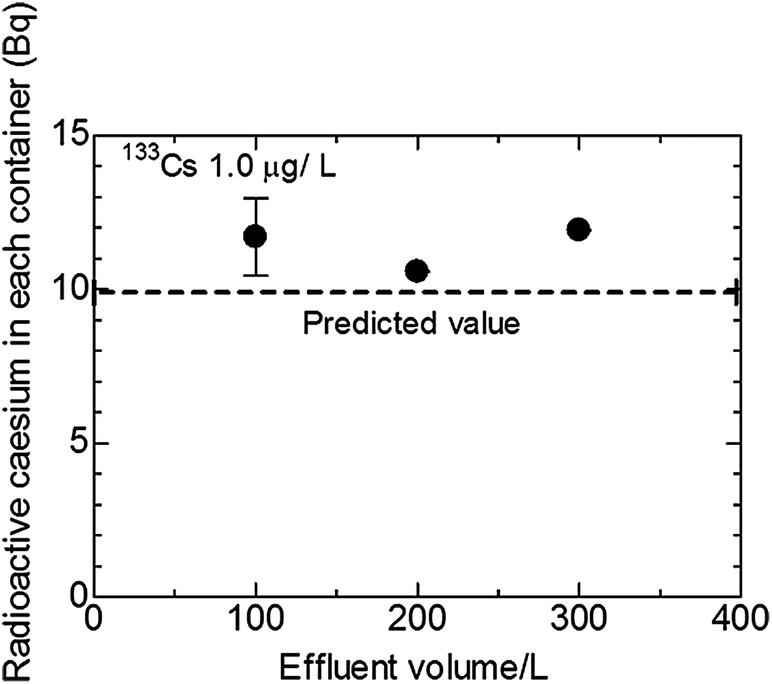 | ||
| Fig. 5 Amounts of radioactive caesium in U8 containers when the concentration of 133Cs was 1.0 μg L−1 with 100, 200 and 300 L of effluent. | ||
Conclusions
We established a new monitoring system that determines low-level radioactive caesium directly using caesium adsorbents: a U8 container, Ge semiconductor detector container, packed with nanoparticle–PB immobilized on a polymer, in waters at Fukushima. The results show a calibration coefficient for a flow rate of 0.3 L min−1 to be 1.27 in waters at Fukushima for a Ge semiconductor detector for 133Cs concentrations and radioactive caesium amounts.The Ge semiconductor detector shows a LOD of 0.3 Bq L−1 for a 12 h measurement, but this new monitoring system shows a LOD of 0.018 Bq L−1 for even 0.5 h measurement in the experiments.
The PB caesium adsorbent contains a cyanide group, but the concentration of each solution passed through these U8 containers was less than the limit of quantitation, LOQ, of <0.1 mg L−1. It is permissible within limits of the effluent standard of <0.5 mg L−1 in the Fukushima prefecture. This new low-level radioactive caesium monitoring system is anticipated to have applications in areas with water in villages of Fukushima.
Acknowledgements
This work was partly supported by Ministry of Agriculture, Forestry and Fisheries as Strategic Funds for the Promotion of Science and Technology. The authors would like to thank Mr Takayuki Funahashi, Mr Yoshikuni Umeoka and Mr Tomohiro Kizuka for their helpful support with experiments. The authors would like to express their grateful acknowledgement to Professor Akihiko Yokoyama for helpful discussion.References
- Nat. Geosci., 2011, 4, 269 Search PubMed.
- R. Stone, Science, 2011, 331, 1507 CrossRef CAS PubMed.
- Toxicological Profile for Cesium, in US Department of Health and Human Services, April 2004.
- http://wwwcms.pref.fukushima.jp/download/1/youinkaiseki-kome130124.pdf .
- International Atomic Energy Agency – Division of Public Information, May 2005, retrieved 23 March 2011.
- B. J. Howard, 2011 NARO International Symposium, Abstr., No. 17, Tsukuba, Japan, September 5, 2011 Search PubMed.
- K. R. Dunbar and R. A. Heintz, in Progress in Inorganic Chemistry, ed. K. D. Karlin, Wiley, 1977, vol. 45, pp. 283–391 Search PubMed.
- A. Gotoh, H. Uchida, M. Ishizaki, T. Satoh, S. Kaga, S. Okamoto, M. Ohta, M. Sakamoto, T. Kawamoto, H. Tanaka, M. Tokumoto, S. Hara, H. Shiozaki, M. Yamada, M. Miyake and M. Kurihara, Nanotechnology, 2007, 18, 345609 CrossRef.
- H. Shiozaki, T. Kawamoto, H. Tanaka, S. Hara, M. Tokumoto, A. Gotoh, T. Satoh, M. Ishizaki, M. Kurihara and M. Sakamoto, Jpn. J. Appl. Phys., 2008, 47, 1242 CrossRef CAS.
- K. Itaya, N. Shoji and I. Uchida, J. Am. Chem. Soc., 1984, 106, 3423 CrossRef CAS.
- A. J. Eftekhari, Power Sources, 2004, 132, 291 CrossRef CAS PubMed.
- P. A. Fiorito, V. R. Goncales, E. A. Ponzio and S. I. C. Torresi, Chem. Commun., 2005, 366 RSC.
- A. A. Karyakin, Electroanalysis, 2001, 13, 813 CrossRef CAS.
- Q. Chi and S. Dng, Anal. Chim. Acta, 1995, 310, 429 CrossRef CAS.
- O. Sato, S. Hasyami, Y. Einaga and Z. Z. Gu, Bull. Chem. Soc. Jpn., 2003, 76, 443 CrossRef CAS.
- S. S. Kaye, J. R. Long, H. Shiozaki, T. Kawamoto, H. Tanaka and S. Ha, J. Am. Chem. Soc., 1982, 104, 4767 CrossRef.
- T. Yasutaka, et al. , J. Nucl. Sci. Technol., 2013, 50(7), 674 CrossRef CAS.
- H. Tsuji, et al. , J. Radioanal. Nucl. Chem., 2013 DOI:10.1007/s10967-013-2735-0.
- http://link.springer.com/book/10.1007/978-4-431-54328-2/page/1 .
- D. L. Smith, Nucl. Instrum. Methods, 1971, 94, 157 CrossRef CAS.
| This journal is © The Royal Society of Chemistry 2014 |