From marine plants to photovoltaic devices†
Liang
Wang
a,
Yantao
Shi
*a,
Xiaogong
Bai
a,
Yujin
Xing
a,
Hong
Zhang
a,
Lin
Wang
c,
Wei
Guo
a,
Ning
Wang
c,
Tingli
Ma
*ab and
Michael
Grätzel
d
aState Key Laboratory of Fine Chemicals, College of Chemistry, Dalian University of Technology (DUT), Dalian, China. E-mail: tinglima@dlut.edu.cn; shiyantao@dlut.edu.cn
bGraduate School of Life Science and Systems Engineering Kyushu Institute of Technology 2-4 Hibikino, Wakamatsu, Kitakyushu, Fukuoka 808-0196, Japan
cDepartment of Physics and the Institute of Nano Science and Technology, the Hong Kong University of Science and Technology, Hong Kong, China
dLaboratory for Photonics and Interfaces, Institute of Chemical Sciences and Engineering, Swiss Federal Institute of Technology, CH1015 Lausanne, Switzerland
First published on 29th October 2013
Abstract
We demonstrated that extracts from sea tangle can serve as a sensitizer, redox couple, as well as a counter electrode material, or even can be fabricated into an “all-natural solar cell”. Especially, the carbon counter electrode from sea tangle has achieved a comparable performance with Pt, favorable for the cost-reduction of DSCs.
Broader contextDue to the continuous depletion of fossil fuels and environmental pollution, searching for regenerative and clean energy sources is an important task for human beings. Solar energy has attracted widespread attention due to its low cost, cleanliness and reproducibility. Dye-sensitized solar cells (DSCs), a photovoltaic device, have shown promising application prospects. However, the noble and nonrenewable nature of Pt impedes the extensive use and restricts commercial development. Artificial dyes, due to their complicated synthetic processes, low yield and high cost, also hinder large-scale production. Herein, from a totally novel perspective, we demonstrate the multi-functions of sea tangle in assembling all-natural DSCs, beneficial to reducing cost and energy consumption. This novel strategy of using a natural plant as a multi-functional material in photovoltaic device fabrication not only impresses with excellent performance, but also with outstanding environmental benefits. |
By converting sunlight into electricity directly, photovoltaic solar cells are powerful tools for utilizing Earth's abundant renewable energy source. However, for traditional silicon solar cells, it seems difficult to achieve large-scale popularization due to their high production cost, long energy-payback-time, as well as resultant serious environmental pollution. With the introduction of dye-sensitized solar cells (DSCs) in 1991, the goal of developing a widespread and affordable solar cell alternative became more and more feasible.1 DSCs, consisting of n-type porous film, dye, electrolyte and counter electrode (CE), operate by simulating photosynthesis and are cheaper to produce than silicon solar cells. Despite these advancements, it is crucial to further reduce the production cost, either by simplifying fabrication processes, or by developing inexpensive but efficient functional materials.
In contrast to synthetic chemicals or materials, natural materials are commonly abundant and cheap. Importantly, they can function as building blocks for DSCs without requiring tedious, multistep preparations. For instance, some pigments from leaves, flowers, pericarps, or juices can be used as sensitizers in DSCs. In 2010, Calogero et al. extracted indicaxanthin and betacyanins from plants (flowers, turnip, prickly pear) and successfully applied them as sensitizers into DSCs.2 Previously, our group compared 20 natural dyes used as sensitizers in DSCs and found that some, especially the mangosteen pericarp, could give a relatively high power conversion efficiency (PCE) of 1.17%.3 Furthermore, several kinds of carbon materials showed excellent performance for reduction of electron shuttles on CEs in DSCs.4 Gao et al. also prepared mesoporous carbons by using bamboo and oak, demonstrating their great potential when used as CE materials in DSCs.5
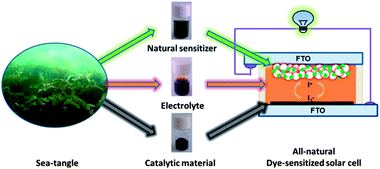
The ocean, covering 3/4 of the earth's surface, supplies the world with abundant resources, for example fossil fuels, minerals, foods, clean oxygen, etc. Sea tangle (ST) is a well-known and abundant marine plant which is commonly used for chemicals, foods, medicines, vitamins, and some necessary microelements of the human body, e.g. iodine, potassium, sodium, calcium, selenium, and so on. Herein, taking on a novel perspective, we demonstrate the multi-function of ST in building a natural photovoltaic device. As shown in Scheme 1, from ST we can extract some essential components for DSCs, not only the natural dye used as a sensitizer, but also the iodine for shuttles of electrons and the carbon materials as catalysts for high-efficiency CEs.
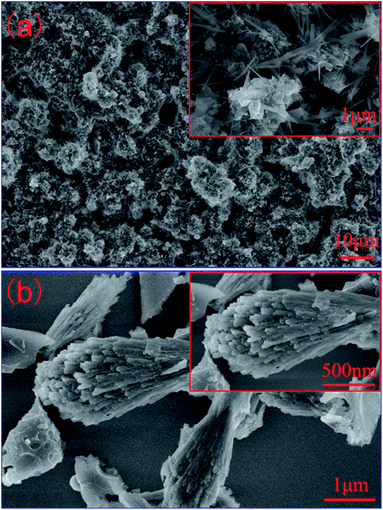
Prepared by one-step carbonization of ST under N2 atmosphere, the product shows the chaotic and highly porous features in morphology, which is mainly composed of regular array blocks and slices, as shown in Fig. 1a. Except for carbon, XRD patterns in Fig. S1† indicate that some crystallized inorganic materials like CaS can also be formed in this way. Furthermore, Fig. 1b exhibits besom-like structures derived from supernatant flotage when the ST-CE is dispersed in water. The corresponding XRD patterns in Fig. S2† show that it is a kind of carbon. EDS measurements (Fig. S3†) reveal that various elements exist in this hybrid natural material, for example C, Ca, K, Ni, O and S. The detailed investigation on the treatment by hydrochloric acid for removing redundant metal ions and nonmetal elements has been shown in Fig. S4, S5 and Table S1.† The results show that the acid treatment has no effect on the photovoltaic performance of the ST-based device.
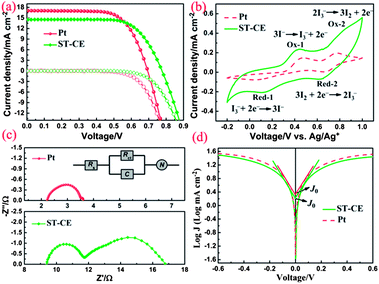
We fabricated this hybrid ST-CE, and compared its performance to the traditional, expensive sputtered Pt-CE in DSCs. The sensitizer was the synthetic Ru-complex dye (N719).6 Current–voltage (J–V) curves of the fabricated DSCs based on ST-CE and Pt-CE under simulated AM1.5, 100 mW cm−2 illumination are presented in Fig. 2a and the detailed photovoltaic parameters are summarized in Table 1. Values of open-circuit photovoltage (Voc), short-circuit photocurrent density (Jsc), fill factor (FF) and PCE of the DSCs based on ST-CE are 0.777 V, 14.45 mA cm−2, 0.70 and 7.82%, respectively. In particular, the PCE of the ST-CE is comparable to the 8.11% PCE of the traditional Pt-CE. Compared with Pt-CE, the Voc based on ST-CE increased from 0.695 V to 0.777 V, although accompanied with Jsc decreased from 17.06 to 14.45 mA cm−2. As we all know, the Voc of a DSC is the difference between the flatband potential of a semiconductor electrode (here is TiO2) and the redox potential of I−/I3− in the electrolyte. In this work, with the same photoanode, dye and electrolyte, the Voc might be considerably affected by the different redox potentials of I−/I3−, which should arise from different catalytic activities of the CEs.7 The higher Voc reflects the higher electrocatalytic activity of the ST-CE, which makes the redox potential of I−/I3− shift in the positive direction.7–9 Furthermore, the DSCs based on ST-CE showed a lower Jsc than that of DSCs based on Pt-CE. Three reasons might be responsible for it. One is the higher total internal series resistance caused by the thick catalyst layer, which is verified by EIS measurements (see Fig. 2c and Table 1). Futhermore, the non-transparent nature of the blackish thick ST-CE layer could not result in the similar light-reflection effect as Pt.10–12 The third might be the increased Nernst diffusion impedance of ST-CE derived from the thick catalyst layer.12,13
| Sample | V oc/V | J sc/mA cm−2 | FF/% | Eff./% | R s/Ω cm2 | R ct/Ω cm2 | Z N/Ω cm2 | J lim/mA cm−2 | J 0/mA cm−2 |
|---|---|---|---|---|---|---|---|---|---|
| ST-CE | 0.777 | 14.45 | 0.70 | 7.82 | 9.37 | 2.25 | 5.51 | 30.90 | 1.70 |
| Pt-CE | 0.695 | 17.06 | 0.68 | 8.11 | 2.22 | 1.33 | 0.25 | 34.67 | 2.14 |
To estimate the catalytic activities of ST-CE for the I−/I3− redox couple, cyclic voltammetry (CV) was performed in a three-electrode system. Fig. 2b shows the cyclic voltammograms of ST-CE and Pt-CE. The relative negative pair was assigned to the redox reaction eqn (1) and the positive one was assigned to the redox reaction eqn (2). In the case of Pt-CE, a typical curve with two pairs of redox peaks was obtained (Ox-1/Red-1, Ox-2/Red-2), which is verified by previous work.14 Obviously, the peaks of Ox-1 and Red-1 are key to our study because they are in charge of the reduction of I3− to I−.15 The value of the peak to peak separation (between Ox-1 and Red-1, Epp) is negatively correlated with the standard electrochemical rate constant of a redox reaction, which indicates the electrocatalytic activity of different CEs. It can be clearly seen that both ST-CE and Pt-CE show a similar profile and Epp, which means similar electrocatalytic activity. In addition, the current density of ST-CE (Ox-1/Red-1) is higher than that of Pt, also demonstrating superior catalytic activity.16
| I−3 + 2e− ↔ 3I− | (1) |
| 3I2 + 2e− ↔ 2I−3 | (2) |
Fig. 2c shows the typical Nyquist plots of the dummy cells based on identical CEs. The high frequency intercept on the real axis represents the series resistance (Rs). The semicircle at the left semi-circle (high frequency) region corresponds to the charge transfer resistance (Rct) and corresponding chemical capacitance at the electrode/electrolyte interface, while the right semi-circle (low frequency) region refers to the Nernst diffusion impedance (ZN) of the I−/I3− redox couple in the electrolyte. The EIS parameters were obtained by fitting EIS plots using an equivalent circuit shown in Fig. 2c (inset). The corresponding parameters were summarized in Table 1. It is clear that Pt-CE has the smaller Rs, Rct and ZN, which reflects the good bonding strength between Pt and the substrate, high catalytic activity for I−/I3− and fast diffusion of I−/I3− in the electrolyte, respectively. In the case of ST-CE, slightly higher Rs and Rct were observed, with larger ZN, which is tenfold of the value of Pt. Based on eqn (3),17,18 the ZN value is inversely proportional to the diffusion coefficient of I3− (D). A small ZN can be attributed to a high D which is always correlated with a high limiting current density (Jlim) according to eqn (4). This result was confirmed by Tafel-polarization measurement as shown Fig. 2d.
 | (3) |
 | (4) |

| (5) |
Fig. 2d shows the typical Tafel polarization curves of dummy cells, which exhibit the logarithmic current density (log![[thin space (1/6-em)]](https://www.rsc.org/images/entities/char_2009.gif) J) as a function of voltage. The exchange current density, J0, is obtained as the intercept of the extrapolated linear region of the curve when the overpotential is zero. The limiting diffusion current density (Jlim) can be obtained in the curve at high potential (horizontal part). The relevant parameters are also summarized in Table 1. As we all know, the J0 and Jlim are closely connected with the activity of the catalysts.14,19 The results revealed that ST-CE materials are highly efficient for reducing I3− to I−, which is as fast as Pt due to the similar J0 and Jlim. This is consistent with CV and EIS results according to eqn (4) and (5).
J) as a function of voltage. The exchange current density, J0, is obtained as the intercept of the extrapolated linear region of the curve when the overpotential is zero. The limiting diffusion current density (Jlim) can be obtained in the curve at high potential (horizontal part). The relevant parameters are also summarized in Table 1. As we all know, the J0 and Jlim are closely connected with the activity of the catalysts.14,19 The results revealed that ST-CE materials are highly efficient for reducing I3− to I−, which is as fast as Pt due to the similar J0 and Jlim. This is consistent with CV and EIS results according to eqn (4) and (5).
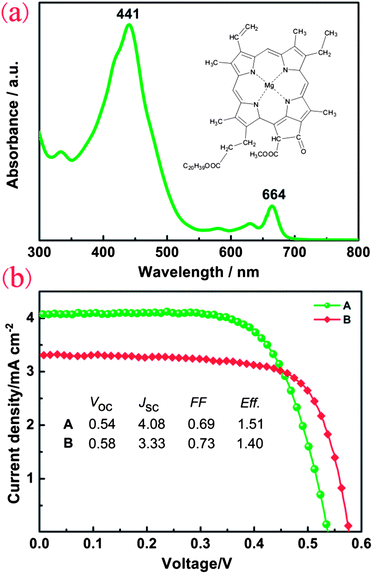
Furthermore, we extracted nature dye from ST (ST-dye). In order to understand the visible-light response of natural dye, the UV-Vis absorption spectrum was measured and shown in Fig. 3a. The ST-dye exhibits two absorption peaks with peak values of ca. 441 nm and 664 nm. The characteristic absorption peak of 664 nm could be assigned to chlorophyll A and the corresponding chemical structure has been shown in Fig. 3a. These values are consistent with previous results, finding characteristic absorption peaks of 663 nm and 645 nm for chlorophyll A and chlorophyll B, respectively.20,21 In Fig. 3b, the distinct J–V curves of two different combinations of DSCs are shown, where both DSCs are sensitized using unpurified ST-dye, one uses Pt-CE and the other selects ST-CE. The Voc, Jsc and FF measurements of the DSC using Pt-CE are 0.54 V, 4.08 mA cm−2 and 0.69, respectively, yielding a PCE of 1.51%. The all-natural DSC achieved a comparable efficiency of 1.40% with a slightly higher Voc of 0.58 V, Jsc of 3.33 mA cm−2 and FF of 0.73. Comparing with traditional synthetic dye-based DSCs, the narrow absorption of ST dye in the visible region as well as the weak bonding force between ST-dye and TiO2 should be responsible for the relatively low efficiency of the ST dye-based device.
 | ||
| Fig. 3 (a) The absorption spectrum of the ST extracts in ethanol solution. (b) The photovoltaic–current curves based on DSC A (ST-dye–electrolyte–Pt-CE) and B (ST-dye–electrolyte–ST-CE). | ||
To summarize, from a different perspective, the marine plant ST is multi-functional when used to fabricate organic/inorganic hybrid natural photovoltaic devices. Nature dye, iodide, as well as CE materials could be simultaneously obtained from ST. Impressively, the DSC based on ST-CE achieved a high PCE of 7.82%, which is comparable to the value of 8.11% PCE for the DSC using Pt-CE. In particular, the ST-based all-natural DSC achieved a comparable PCE of 1.40% to the 1.51% PCE of the Pt-based one. This novel way of using a natural material in a photovoltaic device not only impresses with excellent performance, but also with outstanding environmental benefits.
Acknowledgements
This work is supported by the National High Technology Research and Development Program for Advanced Materials of China (Grant no. 2009AA03Z220), National Natural Science Foundation of China (Grant no. 51273032), International Science & Technology Cooperation Program of China (Grant No. 2013DFA51000), the Fundamental Research Funds for the Central Universities (Grant No. DUT12RC(3)57), Doctoral Fund of Ministry of Education of China (Grant no. 20110041110003), and the Open Project Program of the State Key Laboratory of Physical Chemistry of Solid Surfaces, Xiamen University (201210). This research was also supported by the State Key Laboratory of Fine Chemicals of China.Notes and references
- B. O'Regan and M. Grätzel, Nature, 1991, 353, 737 CrossRef CAS
.
- G. Calogero, G. Di Marco, S. Cazzanti, S. Caramori, R. Argazzi, A. Di Carlo and C. A. Bignozzi, Int. J. Mol. Sci., 2010, 11, 254 CrossRef CAS PubMed
.
- H. Zhou, L. Wu, Y. Gao and T. Ma, J. Photochem. Photobiol., A, 2011, 219, 188 CrossRef CAS PubMed
.
- M. Wu, X. Lin, T. Wang, J. Qiu and T. Ma, Energy Environ. Sci., 2011, 4, 2308 CAS
.
- Q. Jiang, G. Li, F. Wang and X. Gao, Electrochem. Commun., 2010, 12, 924 CrossRef CAS PubMed
.
- M. K. Nazeeruddin, A. Kay, I. Rodicio, R. Humphry-Baker, E. Mueller, P. Liska, N. Vlachopoulos and M. Grätzel, J. Am. Chem. Soc., 1993, 115, 6382 CrossRef CAS
.
- G. Veerappan, W. Kwon and S. Rhee, J. Power Sources, 2011, 196, 10798–10805 CrossRef CAS PubMed
.
- K. Imoto, K. Takahashi, T. Yamaguchi, T. Komura, J. Nakamura and K. Murata, Sol. Energy Mater. Sol. Cells, 2003, 79, 459–469 CrossRef CAS
.
- L. Yi, Y. Liu, N. Yang, Z. Tang, H. Zhao, G. Ma, Z. Sua and D. Wang, Energy Environ. Sci., 2013, 6, 835–840 CAS
.
- T. N. Murakami, S. Ito, Q. Wang, Md. K. Nazeeruddin, T. Bessho, I. Cesar, P. Liska, R. H. Baker, P. Comte, P. Pechy and M. Grätzel, J. Electrochem. Soc., 2006, 153, A2255–A2261 CrossRef CAS PubMed
.
- M. Wang, A. M. Anghel, B. Marsan, N. C. Ha, N. Pootrakulchote, S. M. Zakeeruddin and M. Grätzel, J. Am. Chem. Soc., 2009, 131, 15976–15977 CrossRef CAS PubMed
.
- R. Jia, J. Chen, J. Zhao, J. Zheng, C. Song, L. Lia and Z. Zhu, J. Mater. Chem., 2010, 20, 10829–10834 RSC
.
- G. Veerappan, K. Bojan and S. Rhee, ACS Appl. Mater. Interfaces, 2011, 3, 857–862 CAS
.
- M. Wu, X. Lin, Y. Wang, L. Wang, W. Guo, D. Qi, X. Peng, A. Hagfeldt, M. Grätzel and T. Ma, J. Am. Chem. Soc., 2012, 134, 3419–3428 CrossRef CAS PubMed
.
- Z. Wang, F. Gong, X. Xu, Z. Li and G. Zhou, Chem. Commun., 2013, 49, 1437–1439 RSC
.
- Z. Huang, X. Liu, K. Li, D. Li, Y. Luo, H. Li, W. Song, L. Chen and Q. Meng, Electrochem. Commun., 2007, 9, 596–598 CrossRef CAS PubMed
.
- M. Wu, Y. Wang, X. Lin, N. Yu, L. Wang, L. Wang, A. Hagfeldt and T. Ma, Phys. Chem. Chem. Phys., 2011, 13, 19298–19301 RSC
.
- A. Hauch and A. Georg, Electrochim. Acta, 2001, 46, 3457–3466 CrossRef CAS
.
- M. Wang, A. M. Anghel, B. Marsan, N. L. Cevey Ha, N. Pootrakulchote, S. M. Zakeeruddin and M. Grätzel, J. Am. Chem. Soc., 2009, 131, 15976–15977 CrossRef CAS PubMed
.
- G. Mackinney, J. Biol. Chem., 1941, 140, 315–322 CAS
.
- W. P. Inskeep and P. R. Bloom, Plant Physiol., 1985, 77, 483–485 CrossRef CAS PubMed
.
Footnote |
| † Electronic supplementary information (ESI) available. See DOI: 10.1039/c3ee42767f |
| This journal is © The Royal Society of Chemistry 2014 |


