Synthesis factors affecting the catalytic performance and stability of Ru/C catalysts for supercritical water gasification
Received
6th May 2014
, Accepted 10th June 2014
First published on 10th June 2014
Abstract
Catalytic supercritical water gasification of isopropanol (450 °C, 30 MPa) over Ru/C catalysts was carried out in a fixed-bed plug flow reactor. In the absence of Ru, isopropanol decomposed to solid carbon (coke), and H2 over the carbon support. The Ru/C catalyst was able to gasify efficiently 10 wt% isopropanol over a period of 96 h at WHSVgRu = 1228 gOrg gRu−1 h−1 with the gas composition close to the calculated thermodynamic chemical equilibrium. The catalyst lifetime was affected by the decomposition of isopropanol to solid carbon (coke) over the carbon surface that progressively filled up the pores of the activated carbon and this resulted in a covering of the Ru nanoparticles (NPs). The Ru dispersion (D) was found to be a relevant parameter. The 0.5% Ru/C (D = 0.26) was more active than the 2% Ru/C (D = 0.14). The influence of the solvent (acetone vs. water) used during the catalyst impregnation was studied and the turnover frequency (TOF) was twice as high for the Ru/C catalyst prepared with acetone. The higher Ru dispersion and the lower content of residual chloride obtained for the catalyst prepared with acetone were both responsible.
Introduction
Catalytic supercritical water gasification (CSCWG) is a technology under development for converting biomass into gaseous biofuels (such as H2 and CH4). In contrast to supercritical water gasification (SCWG) performed at high temperatures (>600 °C) where close to full conversion of biomass into a H2-rich product gas can be achieved without catalysts, CSCWG is carried out at low to moderate temperatures (ca. 400 °C). At these conditions, in order to achieve full biomass conversion and a high selectivity towards H2 or CH4, a catalyst is needed for decomposing the large organic molecules by C–C bond cleavage.1 For H2 production, Pt is reported to have a good catalytic performance in terms of activity and selectivity for CSCWG of methanol, ethanol, and ethylene glycol.2 An optimal catalyst for enhancing H2 formation should have a high activity for C–C bond cleavage, favor the water gas shift reaction (CO + H2O → H2 + CO2) for an increased H2 yield, as well as minimize the methanation reaction (COx + (2 + x)H2 → CH4 + xH2O). In contrast, for CH4 production, the catalyst should enhance the methanation reaction, besides C–C bond cleavage and water gas shift activity. Ru has been found to be the most active and selective metal towards CH4 formation by facilitating also the C–O bond cleavage.3 Previous work4 has already shown the good catalytic performance of a commercial Ru/C catalyst for CSCWG of synthetic liquefied wood (SLW) over a period of 220 h as well as its high CH4 selectivity. Most of the CSCWG studies4–22 performed in continuous mode have been carried out with water-soluble model compounds such as glycerol, sorbitol, ethylene glycol, cresol, phenol, and glucose. Among these water-soluble compounds organic acids and alcohols have a greater relevance due to their presence as intermediate products during SCWG of real biomass and their relatively good stability in supercritical water (SCW).23 Carboxylic acid compounds are potentially more problematic to gasify than alcohols because they may form coke precursors decreasing the catalyst lifetime. De Vlieger et al.2 observed that reforming of acetic acid over Pt/Al2O3 catalysts at 275 °C and 25 MPa led to a fast catalyst deactivation within 3 h due to coke deposition on the catalyst surface while no deactivation was observed when reforming alcohols (methanol, ethanol) during 5 h of CSCWG. Dreher et al.24 have also reported the decrease of the catalyst lifetime after 3 h on-stream when gasifying 21 wt% acetic acid over a 2% Ru/C catalyst at 390 °C and 25 MPa. It was suggested that the polymerization rate of acetic acid dominated the overall gasification rate at subcritical conditions leading to coke deposition on the catalyst. Recently, De Vlieger et al.25 found out that a carbon nanotube (CNT) supported Ru catalyst was stable during reforming of acetic acid at 270 °C and 23 MPa and also at 400 °C and 25 MPa, while in the subcritical region (340 °C, 23 MPa) a fast deactivation was observed. The high ionic product (Kw) at subcritical conditions was the cause for the catalytic deactivation observed. In this work, for minimizing any fast catalyst deactivation caused by coke deposits, isopropanol as a model compound is used. Due to the harsh conditions of SCW, only a few catalyst supports were reported to be stable like rutile-TiO2, α-Al2O3, ZrO2 and carbon.5,26 Here, the motivation for using carbon is mainly due to its higher specific surface area (>500 m2 g−1) compared to metal oxides (<150 m2 g−1) allowing for a higher Ru dispersion. In addition, carbon has other advantages like a high resistance to acidic and basic media, a good stability at high temperature and in aqueous media, the possibility to modify its chemical surface properties by adding anchoring groups, the recovering of the active phase of the used catalyst after reaction by combustion (crucial if the active phase is a noble metal), and a low price. The severe conditions of SCW imply the use of a stable Ru/C catalyst having a high activity and selectivity towards CH4. We studied first the stability of the physical structure of the carbon support in SCW conditions in order to assess its potential to be used as a catalyst support. Secondly, we studied the catalytic performances of the Ru/C catalysts by operating at low and high weight hourly space velocity. The Ru dispersion effect was assessed by preparing two catalysts with different Ru loadings, i.e. 0.5 wt% and 2 wt% Ru, respectively. Finally, the effect of the solvent (water vs. acetone) used during catalyst impregnation was also investigated.
Experimental section
Catalyst preparation and characterization
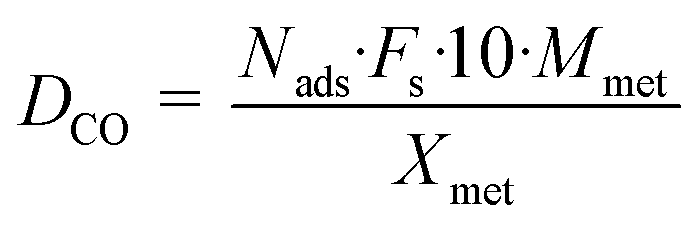
A granular carbon material (denoted here as Org10_CO from Desotec) was sieved to a size fraction of 0.3–0.8 mm. The carbon support was impregnated with RuCl3·xH2O as the salt precursor (99.9%, Alfa Aesar) in a water (Ru/Cw) or in an acetone (Ru/Ca) solution for 24 h, followed by solvent evaporation in a rotary evaporator and washed with pure water during filtration. ICP-OES (Liberty 110, Varian) measurements of the filtrate were undertaken to detect any Ru loss during washing. After drying in an oven at 90 °C overnight, the catalyst was reduced under flowing H2 (20 mL min−1) at 450 °C during 4 h for chloride removal. Two different Ru loadings were prepared: 0.5 and 2 wt% Ru from a water or acetone solution containing the dissolved ruthenium precursor. The Ru loading was determined by measuring the dissolved Ru concentration in the solution before and after impregnation by ICP-OES, taking into account Ru losses during catalyst washing. The catalysts were characterized by H2-temperature-programmed reduction (H2-TPR) and CO pulse chemisorption in a fully automated instrument (TPD/R/O 1100, Thermo Scientific) connected to a TCD and to a mass spectrometer (GAM 400). For each H2-TPR measurement, 0.1 g of sample was weighted and heated (10 °C min−1) from room temperature (RT) to 350 °C under flowing Ar (20 mL min−1) and then kept at this temperature for 30 min to remove impurities and water. Then the sample was cooled to RT and passivated with O2/He (5![[thin space (1/6-em)]](https://www.rsc.org/images/entities/char_2009.gif) :95, 20 mL min−1) at 100 °C for 30 min. Finally, the sample was cooled to RT again and the gas was switched to H2/Ar (10:90, 20 mL min−1). TPR was performed from RT to 450 °C with a temperature ramp of 10 °C min−1. For the CO pulse chemisorption, the sample was reduced under H2/Ar (10:90, 20 mL min−1) at 450 °C for 4 h in order to clean the ruthenium surface from any deposited carbon species. Then it was flushed with pure He at 450 °C for 1.5 h to remove H2 from the catalyst and finally cooled down to RT. The CO pulses were carried out with CO/He (20:80) at RT. The dispersion was calculated by assuming 1 as the stoichiometric factor for CO:Ru. The following formula was used for determining the Ru dispersion:
:95, 20 mL min−1) at 100 °C for 30 min. Finally, the sample was cooled to RT again and the gas was switched to H2/Ar (10:90, 20 mL min−1). TPR was performed from RT to 450 °C with a temperature ramp of 10 °C min−1. For the CO pulse chemisorption, the sample was reduced under H2/Ar (10:90, 20 mL min−1) at 450 °C for 4 h in order to clean the ruthenium surface from any deposited carbon species. Then it was flushed with pure He at 450 °C for 1.5 h to remove H2 from the catalyst and finally cooled down to RT. The CO pulses were carried out with CO/He (20:80) at RT. The dispersion was calculated by assuming 1 as the stoichiometric factor for CO:Ru. The following formula was used for determining the Ru dispersion:| | 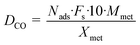 | (1) |
where Nads is the amount of gas adsorbed during pulse chemisorption (mmol g−1); Fs corresponds to the stoichiometric factor (moles of metal/moles of gas); Mmet is the metal atomic weight (g mol−1) and Xmet is the metal loading on a mass basis (wt%). The average metal particle sizes were calculated as:| | 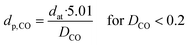 | (2) |
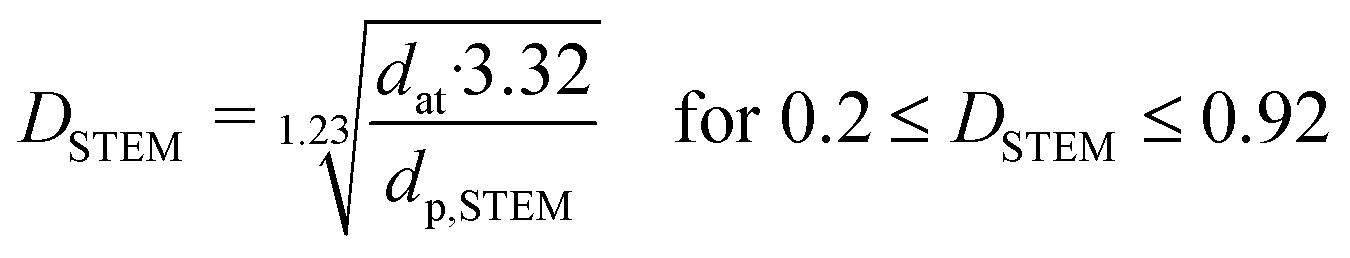
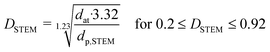
where dat is the atomic diameter of Ru (dat = 2.6 Å).27 N2-physisorption measurements were performed with an Autosorb-1 (Quantachrome Instruments) for determining the porosity and the BET specific surface area (BET SSA). The total pore volume was measured at p/p0 = 0.99 and the mesopore volume with the t-plot method. Prior to N2-physisorption degassing under He at 300 °C for 6 h was carried out for all the samples. The Ru NPs were characterized by Scanning Transmission Electron Microscopy (STEM). The measurements were performed with an aberration corrected dedicated STEM microscope (Hitachi HD-2700 CS), operated at an acceleration voltage of 200 kV and equipped with a high angle annular dark field (HAADF) detector. For each sample, different areas were carefully selected in order to have a reliable representation of the average Ru NPs size. The average Ru NPs size and the dispersion (DSTEM) were calculated as:| | 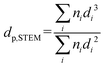 | (3) |
| |  | (4) |
where ni is the number of particles with diameter di.27 Thermogravimetric analysis (TGA) was conducted in a thermogravimetric analyzer (TGA; NETZSCH STA 449 C). 0.01 g of sample was loaded and heated from RT to 110 °C under Ar atmosphere for 30 min and then heated up to 900 °C at 10 °C min−1 under flowing O2/Ar (10:90, 10 mL min−1). CNS elemental analysis was performed with an elemental analyzer (Vario EL cube, Elementar). X-ray Photoelectron Spectroscopy (XPS) was carried out with a VG Escalab 220i XL apparatus by using a monochromatic Al Kα (hν = 1486.6 eV) radiation as the X-ray source.
Experimental setup
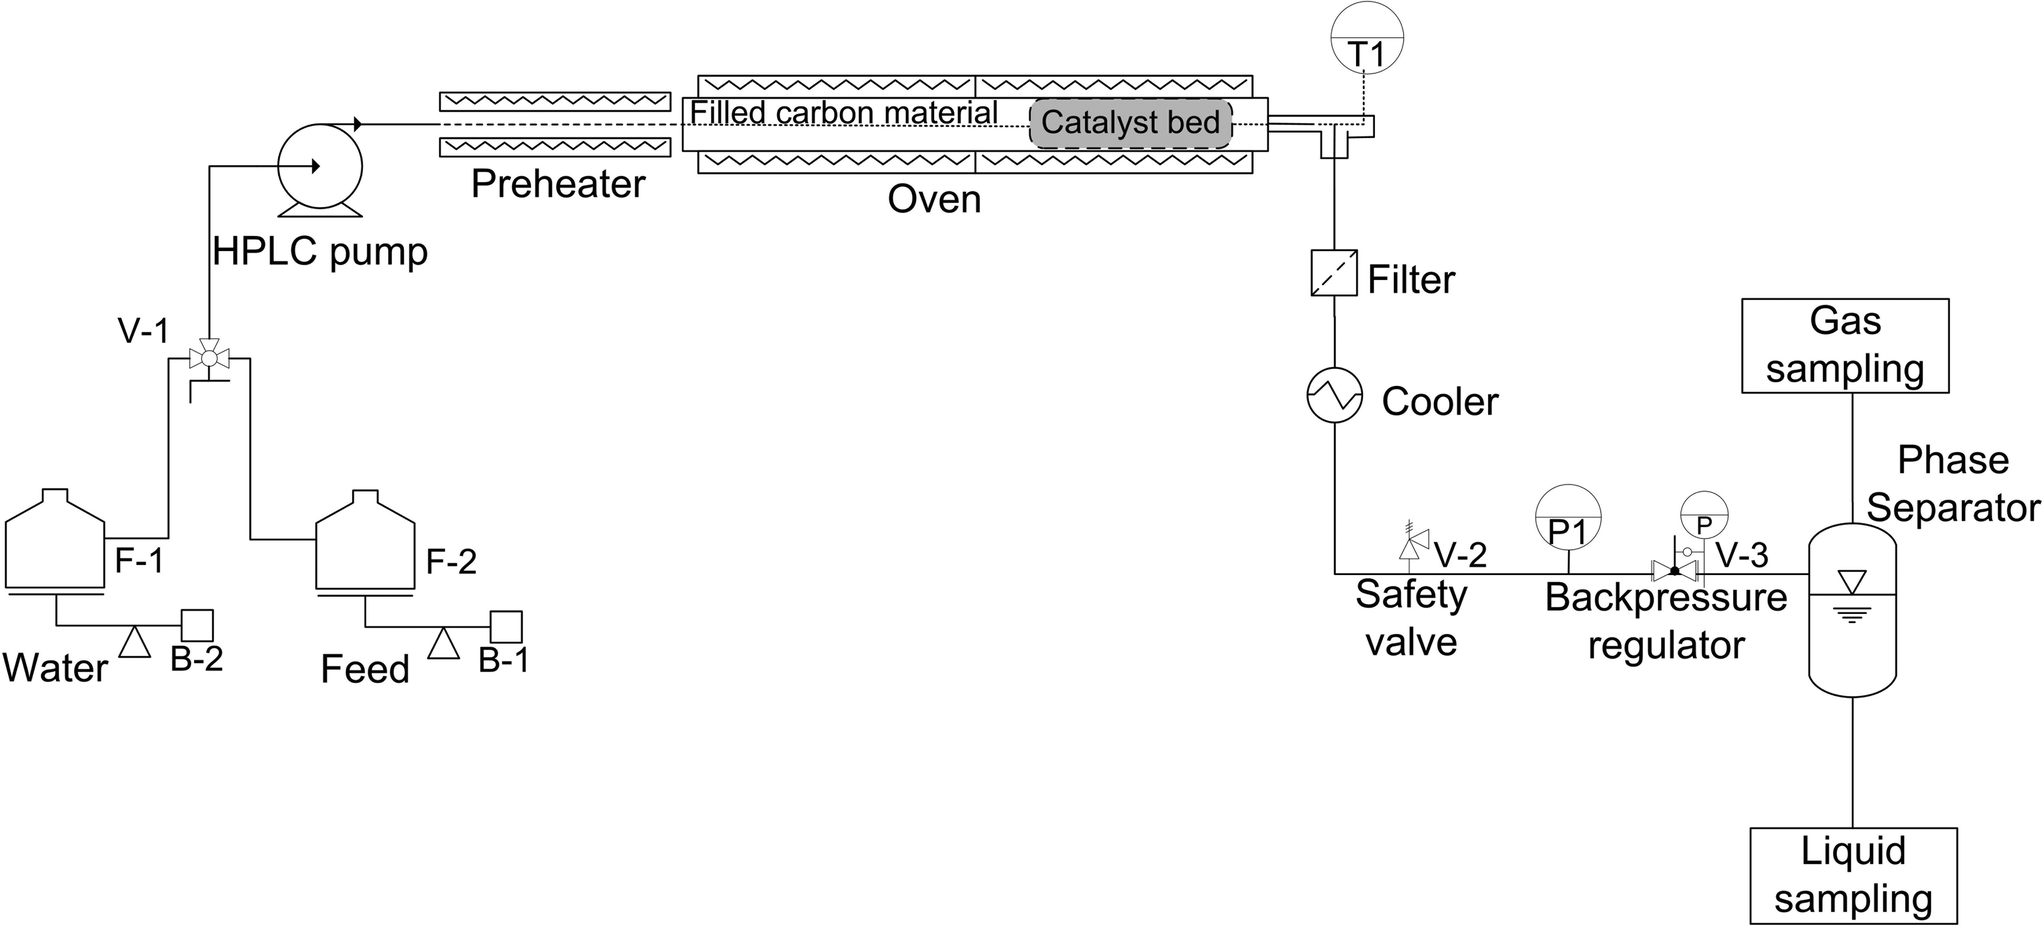
The physical structure stability of the carbon support in SCW conditions was assessed with an unstirred stainless steel mini-batch reactor (HIP, 316 SS) having a volume of 5 mL. 0.5 g of the carbon support was filled with 1.5 g of water into the reactor. Then, it was tightly closed and placed into a fluidized sand bath (Techne SBL-2D) to be heated up to 420 °C under 35 MPa for 5 h. After cooling, the carbon support was recovered by filtration and dried at 110 °C overnight. A second run of 5 h following the same procedure was undertaken in order to reach 10 h of SCW treatment. CSCWG experiments of isopropanol were carried out in a fixed-bed plug flow (PF) reactor (see Fig. 1). The feed (F-2) and the water (F-1) were pumped by an HPLC pump (Waters 515) at a constant mass flow rate (F = 3 g min−1). For accurate mass flow rate measurements, the feed tank was put on an analytical balance (Mettler Toledo PG6002-S). A manual valve (V-1) allowed switching from the water to the feed effluent. A preheater was needed for assuring isothermal conditions along the catalyst bed. The PF reactor consisted of a stainless steel tube (SITEC) with a length of 40 cm, internal diameter of 0.8 cm (total Vreactor = 20 mL). The catalyst loading was around 0.15–0.6 g depending on the experiment. The first 35 cm of the reactor were filled with a carbon material (0.8 < diameter < 2 mm). A movable thermocouple (T1) was installed within the reactor for recording temperature during CSCWG. The PF reactor was placed in an electric oven for heating. The reactor effluent passed through a metal filter (2 μm) to retain any solid particles. The fluid was cooled down by passing through a water tank. A safety valve (V-2) was installed for preventing any overpressure in the system. The pressure in the system was maintained by a backpressure regulator (V-3). Finally, the gas and the liquid were separated at ambient conditions in a phase separator made of glass. The gas was collected in a sample bag (3L SKC) at different time intervals and analyzed by gas chromatography. The liquid samples were stored in 40 mL flasks and analyzed off-line with a TOC analyzer. The temperature (T1) and the pressure (P1) were recorded continuously with a computer using LabView.
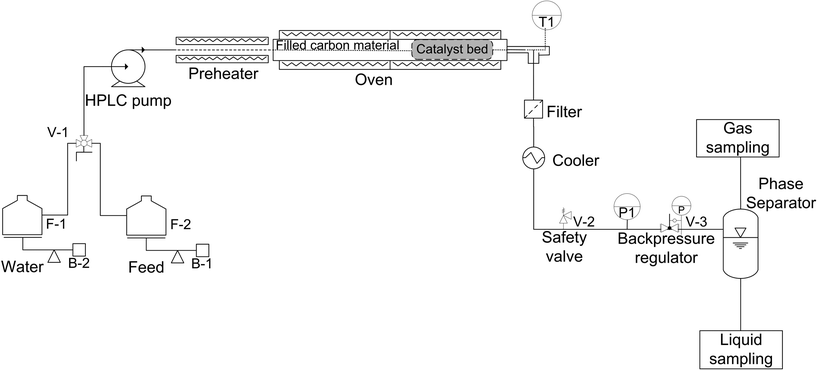 |
| | Fig. 1 Schematic of the fixed-bed plug flow reactor setup for continuous CSCWG. | |
Analytical methods for the gaseous and liquid effluents
The gas phase was analyzed off-line with a gas chromatograph (HP 6890, columns: HP-Plot Q 30 m × 0.53 mm × 40 μm and HP-Plot Molecular Sieve 5A, 30 m × 0.53 mm × 40 μm) with helium as the carrier gas using a Thermal Conductivity Detector (TCD) to detect CO2, CH4, CO, and H2 and a Flame Ionization Detector (FID) for higher hydrocarbons (C2H6 and C3Hx). The liquid samples were collected manually at regular intervals, and their total organic carbon (TOC) content was measured with a TOC analyzer (Elementar). The liquid samples were also analyzed by GC-MS (Agilent 5975C).
Chemical equilibrium composition
The thermodynamic chemical equilibrium calculation was performed using the Aspen Plus® simulation package by using the Peng–Robinson equation of state. The values for the gas composition at the thermodynamic chemical equilibrium (450 °C, 30 MPa and 10 wt% isopropanol) are: CO2 = 24.7 vol%; CH4 = 65.6 vol%; H2 = 8.7 vol%; CO = 0.7 vol%.
Terms and definitions
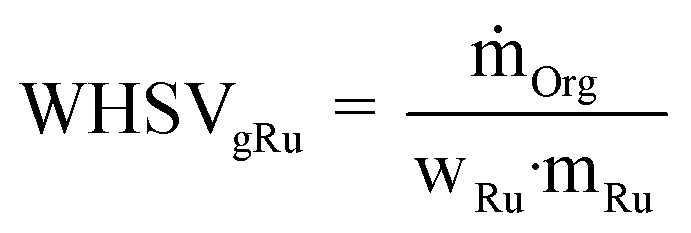
For comparing the catalytic performances based on the Ru amount, the weight hourly space velocity normalized to one gram of Ru (WHSVgRu) is used:| | 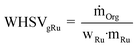 | (5) |
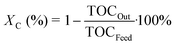
The observed activity is defined as the total organic carbon conversion (Xc) from the feed to the liquid effluent:
| |  | (6) |
The carbon gasification efficiency (GEC) is the relation between the total amount of carbon in the gas phase and the total amount of carbon in the feed, defined as:
| |  | (7) |
The rate of coke deposition (RCoke dep.) is calculated from a carbon mass balance as follows:
| |  | (8) |
The observed turnover frequency (TOF) was calculated as the total mole of isopropanol consumed per surface Ru site (measured by STEM) per second:
| |  | (9) |
Results and discussion
Physical structure stability of the carbon support in SCW
Prior to active phase impregnation, it is necessary to ensure the good physical structure stability of the carbon support in order to prevent any activity loss due to its structure collapsing. To this aim its physical structure stability was tested at SCW conditions in a mini-batch reactor at 420 °C and 35 MPa for 5 and 10 h. As shown in Table 1, the physical structure of the carbon support after 5 and 10 h in SCW conditions was relatively well preserved. Some slight modifications of the meso/micropore volume can be observed suggesting that the SCW caused more micropores and less mesopores. The increase of the micropore volume in SCW was likely due to the removal of some impurities trapped in the micropores. We can also appreciate the high specific surface area (>700 m2 g−1) of this material. In comparison with refractory metal oxides like α-Al2O3, rutile-TiO2 or ZrO2, which were reported26,28–30 to be stable in SCW conditions, their specific surface area is much lower and does not exceed 150 m2 g−1. Thus, the potential for achieving highly dispersed Ru NPs on the carbon support appears to be much higher.
Table 1 Physical structure evolution of the carbon support at SCW conditions (420 °C, 35 MPa)
| Sample |
BET SSA [m2 g−1] |
V
mesop. [cm3 g−1] |
V
microp. [cm3 g−1] |
| Fresh C |
802 |
0.69 |
0.14 |
| After 5 h in SCW |
779 |
0.56 |
0.18 |
| After 10 h in SCW |
717 |
0.45 |
0.17 |
Catalyst characterization results
The characteristics of the Ru/C catalysts are presented in Table 2.
Table 2 Characteristics of the fresh Ru/C catalysts
| Sample |
BET SSA [m2 g−1] |
V
mesop. [cm3 g−1] |
V
microp. [cm3 g−1] |
Ru loading [wt%] |
H2 consumptiona [μmol g−1] |
D
CO
[—] |
D
STEM
[—] |
d
p,CO
[nm] |
d
p,STEM
[nm] |
|
Determined from H2-TPR.
Determined by CO pulse chemisorption.
Determined by STEM.
|
| Fresh C |
802 |
0.69 |
0.14 |
0 |
0 |
N.A. |
N.A. |
N.A. |
N.A. |
| 0.5% Ru/Cw |
765 |
0.75 |
0.13 |
0.6 |
3.5 |
0.12 |
0.26 |
11 |
5 ± 1.2 |
| 2% Ru/Cw |
737 |
0.73 |
0.11 |
2.3 |
32.0 |
0.08 |
0.14 |
16 |
10 ± 2.7 |
| 2% Ru/Ca |
619 |
0.54 |
0.11 |
2.1 |
46.6 |
0.11 |
0.35 |
12 |
3 ± 0.6 |
The specific surface area was affected by the impregnation with Ru and was found to decrease with the Ru loading for the Ru/Cw catalysts. A higher Ru loading led to a larger Ru NP size, which reduced the pore volume and the specific surface area. The Ru NPs cannot be located inside the micropores because the micropores are too small (<2 nm) for the Ru NPs. The fact that the micropore volume decreases slightly after impregnation could be due to the blockage of the entrance of some of the micropores. The decrease of the mesopore volume of the 2% Ru/Ca suggests that some Ru NPs are located in the mesopores, whereas the conservation of the mesopore volume of the 0.5% Ru/Cw and 2% Ru/Cw indicates that the Ru NPs are rather in the macropores. In Fig. 2, the Ru NPs for the 0.5% Ru/Cw, 2% Ru/Cw, and 2% Ru/Ca catalysts are shown, the white dots correspond to the Ru NPs. According to the CO pulse chemisorption and the STEM measurements, the use of acetone is more favorable for achieving a better Ru dispersion. By looking at the histograms of the particle sizes, the Ru/C catalysts prepared with water exhibit a much broader Ru NPs size distribution proving thus the advantage of using acetone during the catalyst preparation in order to obtain a narrow distribution. As mentioned elsewhere31 acetone favors a higher interaction between RuCl3 and the hydrophobic surface of carbon during the impregnation leading to a higher Ru dispersion.
 |
| | Fig. 2 HAADF-STEM images of the (a) 0.5% Ru/Cw, (b) 2% Ru/Cw, and (c) 2% Ru/Ca catalysts. | |
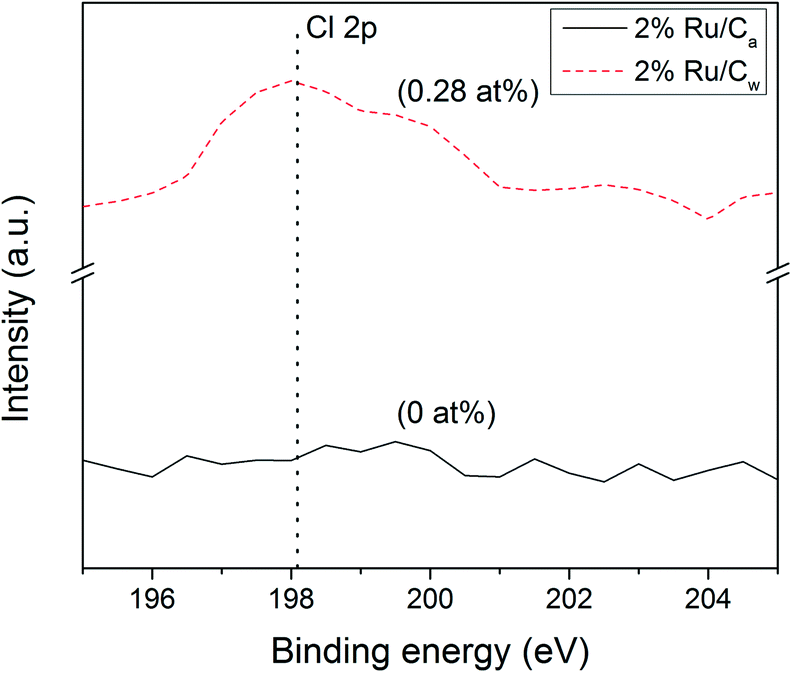
Interestingly, the Ru NPs size values obtained by CO pulse chemisorption have been overestimated (by 6–9 nm) for all the catalysts. As an explanation the presence of residual chloride coming from the salt precursor (RuCl3) may be the cause. It is also known32,33 that residual chloride reduces the CO adsorption capacity of the catalyst by poisoning the surface of the Ru NPs. As illustrated in Fig. 3, some residual chloride species were detected on the 2% Ru/Cw (0.28 at%) by XPS, while no chloride species were found on the 2% Ru/Ca. Yin et al.31 have also observed that the Ru/C catalysts prepared with acetone resulted in a lower concentration of residual chloride in comparison to the catalysts prepared with water. According to them, water enhances the anchoring of residual chloride on the carbon support during the catalyst preparation.
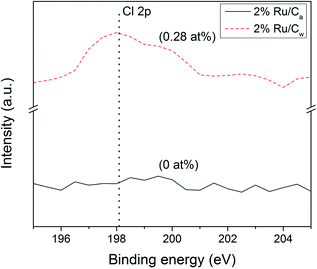 |
| | Fig. 3 Cl 2p (198.1 eV) XPS patterns of 2% Ru/Cw and 2% Ru/Ca catalysts. | |
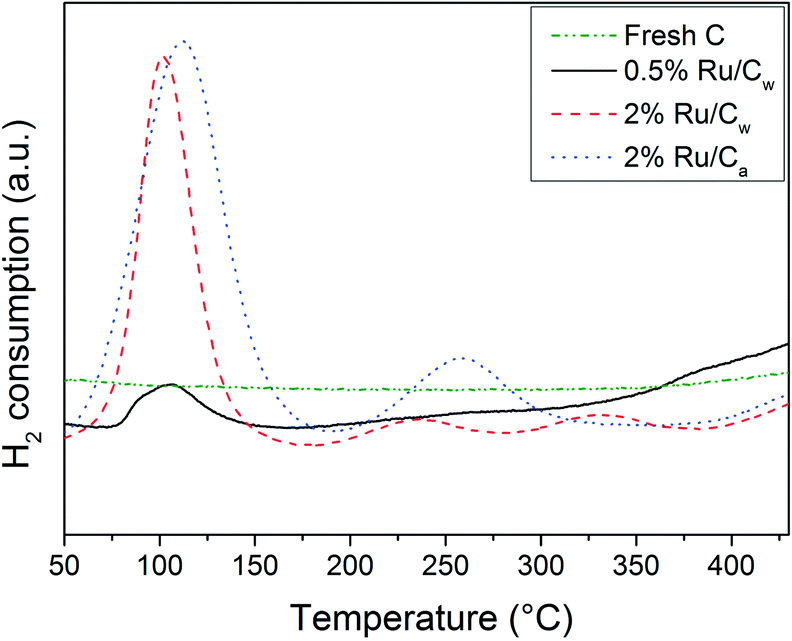
In Fig. 4, the H2-TPR results show a first reduction peak at ca. 100–110 °C corresponding to the reduction of RuO2 to Ru0 as reported by Rossetti et al.34 The reduction peak for the catalysts prepared with water is slightly lower (104 °C) than for the one prepared with acetone (111 °C). Yin et al.31 have also observed this shift to higher temperature when using acetone. According to them, the use of acetone renders the reduction of the precursor more difficult. Their explanation is a higher interaction between RuO2 and the carbon support. The lower H2 consumption for the 2% Ru/Cw in comparison to the 2% Ru/Ca was likely due to the higher Ru dispersion for the catalyst prepared with acetone. On the other hand, the presence of residual chloride on the Ru/Cw catalysts can also explain the lower H2 consumption as mentioned by Guerrero-Ruiz et al.35 About the other peaks around 240 °C, 260 °C, 330 °C, and 440 °C, MS analysis has identified CH4 formation suggesting hydrogenation of carbon oxides (surface functional groups) to CH4 or of other weakly bonded carbon species.35 The reduction of theses carbon oxides/surface species is supposed to occur in the vicinity of the Ru NPs because both the hydrogen dissociation and the hydrogenation are catalyzed by Ru. These additional reduction peaks are absent for the 0.5% Ru/Cw due to the low amount of Ru.
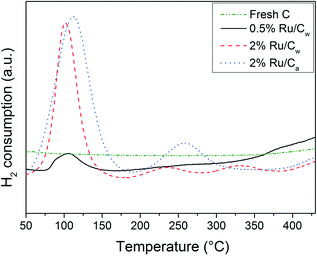 |
| | Fig. 4 H2-TPR profiles of the fresh C, 0.5% Ru/Cw, 2% Ru/Cw, and 2% Ru/Ca catalysts. | |
Blank SCWG experiment
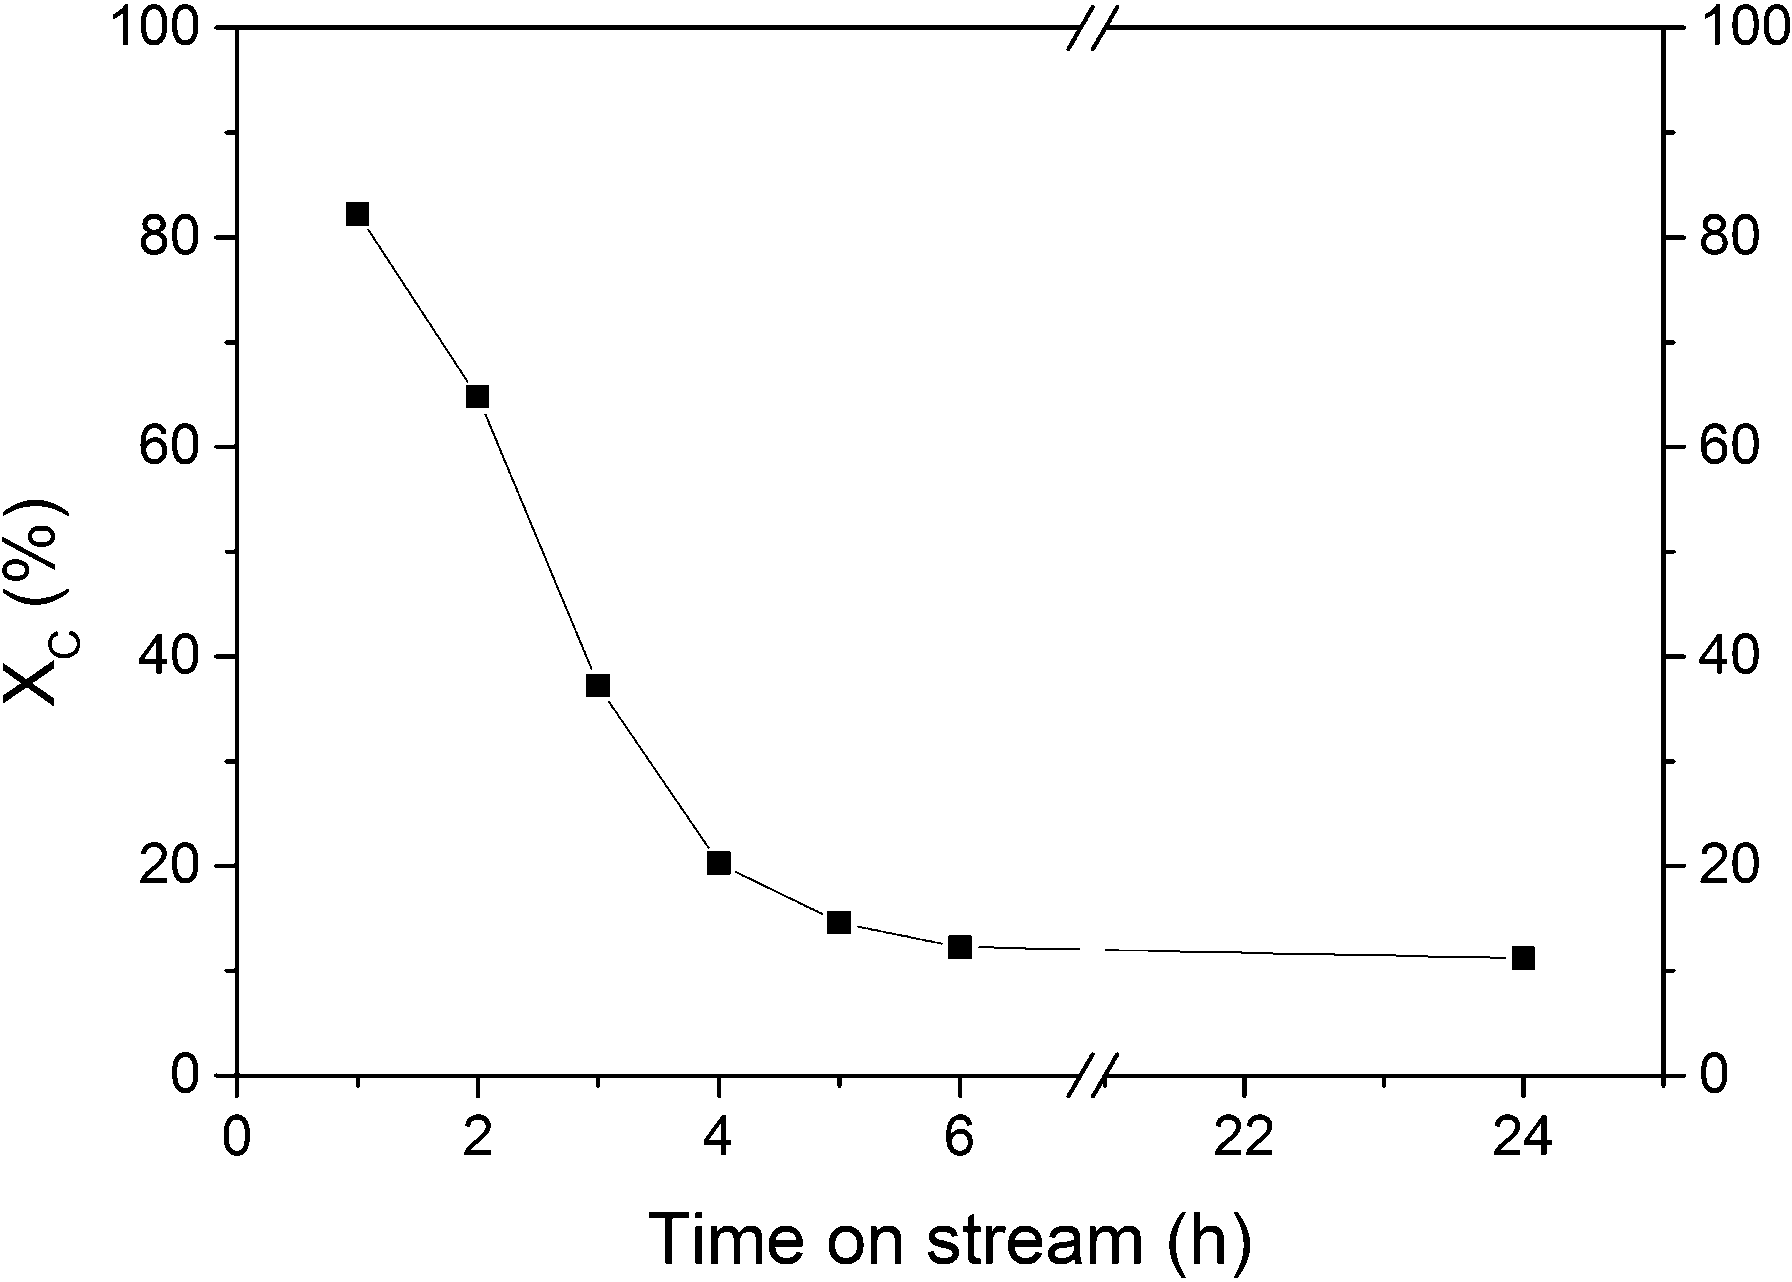
The first SCWG experiment aimed at assessing the stability of isopropanol under SCW conditions in the absence of a catalyst as well as at checking the catalytic activity of the reactor wall. A blank experiment with an empty reactor was carried out at 450 °C and 30 MPa and a residence time of 59 s (density of water at reaction conditions is 148 g L−1). The total organic carbon conversion (XC) was close to zero, and no gas production was measured indicating the inertness of the reactor wall as well as the stability of isopropanol at these conditions. GC-MS analysis confirmed that isopropanol was stable since no decomposition products were found. For the next experiment, the reactor was filled only with the support carbon material in order to check its activity during SCWG. According to Fig. 5, XC decreased steadily from 82% to 12% during the first 6 h of gasification. Such a high initial activity of the carbon support was not expected. In Table 3, the results of the SCWG after 24 h are summarized.
 |
| | Fig. 5 SCWG of 10 wt% isopropanol over the carbon support material at 450 °C and 30 MPa during 24 h on-stream with F = 3 g min−1. | |
Table 3 Results of the SCWG of 10 wt% isopropanol over the neat carbon support material performed at 450 °C and 30 MPa during 24 h with F = 3 g min−1
| Sample |
Time [h] |
X
c [%] |
GEc [%] |
R
Coke dep. [mmol C min−1] |
Gas composition [vol%] |
| CH4 |
CO2 |
H2 |
CO |
C2H6 |
C3Hx |
| Fresh C |
24 |
11 |
4 |
1.2 |
3.3 |
0.5 |
96 |
0.2 |
<0.1 |
5 |
The absence of high concentrations of CO (and CO2) indicates that the C–O bond in isopropanol is efficiently broken. The low methane concentration shows that the methanation reaction is not favored in the absence of the catalyst, and the presence of C3Hx indicates that isopropanol lost its hydroxyl group by reacting with the carbon surface. Interestingly, the carbon gasification efficiency (GEC) was much lower than XC, meaning that the carbon contained in the feed was only partially converted to the gas phase. Based on the GEC and XC values after 24 h on-stream, a carbon accumulation of ca. 1.2 mmol C min−1 has been calculated. Thus a plausible explanation of the observed trend in activity is that the isopropanol decomposed to H2, water, and solid carbon (coke) on the surface of the carbon support, whose pores were progressively filled up by the coke, thereby reducing the activity of the support. Unlike carboxylic acid compounds which tend to polymerize before reaching the active phase leading to catalyst deactivation,24 it seems that isopropanol underwent decomposition on the catalyst support itself. The liquid effluent was analyzed by GC-MS and the result showed that isopropanol was the main product in the liquid phase. However, the presence of a small amount of benzene was recorded. Chakinala et al.23 have studied the conversion of 1-propanol at SCW conditions (600 °C, 25 MPa) in a batch reactor for 15 min and also observed the formation of a small quantity of benzene, confirming the occurrence of aromatization reactions. In summary the carbon surface was active enough for decomposing isopropanol to coke and H2, likely due to impurities and/or surface functional groups.
In Table 4, it can be seen that the absence of Ru led to a complete loss of the microporosity as well as a considerable loss of the mesoporosity after 24 h. These results are relevant because they show that if isopropanol cannot be entirely converted to gaseous products, it reacts with the carbon surface to form coke resulting in a drastic loss of the porosity. The fact that also the mesopores are affected by coke formation means that the coke is likely to deposit also on the Ru NPs, which would lead to the deactivation of the catalyst.
Table 4 Physical structure evolution of the carbon support after 24 h of SCWG with 10 wt% isopropanol (450 °C, 30 MPa)
| Sample |
BET SSA [m2 g−1] |
V
mesop. [cm3 g−1] |
V
microp. [cm3 g−1] |
| Fresh C |
802 |
0.69 |
0.14 |
| C after SCWG |
84 |
0.21 |
0 |
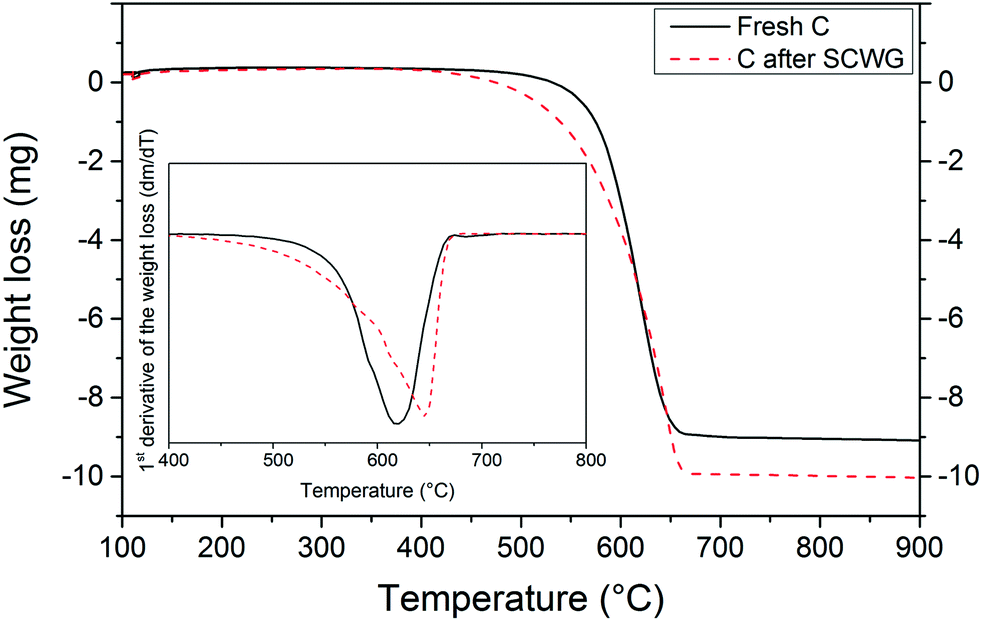
A TGA study was carried out in order to confirm the presence of coke deposits after SCWG with isopropanol. As shown in Fig. 6, the carbon support after SCWG of isopropanol started to oxidize at a lower temperature (400 °C) than the fresh carbon support (500 °C). These results, although not very conclusive, support the presence of less thermally stable carbon species (i.e. coke deposits) on the used carbon support after SCWG of isopropanol. The carbon support appears to be more thermally resistant after the SCWG treatment since the maximum consumption peak was shifted from 620 °C to 645 °C. The removal of –CH2 and –CH groups during the SCWG treatment might be the reason for the enhancement of the thermal resistance of the support.36 A diminution of the amount of ash was also observed in the TGA. At 900 °C, the weight loss of the fresh carbon support remained constant at 9 mg meaning that 1 mg of ash remained, whereas for the used carbon the remaining ash was only 0.2 mg.
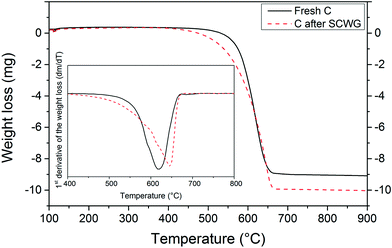 |
| | Fig. 6 TGA and DTA study of the fresh carbon support and of the carbon support after SCWG with 10 wt% isopropanol (450 °C, 30 MPa). Initial sample mass was 10 mg for both samples. | |
Finally, as shown in Table 5, the CNS elemental analysis of the carbon support confirmed the presence of additional carbon after SCWG, while nitrogen and sulfur content remained both constant.
Table 5 CNS elemental analysis of the fresh carbon support and of the carbon support after SCWG with 10 wt% isopropanol (450 °C, 30 MPa)
| Sample |
C [wt%] |
N [wt%] |
S [wt%] |
| Fresh C |
68 ± 2 |
0.41 ± 0.01 |
0.24 ± 0.02 |
| C after SCWG |
85 ± 1 |
0.43 ± 0.02 |
0.26 ± 0.04 |
To explain these results we propose a decomposition of isopropanol on the surface of the support to form elemental carbon (“coke”), H2, and water according to:
Thus, the average carbon content of the support after SCWG of isopropanol would increase, as shown in Table 5. The measured gas composition, i.e. 96 vol% H2, further supports this hypothesis (see Table 3).
CSCWG over Ru/C catalysts
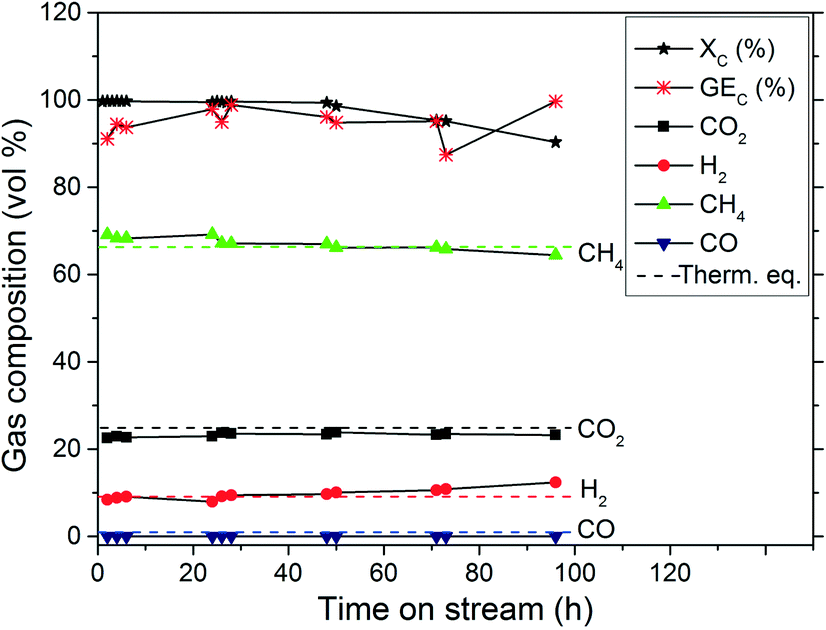
The CSCWG experiments aim at assessing the catalytic performance of the Ru/C catalysts. In Fig. 7, CSCWG of 10 wt% isopropanol over the 2% Ru/Ca catalyst is presented. During the first hours on-stream the liquid effluent was collected in order to detect any leaching of Ru. The analysis of the effluent by ICP-OES did not reveal any Ru showing the strong interaction between the carbon support and Ru. At a relatively low weight hourly space velocity (1228 gOrg gRu−1 h−1), the observed total carbon conversion was 99% during the first 28 h and began slowly to decrease to 90% after 96 h of CSCWG. However, as illustrated in Table 6, even at XC = 90% the gas composition was close to the thermodynamic chemical equilibrium. GEC was similar to XC proving that all the carbon contained in the feed was fully converted to the gas phase with no noticeable coke deposition within the reactor (RCoke dep. ≈ 0). Nevertheless, it is worth noting that GEC values are less accurate than XC values obtained by TOC analysis. The main reasons are that gas flow rate measurements are not always accurate due to some gas accumulation inside the setup, and fluctuations of the mass flow rate. As a consequence, the observed activity is calculated solely from XC in this work.
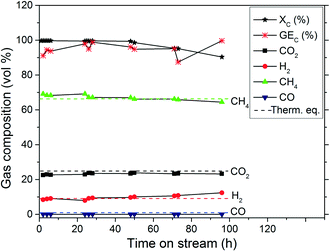 |
| | Fig. 7 CSCWG of 10 wt% isopropanol over the 2% Ru/Ca catalyst at 450 °C and 30 MPa for 96 h on-stream with WHSVgRu = 1228 gOrg gRu−1 h−1. The dashed lines denote the calculated thermodynamic equilibrium concentrations. | |
Table 6 Results summary after 96 h of CSCWG with 10 wt% isopropanol over the 2% Ru/Ca catalyst at 450 °C and 30 MPa with WHSVgRu = 1228 gOrg gRu−1 h−1
| Catalyst |
Time [h] |
X
c [%] |
GEc [%] |
R
Coke dep. [mmol C min−1] |
Gas composition [vol%] |
| CH4 |
CO2 |
H2 |
CO |
C2H6 |
C3Hx |
| 2% Ru/Ca |
96 |
90 |
100 |
≈0 |
64.4 |
23.2 |
12.4 |
<0.1 |
<0.1 |
<0.1 |
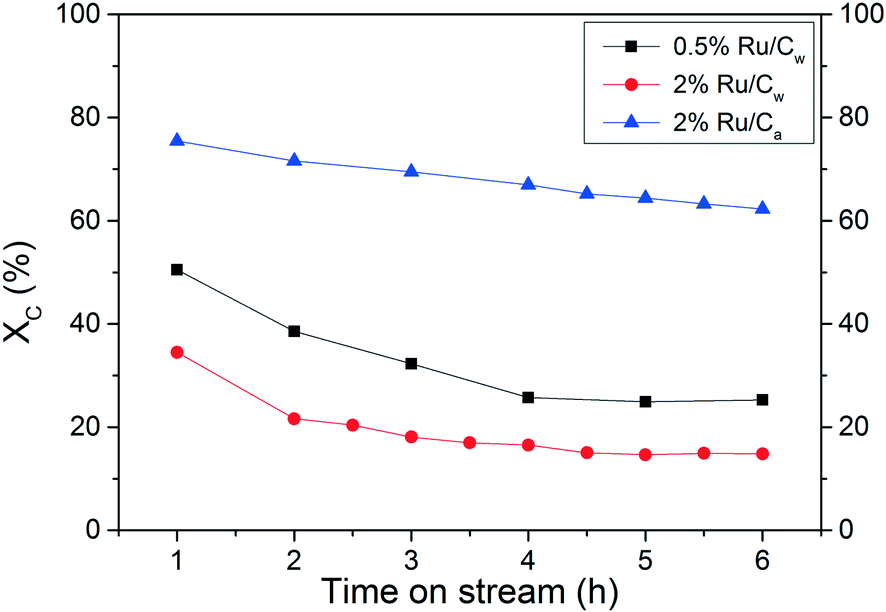
It is well known that most of the catalytic reactions occur at the surface of the active phase, often meaning that higher metal dispersion results in better activity. Hence, it is essential to assess the Ru dispersion effect on the catalytic performance. As illustrated in Fig. 8 and in Table 7, a relevant effect of the Ru dispersion was observed where the 0.5% Ru/Cw exhibited a higher activity, i.e. a higher carbon conversion XC, than the 2% Ru/Cw after 6 h of CSCWG when basing the WSHV on the amount of Ru, not on total catalyst mass. Interestingly, the TOF for the 0.5% Ru/Cw and 2% Ru/Cw were almost equal. In a recent study, Masini et al.37 have reported that larger Ru NPs (7–10 nm) were a bit more active than smaller NPs (4 nm) for the methanation reaction carried out in gas-phase confirming the structure sensitivity of the methanation. The presence of a higher concentration of under-coordinated sites (e.g. kinks or steps) on the larger Ru NPs was responsible for the catalytic activity enhancement. In fact, Vendelbo et al.38 demonstrated that the CO bond dissociation only occurs on the steps of Ru. The high capability for the CO bond dissociation is crucial since the latter is reported to be the rate-determining step for the methanation reaction.38,39 Due to the broad particle size distribution of the Ru/Cw catalysts (see Fig. 2) it is impossible to assess the Ru NPs effect and thus to conclude the structure sensitivity of the methanation reaction from our data.
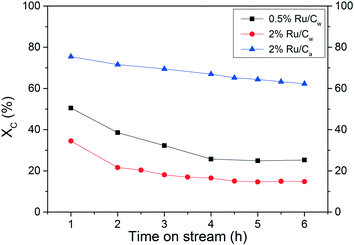 |
| | Fig. 8 Assessment of the Ru dispersion effect and the solvent effect during CSCWG of 10 wt% isopropanol at 450 °C and 30 MPa with WHSVgRu = 5202 gOrg gRu−1 h−1. | |
Table 7 Results of the CSCWG of 10 wt% isopropanol for Ru/C catalysts performed at 450 °C, 30 MPa with WHSVgRu = 5202 gOrg gRu−1 h−1
| Catalyst |
Time [h] |
X
c [%] |
TOF [s−1] |
GEc [%] |
R
Coke dep. [mmol C min−1] |
Gas composition [vol%] |
| CH4 |
CO2 |
H2 |
CO |
C2H6 |
C3Hx |
| 0.5% Ru/Cw |
6 |
25 |
2.4 |
17 |
1.2 |
46.7 |
16.5 |
36.2 |
0.2 |
<0.1 |
<0.1 |
| 24 |
10 |
0.9 |
3 |
1.0 |
3.2 |
0.6 |
96.0 |
0.2 |
<0.1 |
3.7 |
| 2% Ru/Cw |
6 |
15 |
2.6 |
5 |
1.4 |
22.1 |
9.5 |
68.1 |
0.2 |
<0.1 |
2.9 |
| 2% Ru/Ca |
6 |
62 |
4.3 |
49 |
2 |
56.0 |
22.1 |
21.6 |
0.3 |
<0.1 |
<0.1 |
A relevant effect of the solvent used during catalyst preparation was found where the activity after 6 h for the 2% Ru/Ca was higher than for the 2% Ru/Cw. As it can be seen in Table 7, the TOF was found to be halved for the 2% Ru/Cw. Such a large difference cannot only be explained by the higher Ru dispersion but mainly by the lower concentration of residual chloride. Indeed, Yin et al.31 also found a beneficial effect of acetone vs. water during NH3 decomposition over Ru/CNT catalysts. They concluded that water enhances the anchoring of residual chloride on the carbon support during the catalyst preparation. In fact, residual chloride coming from the Ru precursor (RuCl3) is well known to act as a strong inhibitor of the Ru/C catalysts affecting negatively the catalytic performance. As previously observed, the presence of residual chloride inhibited the adsorption of CO on the Ru surface. Since the CO bond dissociation is the rate-determining step for the methanation reaction, such poor activity in presence of residual chloride was expected.
The stability of the 0.5% Ru/Cw catalyst was assessed at a high WHSVgRu of 5202 gOrg gRu−1 h−1. After 6 h of CSCWG, the experiment was carried on overnight to reach a total of 24 h on-stream. Surprisingly, the catalyst was completely deactivated with an observed activity close to the one obtained during SCWG performed over the neat carbon support material (compare Table 3). It is also interesting to note the very low GEC showing that the carbon contained in the feed could not be converted to the gas phase and most likely remained inside the reactor (as coke). For all the catalysts tested, GEC was inferior to XC, confirming that coke formation occurred for all catalysts. Furthermore, their corresponding coke deposition rate has been calculated and their values are in the same range. This supports two parallel reactions: i) coke formation on the support, and ii) catalytic decomposition on the Ru. Some of the coke, likely at the interface of the Ru NPs and the support, may react with H2 to form some CH4. The high H2 concentration and the low CH4 concentration for the 0.5% Ru/Cw can both be easily explained by the inhibition of the methanation reaction due to a complete catalyst deactivation. In addition, the presence of C3Hx indicates that the catalyst is not able to cleave all C–C bonds. As illustrated in Table 8, a considerable loss of the porosity was measured after 24 h of CSCWG for the 0.5% Ru/Cw, whereas the porosity was almost unaffected for the 2% Ru/Cw and the 2% Ru/Ca after 6 h. This is an interesting observation revealing that coke deposition leads to a relatively slow catalyst deactivation. The 2% Ru/Ca was least affected by this deactivation. The high porosity of the 2% Ru/Ca after 96 h was due to the high catalytic activity showing that coke deposition hardly took place. It is important to keep in mind that the amount of catalyst in the reactor was ca. four times higher (5202 gOrg gRu−1 h−1 instead of 1228 gOrg gRu−1 h−1) meaning that a fraction of the catalytic bed was probably already deactivated and the high porosity measured came from a bed fraction still unaffected by coke deposits. Another interesting phenomenon is shown in Table 8 for the 2% Ru/Ca. While its total pore volume remains nearly constant, the volume of the mesopores decreases while at the same time the one of the micropores increases to twice the value of the fresh support. Because this phenomenon occurs only after a long time, it remained undiscovered in our previous experiments. At this time, we have no good explanation but we assume that the harsh reaction environment with a high partial pressure of H2 may form additional micropores.
Table 8 Physical structure of the fresh and spent Ru/C catalysts
| Sample |
Time [h] |
WHSVgRu [gOrg gRu−1 h−1] |
V
mesop. [cm3 g−1] |
V
microp. [cm3 g−1] |
| 0.5% Ru/Cw |
0 |
N.A. |
0.75 |
0.13 |
| 24 |
5202 |
0.60 |
0.02 |
| 2% Ru/Cw |
0 |
N.A. |
0.73 |
0.11 |
| 6 |
5202 |
0.75 |
0.11 |
| 2% Ru/Ca |
0 |
N.A. |
0.54 |
0.11 |
| 6 |
5202 |
0.51 |
0.12 |
| 96 |
1228 |
0.41 |
0.24 |
The N2-physisorption results have shown that CSCWG of isopropanol led to a loss of the porosity supporting the decrease of the catalyst lifetime caused by coke deposits. It was reported by Wambach et al.40 that the catalyst deactivation of a commercial 2% Ru/C during CSCWG of aqueous organics was due to a coverage of the Ru NPs by a thin carbonaceous layer. In Fig. 9, the Ru NPs coverage by coke seems to be confirmed by the H2-TPR results of the fresh and spent 0.5% Ru/Cw catalysts. In fact, the H2 uptake for the reduction of RuO2 was about four times smaller for the aged catalyst indicating that a considerable fraction of Ru was not available. Concerning the other reduction peaks at higher temperature, almost all disappeared after CSCWG showing that the weakly bonded carbon species and/or the surface functional groups were removed during CSCWG.
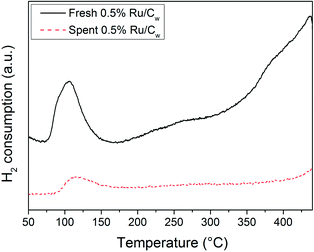 |
| | Fig. 9 H2-TPR profiles of the fresh and spent 0.5% Ru/Cw catalysts. | |
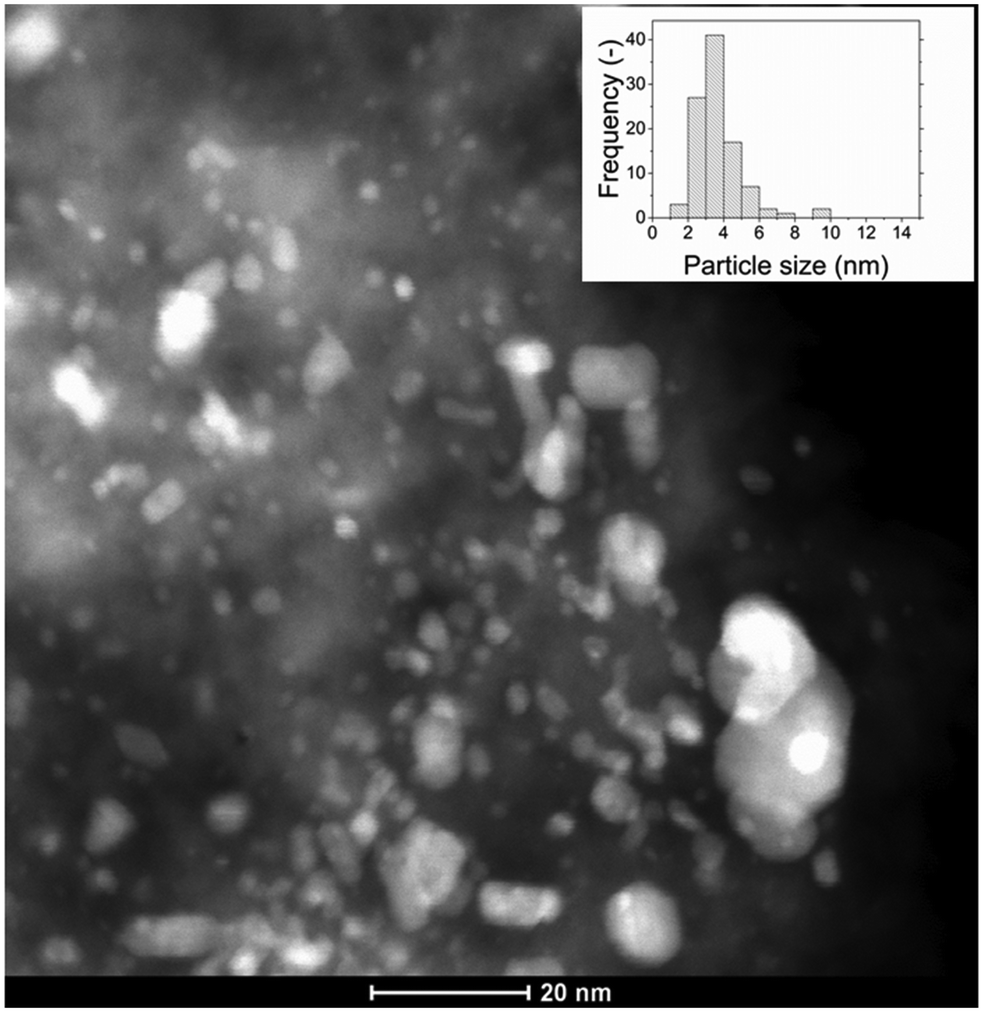
As shown in Fig. 10, after 24 h of CSCWG the Ru NPs size of the 0.5% Ru/Cw has slightly increased to a value of 4.9 ± 1.4 nm. By comparing the histogram of the particle size distribution for the fresh and spent 0.5% Ru/Cw (compare Fig. 2(a) and Fig. 10), it seems that the distribution slightly shifted to larger particle sizes indicating that small Ru NPs sintered during CSCWG. Such a small Ru NPs growth was already reported by Waldner et al.4 and Dreher et al.41 under similar conditions.
 |
| | Fig. 10 HAADF-STEM image of the spent 0.5% Ru/Cw catalyst. | |
Conclusions
In this work catalytic supercritical water gasification of isopropanol over Ru/C catalysts was studied. It was shown that isopropanol decomposed to solid carbon (coke), H2, and water over the neat carbon support in the absence of Ru. Although the Ru/C catalysts revealed a high activity as well as a high CH4 selectivity during CSCWG, the decrease of the catalyst lifetime caused by a progressive coke deposition was the main cause for the complete loss of the catalytic activity. The latter deactivation was due to the decomposition of isopropanol over the carbon surface leading to coke. It was found that a higher Ru dispersion was beneficial for the improvement of the catalytic activity. The use of acetone during the catalyst preparation favored a higher Ru dispersion and reduced significantly the amount of residual chloride coming from the salt precursor (RuCl3). As a result the TOF was twice the value for the Ru/C catalyst prepared with water. Since the presence of residual chloride inhibited the CO adsorption on the Ru surface, the performance of the methanation was significantly reduced suggesting that the use of a chloride free salt precursor is required for the improvement of the catalytic performance.
Acknowledgements
This work was financially supported in the frame of the SunCHem project by the Competence Center Energy and Mobility (CCEM-CH) and Swisselectric Research. The authors would like to thank Erich De Boni, and Marian Dreher for the construction of the plug flow reactor setup, Albert Schuler for the ICP-OES analyses, Martin Elsener for the CO pulse chemisorption measurements, Jörg Wambach for the XPS measurements, Xiaoying Xu for the GC-MS measurements, and Alexander Wokaun for the fruitful discussions.
References
- A. A. Peterson, F. Vogel, R. P. Lachance, M. Froeling, M. J. Antal Jr. and J. W. Tester, Energy Environ. Sci., 2008, 1, 32–65 CAS.
- D. J. M. De Vlieger, B. L. Mojet, L. Lefferts and K. Seshan, J. Catal., 2012, 292, 239–245 CrossRef CAS PubMed.
-
F. Vogel, in Handbook of Green Chemistry, ed. R. H. Crabtree, WILEY-VCH, Weinheim, 2009, vol. 2, pp. 281–324 Search PubMed.
- M. H. Waldner, F. Krumeich and F. Vogel, J. Supercrit. Fluids, 2007, 43, 91–105 CrossRef CAS PubMed.
- D. C. Elliott, M. R. Phelps, L. J. Sealock and E. G. Baker, Ind. Eng. Chem. Res., 1994, 33, 566–574 CrossRef CAS.
- X. D. Xu, Y. Matsumura, J. Stenberg and M. J. Antal, Ind. Eng. Chem. Res., 1996, 35, 2522–2530 CrossRef CAS.
- X. D. Xu and M. J. Antal, Environ. Prog., 1998, 17, 215–220 CrossRef CAS.
- I. G. Lee and S. K. Ihm, Ind. Eng. Chem. Res., 2009, 48, 1435–1442 CrossRef CAS.
- M. J. Antal, S. G. Allen, D. Schulman, X. D. Xu and R. J. Divilio, Ind. Eng. Chem. Res., 2000, 39, 4040–4053 CrossRef CAS.
- G. W. Huber, J. W. Shabaker and J. A. Dumesic, Science, 2003, 300, 2075–2077 CrossRef CAS PubMed.
- Y. Li, L. Guo, X. Zhang, H. Jin and Y. Lu, Int. J. Hydrogen Energy, 2010, 35, 3036–3045 CrossRef CAS PubMed.
- R. R. Davda, J. W. Shabaker, G. W. Huber, R. D. Cortright and J. A. Dumesic, Appl. Catal., B, 2003, 43, 13–26 CrossRef CAS.
- A. Sharma, H. Nakagawa and K. Miura, Fuel, 2006, 85, 2396–2401 CrossRef CAS PubMed.
- B. Yan, J. Wu, C. Xie, F. He and C. Wei, J. Supercrit. Fluids, 2009, 50, 155–161 CrossRef CAS PubMed.
- T. Yoshida and Y. Oshima, Ind. Eng. Chem. Res., 2004, 43, 4097–4104 CrossRef CAS.
- A. Yamaguchi, N. Hiyoshi, O. Sato, K. K. Bando, M. Osada and M. Shirai, Catal. Today, 2009, 146, 192–195 CrossRef CAS PubMed.
- K. Pinkwart, T. Bayha, W. Lutter and M. Krausa, J. Power Sources, 2004, 136, 211–214 CrossRef CAS PubMed.
- A. J. Byrd, S. Kumar, L. Kong, H. Ramsurn and R. B. Gupta, Int. J. Hydrogen Energy, 2011, 36, 3426–3433 CrossRef CAS PubMed.
- A. J. Byrd, K. K. Pant and R. B. Gupta, Fuel, 2008, 87, 2956–2960 CrossRef CAS PubMed.
- A. May, J. Salvado, C. Torras and D. Montane, Chem. Eng. J., 2010, 160, 751–759 CrossRef CAS PubMed.
- G. van Rossum, B. Potic, S. R. A. Kersten and W. P. M. van Swaaij, Catal. Today, 2009, 145, 10–18 CrossRef CAS PubMed.
- P. Azadi, J. Otomo, H. Hatano, Y. Oshima and R. Farnood, Int. J. Hydrogen Energy, 2010, 35, 3406–3414 CrossRef CAS PubMed.
- A. G. Chakinala, S. Kumar, A. Kruse, S. R. A. Kersten, W. P. M. van Swaaij and D. W. F. Brilman, J. Supercrit. Fluids, 2013, 74, 8–21 CrossRef CAS PubMed.
-
M. Dreher, Catalysis Under Extreme Conditions: in situ Studies of the Reforming of Organic Key Compounds in Supercritical Water, ETH Zurich, Switzerland, 2013 Search PubMed.
- D. J. M. De Vlieger, L. Lefferts and K. Seshan, Green Chem., 2014, 16, 864–874 RSC.
- D. C. Elliott, T. R. Hart and G. G. Neuenschwander, Ind. Eng. Chem. Res., 2006, 45, 3776–3781 CrossRef CAS.
- A. Borodzinski and M. Bonarowska, Langmuir, 1997, 13, 5613–5620 CrossRef CAS.
- Z. Y. Ding, M. A. Frisch, L. X. Li and E. F. Gloyna, Ind. Eng. Chem. Res., 1996, 35, 3257–3279 CrossRef CAS.
- P. Azadi and R. Farnood, Int. J. Hydrogen Energy, 2011, 36, 9529–9541 CrossRef CAS PubMed.
- H. Zoehrer, F. Mayr and F. Vogel, Energy Fuels, 2013, 27, 4739–4747 CrossRef.
- S. F. Yin, B. Q. Xu, W. X. Zhu, C. F. Ng, X. P. Zhou and C. T. Au, Catal. Today, 2004, 93–95, 27–38 CrossRef CAS PubMed.
- M. Cerro-Alarcon, A. Maroto-Valiente, I. Rodriguez-Ramos and A. Guerrero-Ruiz, Carbon, 2005, 43, 2711–2722 CrossRef CAS PubMed.
- Y. Li, C. Pan, W. Han, H. Chai and H. Liu, Catal. Today, 2011, 174, 97–105 CrossRef CAS PubMed.
- I. Rossetti, N. Pernicone and L. Forni, Appl. Catal., A, 2003, 248, 97–103 CrossRef CAS.
- A. Guerrero-Ruiz, P. Badenes and I. Rodriguez-Ramos, Appl. Catal., A, 1998, 173, 313–321 CrossRef CAS.
- Y. C. Chiang, W. H. Lin and Y. C. Chang, Appl. Surf. Sci., 2011, 257, 2401–2410 CrossRef CAS PubMed.
- F. Masini, C. E. Strebel, D. N. McCarthy, A. U. F. Nierhoff, J. Kehres, E. M. Fiordaliso, J. H. Nielsen and I. Chorkendorff, J. Catal., 2013, 308, 282–290 CrossRef CAS PubMed.
- S. B. Vendelbo, M. Johansson, D. J. Mowbray, M. P. Andersson, F. Abild-Pedersen, J. H. Nielsen, J. K. Norskov and I. Chorkendorff, Top. Catal., 2010, 53, 357–364 CrossRef CAS.
- M. P. Andersson, F. Abild-Pedersen, I. N. Remediakis, T. Bligaard, G. Jones, J. Engbæk, O. Lytken, S. Horch, J. H. Nielsen and J. Sehested, J. Catal., 2008, 255, 6–19 CrossRef CAS PubMed.
- J. Wambach, M. Schubert, M. Doebeli and F. Vogel, Chimia, 2012, 66, 706–711 CrossRef CAS PubMed.
- M. Dreher, B. Johnson, A. A. Peterson, M. Nachtegaal, J. Wambach and F. Vogel, J. Catal., 2013, 301, 38–45 CrossRef CAS PubMed.
Footnote |
| † Present address: Department of Chemistry, Technical University Munich, 85748 Garching, Germany. |
|
| This journal is © The Royal Society of Chemistry 2014 |
Click here to see how this site uses Cookies. View our privacy policy here.  Open Access Article
 This Open Access Article is licensed under a