 Open Access Article
Creative Commons Attribution 3.0 Unported Licence
The role of carbonaceous deposits in the activity and stability of Ni-based catalysts applied in the dry reforming of methane
Hendrik
Düdder
a,
Kevin
Kähler
a,
Bastian
Krause
b,
Katharina
Mette
c,
Stefanie
Kühl
c,
Malte
Behrens
c,
Viktor
Scherer
b and
Martin
Muhler
*a
aLaboratory of Industrial Chemistry, Ruhr-University Bochum, Bochum, Germany. E-mail: muhler@techem.rub.de
bLaboratory of Energy Plant Technology, Ruhr-University Bochum, Bochum, Germany
cDepartment of Inorganic Chemistry, Fritz-Haber-Institut der Max-Planck-Gesellschaft, Berlin, Germany
First published on 18th June 2014
Abstract
Highly stable Ni catalysts with varying Ni contents up to 50 mol% originating from hydrotalcite-like precursors were applied in the dry reforming of methane at 800 and 900 °C. The integral specific rate of methane conversion determined after 10 h on stream was 3.8 mmol s−1 gcat−1 at 900 °C. Due to the outstanding high activity, a catalyst mass of just 10 mg had to be used to avoid operating the reaction in thermodynamic equilibrium. The resulting WHSV was as high as 1.44 × 10⁶ ml gcat−1 h−1. The observed axial temperature distribution with a pronounced cold spot was analyzed by computational fluid dynamics simulations to verify the strong influence of this highly endothermic reaction. Transmission electron microscopy and temperature-programmed oxidation experiments were used to probe the formation of different carbon species, which was found to depend on the catalyst composition and the reaction temperature. Among the formed carbon species, multi-walled carbon nanofibers were detrimental to the long-term stability at 800 °C, whereas their formation was suppressed at 900 °C. The formation of graphitic carbon at 900 °C originating from methane pyrolysis played a minor role. The methane conversion after 100 h of dry reforming at 900 °C compared to the initial one amounted to 98% for the 25 mol% Ni catalyst. The oxidative regeneration of the catalyst was achieved in the isothermal mode using only carbon dioxide in the feed.
1 Introduction
Due to the threatening shortage of crude oil, one of the major challenges of present research is the environmentally friendly and sustainable production of raw materials for fuel production and chemical synthesis. CO, as a component of synthesis gas, is one of the most important industrially used C1 building blocks, which is applied in many large-scale processes such as the synthesis of hydrocarbons, methanol, and dimethyl ether as well as in oxo-synthesis.1,2 A promising feedstock for CO production may be CO2, which can be recycled using renewable energy and reincorporated in the value-added chain as a carbon source. Additionally, using CO2 as a feedstock for industrial products may help to improve the climate balance to a minor extent, as the global warming caused by the continuously increasing emission of the well-known greenhouse gases CO2, NOx and CH4 is a huge environmental problem.3,4One efficient way to generate synthesis gas starting from CO2 is the dry reforming of methane (DRM, eqn (1)). The resulting synthesis gas is characterized by a H2/CO ratio close to unity, which is therefore an interesting feedstock particularly in oxo- or Fischer–Tropsch synthesis.5–8
| CO2 + CH4 ⇌ 2H2 + 2CO ΔrH0 = 247 kJ mol−1 | (1) |
In addition to noble metals such as Pt, Rh, or Ru, Ni-based catalysts are known to be active in the DRM.9,10 The noble metal catalysts are highly stable during the DRM, but are less suitable because of their high prices, whereas the non-noble metal catalysts suffer from a lack of stability due to strong coking at moderate temperatures.11,12 The carbon deposits formed during the DRM can differ in their morphology and reactivity.13
Table 1 summarizes examples of catalyst activities in the DRM reported in the literature.14–22 For a better comparison, specific average reaction rates rCH4 were calculated for all catalysts according to eqn (2), where mcat is the catalyst mass and  and
and  are the molar flows of methane at the entrance and the exhaust of the reactor, respectively.
 | (2) |
| Catalyst | Ref. | WHSV/ml g−1 h−1 | TDRM/°C | X CH4/% | Reaction rate/mmol s−1 gcat−1 |
|---|---|---|---|---|---|
| 1 wt% Ni/Al2O3 | 14 | 20![[thin space (1/6-em)]](https://www.rsc.org/images/entities/char_2009.gif) 000 000 |
800 | 74 | 0.09 |
| 10 wt% Ni/Al2O3 | 15 | 52![[thin space (1/6-em)]](https://www.rsc.org/images/entities/char_2009.gif) 000 000 |
800 | 80 | 0.13 |
| 10 wt% Ni/Al2O3 | 15 | 52![[thin space (1/6-em)]](https://www.rsc.org/images/entities/char_2009.gif) 000 000 |
900 | 95 | 0.15 |
| 13.6 wt% NiO/5.1 wt% MgO/SA | 16 | 40![[thin space (1/6-em)]](https://www.rsc.org/images/entities/char_2009.gif) 000 000 |
800 | 34 | 0.08 |
| 13.6 wt% NiO/5.1 wt% MgO/SA | 16 | 40![[thin space (1/6-em)]](https://www.rsc.org/images/entities/char_2009.gif) 000 000 |
850 | 48 | 0.12 |
| 13.6 wt% NiO/5.1 wt% MgO/SA | 16 | 40![[thin space (1/6-em)]](https://www.rsc.org/images/entities/char_2009.gif) 000 000 |
900 | 60 | 0.15 |
| β-Mo2C | 17 | 2870 | 847 | 92 | 0.02 |
| Ni–Co/Al2O3 | 14 | 20![[thin space (1/6-em)]](https://www.rsc.org/images/entities/char_2009.gif) 000 000 |
800 | 61 | 0.08 |
| NiO/MgAlOx | 18 | 34![[thin space (1/6-em)]](https://www.rsc.org/images/entities/char_2009.gif) 000 000 |
800 | 95 | 0.12 |
| NiO–CaO (Ni/Ca = 3) | 19 | 11![[thin space (1/6-em)]](https://www.rsc.org/images/entities/char_2009.gif) 500 500 |
850 | 98 | 0.07 |
| NiO–CaO (Ni/Ca = 3) | 19 | 70![[thin space (1/6-em)]](https://www.rsc.org/images/entities/char_2009.gif) 000 000 |
850 | 62 | 0.27 |
| NiRhCe2Zr1.51 | 20 | 30![[thin space (1/6-em)]](https://www.rsc.org/images/entities/char_2009.gif) 000 000 |
800 | 94 | 0.03 |
| NiRhCe2Zr1.51 | 20 | 12![[thin space (1/6-em)]](https://www.rsc.org/images/entities/char_2009.gif) 000 000 |
800 | 40 | 0.04 |
| 2Ni–1Zr/MCM-41 | 21 | 50![[thin space (1/6-em)]](https://www.rsc.org/images/entities/char_2009.gif) 000 000 |
800 | 95 | 0.15 |
| 55 wt% Ni/MgAlOx | 22 | 1![[thin space (1/6-em)]](https://www.rsc.org/images/entities/char_2009.gif) 440 440![[thin space (1/6-em)]](https://www.rsc.org/images/entities/char_2009.gif) 000 000 |
800 | 62 | 3.5 |
| 55 wt% Ni/MgAlOx | 22 | 1![[thin space (1/6-em)]](https://www.rsc.org/images/entities/char_2009.gif) 440 440![[thin space (1/6-em)]](https://www.rsc.org/images/entities/char_2009.gif) 000 000 |
900 | 74 | 4.2 |
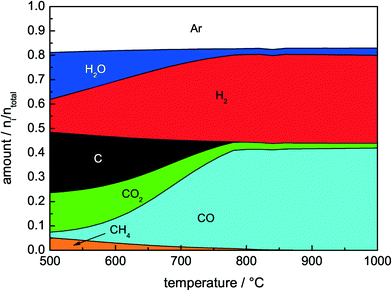
Considering the thermodynamic equilibrium composition of the major components CO2, CH4, CO, H2, C, and H2O (Fig. 1), a promising way to overcome the deactivation caused by coking is to carry out the DRM at elevated temperatures. According to these thermodynamic calculations, the carbon formation due to the exothermic Boudouard equilibrium (eqn (3)) is negligible at temperatures higher than 750 °C. However, increasing the temperature causes sintering of the active metal particles and thereby loss of active surfaces. Furthermore, endothermic homogeneous gas phase reactions are favored, for instance, the pyrolysis of methane (eqn (4)).6
| 2CO ⇌ CO2 + C ΔrH0 = −172 kJ mol−1 | (3) |
| CH4 → 2H2 + C ΔrH0 = 75 kJ mol−1 | (4) |
| H2 + CO2 ⇌ H2O + CO ΔrH0 = 41 kJ mol−1 | (5) |
| C + O2 → CO2 ΔrH0 = −394 kJ mol−1 | (6) |
In our present study, Ni catalysts prepared from htl precursors with varying Ni contents, which have large surface areas and are thermally stable at elevated temperatures, were investigated.22 Additionally, strong interactions between the Ni nanoparticles and the support matrix can be achieved with an htl precursor.18,29–34 The role of the reaction temperature as well as the Ni loading in the nature of the carbon deposits and their influence on the activity and the long-term stability of the catalysts were investigated using steady-state activity tests combined with transient kinetic measurements such as temperature-programmed oxidation (TPO) supported by transmission electron microscopy (TEM) to identify the generated carbon species. The influence of the endothermic reaction on the temperature distribution in the catalyst bed was investigated by measuring axial temperature profiles and simulations based on computational fluid dynamics (CFD).
2 Experimental
2.1 Catalyst preparation
A series of Ni/MgAlOx catalysts was synthesized from htl precursors with the general formula NixMg0.67−xAl0.33(OH)2(CO3)0.17·mH2O, which were obtained by the constant pH co-precipitation method at 50 °C using aqueous 0.6 M NaOH, 0.09 M Na2CO3, and 0.4 M metal nitrate solutions at pH 8.5. The precipitates were aged for 0.5 h in the mother liquor, filtered, thoroughly washed with water, and dried at 100 °C. The amount of Ni was varied between 0–50 mol%, i.e. 0 ≤ x ≤ 0.5, leading to Ni amounts of 0 to 55 wt% in the final catalyst. The precursors were calcined in air at 600 °C for 3 h.2.2 Catalyst characterization
X-ray powder diffraction (XRD) measurements were performed with a STOE STADI-P transmission diffractometer equipped with a primary focusing Ge(111) monochromator and a 3° linear position-sensitive detector (PSD) using CuKα,1 radiation. Small amounts of X-ray amorphous grease were used to fix the powder samples between two thin films of polyacetate foil. Specific surface areas of the calcined material were measured by N2 physisorption (Quantachrome Autosorb-1) and evaluated using the BET method. Prior to the physisorption measurements, the calcined samples were outgassed for 4 h at 150 °C. Temperature-programmed reduction (TPR) of the samples was performed in a fixed-bed reactor in a quartz tube (TPDRO-1100, CE Instruments) using 5% H2 in Ar and a total flow of 80 Nml min−1 with a linear heating rate of 6 °C min−1. The H2 consumption was monitored with a calibrated thermal conductivity detector (TCD). To determine the specific Ni surface area, the H2 pulse chemisorption method was applied. The samples were reduced in a fixed-bed reactor using 5% H2 in Ar, a total flow of 80 Nml min−1 and a heating rate of 6 °C min−1 to 1000 °C. After cooling to 50 °C in Ar, a defined volume of pure H2 was introduced by dosing pulses of 250 μl, until no further H2 uptake was detected. The Ni metal surface areas were determined assuming dissociative hydrogen chemisorption and an adsorption stoichiometry of Hads![[thin space (1/6-em)]](https://www.rsc.org/images/entities/char_2009.gif) :
:![[thin space (1/6-em)]](https://www.rsc.org/images/entities/char_2009.gif) Nisurf = 1
Nisurf = 1![[thin space (1/6-em)]](https://www.rsc.org/images/entities/char_2009.gif) :
:![[thin space (1/6-em)]](https://www.rsc.org/images/entities/char_2009.gif) 1.35
1.35
After the TPO experiments, the samples were reactivated by reduction and exposed to a second DRM run under the conditions described below to obtain the spent samples for microstructural characterization. Afterwards, the catalysts were separated from the diluent by sieving, dispersed in CHCl3 and deposited on a holey carbon film supported on a copper grid. The microstructure of the spent catalysts was examined by using Philips CM200 transmission electron microscopes (TEM) equipped with a LaB6 cathode or a field electron gun. High-resolution images were taken with a CCD camera. For good statistics, 40 to 80 images were taken for each sample on different agglomerates and regions of the catalysts.
2.3 Catalytic DRM tests
The catalytic DRM tests were performed in a continuously operated flow system at atmospheric pressure using a fixed-bed tubular quartz reactor of 8 mm inner diameter. The reactor was equipped with a ceramic tube of 3 mm outer and 1 mm inner diameter in the radial center of the reactor. By means of a movable thermocouple inside this ceramic tube, temperature profiles in the axial direction were obtained. For the steady-state measurements, a calibrated on-line gas chromatograph (GC, Shimadzu 14-B) was used to analyze the product gas composition every 60 minutes. The GC was equipped with two columns (Porapak N and Molsieve 5 A) and a TCD. For the transient studies, a coupled IR detector (CO, CO2 & CH4) and a TCD for H2 (Emerson MLT4 multichannel analyzer) and a paramagnetic O2 detector (Magnos 16) were used.For the catalytic tests, 10 mg of the calcined catalyst (sieve fraction of 250–355 μm) was diluted with 490 mg of high purity SiC (sieve fraction of 125–180 μm). Initially, the catalyst was activated using a linear temperature ramp; it was reduced in a total flow of 20 Nml min−1 of 4% H2 in Ar (purity 99.9%, 99.999%) by heating to the desired maximum temperature of reduction with a linear heating rate of 5 °C min−1. The final temperature was held constant for 30 min. Afterwards, the catalyst was cooled or heated to the specified reaction temperature in Ar (99.999%). The dry reforming reaction was carried out with a gas mixture consisting of CH4 (99.9995%), CO2 (99.9995%) and Ar in a ratio of 32![[thin space (1/6-em)]](https://www.rsc.org/images/entities/char_2009.gif) :
:![[thin space (1/6-em)]](https://www.rsc.org/images/entities/char_2009.gif) 40
40![[thin space (1/6-em)]](https://www.rsc.org/images/entities/char_2009.gif) :
:![[thin space (1/6-em)]](https://www.rsc.org/images/entities/char_2009.gif) 28. The total flow was set to 240 Nml min−1. To ensure a CO2/CH4 ratio ≥1.25 at any time, the CH4 partial pressure was increased stepwise while starting the experiment. The reaction was performed at a constant furnace temperature with reaction times of 1, 10, and 100 h. Subsequent to the catalytic tests, the sample was cooled to room temperature in Ar, and a TPO experiment was performed with flow rates of 20 or 40 Nml min−1 of 4.5% O2 in Ar (99.995%, 99.999%) and a linear heating rate of 5 °C min−1. The final temperature of 800 °C was held constant until O2 consumption was no longer observed. Additionally, a blank experiment with 490 mg of pure SiC including a subsequent TPO experiment was performed.
28. The total flow was set to 240 Nml min−1. To ensure a CO2/CH4 ratio ≥1.25 at any time, the CH4 partial pressure was increased stepwise while starting the experiment. The reaction was performed at a constant furnace temperature with reaction times of 1, 10, and 100 h. Subsequent to the catalytic tests, the sample was cooled to room temperature in Ar, and a TPO experiment was performed with flow rates of 20 or 40 Nml min−1 of 4.5% O2 in Ar (99.995%, 99.999%) and a linear heating rate of 5 °C min−1. The final temperature of 800 °C was held constant until O2 consumption was no longer observed. Additionally, a blank experiment with 490 mg of pure SiC including a subsequent TPO experiment was performed.
2.4 CNT growth experiments
CNT growth experiments were performed in the same reactor with 10 mg of the 50 mol% Ni catalyst diluted with 490 mg of SiC. The catalyst was heated to 800 °C at a rate of 5 °C min−1 in a flow of 20 Nml min−1 of 4% H2 in Ar.36 The reduced catalyst was cooled to 680 °C. Afterwards, a mixture of 32 Nml min−1 CH4 (99.9995%) and 68 Nml min−1 % H2 (99.9999%) was fed to the reactor for 1 h. The catalyst was then cooled to room temperature in flowing Ar and a subsequent TPO experiment was performed in analogy to the TPO experiments after the DRM.2.5 TPO experiments using carbon reference samples
TPO experiments with different commercially available carbon samples were carried out to obtain reference TPO profiles. CNTs with different amounts of the residual growth catalyst were obtained from Bayer: Baytubes C 70 P containing in total less than 5% of inorganic impurities and Baytubes C 150 HP with less than 1% of inorganic impurities. High surface area graphite powders (HSAG) were used with different specific surface areas: HSAG 100 with 80 m2 g−1 and HSAG 300 with 270 m2 g−1. For the TPO experiments, the carbon samples were diluted with 490 mg of SiC and placed in the same reactor used for the DRM tests. A TPO experiment similar to the DRM measurements was performed at a heating rate of 5 °C min−1, a maximum temperature of 800 °C, and a total flow of 40 Nml min−1 of 4.5% O2 in Ar. The final temperature was held constant until O2 was no longer consumed.2.6 Simulation of the axial temperature profiles
The temperature profiles were obtained by moving a thermocouple in the axial direction. As a reference, the temperature profile of pure SiC under DRM conditions was recorded. The temperature profiles of the catalysts during the DRM were obtained after 1 h of time on stream under steady-state conditions. The reactor simulations were carried out using the commercial CFD software FLUENT version 14.0 (Fluent Inc., USA) and appropriate user-defined subroutines. A more detailed description of the model, on which the simulation was based, will be published elsewhere. Due to the complexity of the flow phenomena occurring in fixed-bed reactors, there is a need for complex computational meshes and boundary conditions to determine the actual velocity field in the bed.37,38 In order to reduce the associated computational effort, the fixed-bed must be handled as a porous medium, which corresponds to the assumption of a quasi-homogeneous reactor model on the sub-grid scale.39 The energy equation for this porous medium is based on the one-temperature model implemented in ANSYS FLUENT 14.0. It suggests that the temperature of the solid phase equals that of the gas phase due to the local thermal equilibrium between the gas and solid phases. It also assumes one effective thermal conductivity for the porous region.40 This assumption is justified for the current case because of the low Biot number of the system of about Bi = 3 × 10⁻³, mainly resulting from the high thermal conductivity of the used diluent. The flow in the fixed bed is modeled as a porous fluid region with extra terms in momentum balance to allow additional resistance to the flow.40 Due to the high diameter ratio of the reactor and the particle, the void fraction of the porous fixed-bed was set to a constant value of ψ = 0.4. Therefore, an inhomogeneous void fraction distribution only occurs at very small reactor wall distances and does not significantly affect the velocity distribution. The low Reynolds number of the system amounts to about 25 in the tube and 50 in the fixed-bed predict laminar flow. Thus, turbulence modeling was not required. The flow in the porous medium was influenced by the solid matrix removing energy from the reaction zone.40 The simulation was based on the dry reforming of methane (eqn (1)) and the reverse water–gas shift reaction (eqn (5)). The kinetic expressions were taken from Richardson and Paripatyadar,27 whereas the equilibrium constant of the RWGS was taken from ref. 41. Because of the small crushed catalyst and inert particles, external mass and heat transfer limitations were absent,27 leading to an isothermal temperature distribution in the particles with an effectiveness factor of 1.0.2.7 Regeneration of the catalyst
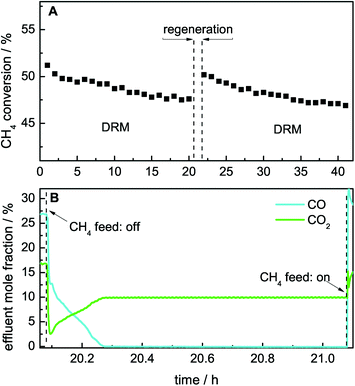
Regeneration of the catalyst was carried out using either the temperature-programmed or the isothermal mode after the DRM at 800 °C. Subsequent to the DRM and cooling to room temperature in Ar, the catalyst was either heated with a linear heating ramp of 5 °C min−1 to a maximum temperature of 800 °C in 4.5% O2 in Ar or 10% CO2 in Ar with a total flow of 40 Nml min−1, followed by a further DRM run at 800 °C. For the isothermal regeneration after 20 h of DRM, the feed gas composition was changed to 10% of CO2 in Ar with a total flow of 40 Nml min−1 for 1 h. Afterwards, methane was dosed again, and the DRM was carried out for another 20 h.3 Results and discussion
3.1 Characterization of the samples
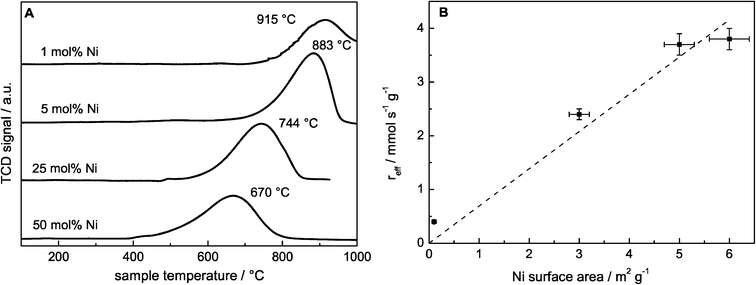
A series of htl precursors was calcined at 600 °C, resulting in the decomposition of the precursor structure into nearly X-ray amorphous NiMgAl oxides (Fig. 2A). Only broad modulations of the background are observed at the peak positions of a rock salt structure-type phase such as NiO or MgO. Due to the similar diffraction patterns of MgO and NiO, no detailed phase identification can be achieved based on XRD for the poorly crystalline materials. The surface area was increasing from 134 to 226 m2 g−1 with increasing Ni content and decreasing Mg content (Table 2). The reduction behavior of the calcined materials was investigated using TPR in 5% H2 in Ar (Fig. 3A). Upon reduction with H2, the Ni oxide components of the calcined samples were reduced to metallic Ni. The maximum reduction temperature was decreasing with increasing Ni content from 915 °C for 1 mol% Ni to 670 °C for 50 mol% Ni, suggesting autocatalytic reduction kinetics due to hydrogen spill-over. The reduction profiles revealed that at a reduction temperature of 1000 °C, Ni was completely reduced in all samples. According to the criterion developed by Monti and Baiker,42 the amount of sample used in the TPR experiments was adjusted to obtain comparable peak areas. Upon reduction at 1000 °C, a nanoscopic segregation of the components had taken place and XRD clearly confirmed the presence of metallic Ni (Fig. 2B). While the oxidic components in the catalyst with the highest Ni content were still only poorly crystalline structures, the intensity of the MgO and MgAl2O4 phases increased with decreasing Ni content. In order to determine the accessible Ni metal surface area, H2 pulse chemisorption measurements were applied using samples reduced at 1000 °C. An increasing Ni surface area was found for increasing Ni contents (Table 2). It is remarkable that the Ni dispersion of the 25 mol% Ni catalyst is 2.5 times higher than the Ni dispersion of the 1 mol% Ni sample, pointing to a strong embedding effect of the support matrix. Therefore, sintering of the Ni particles is suppressed and even at higher loadings a degree of Ni dispersion in the range 1–7% is achieved (Table 2).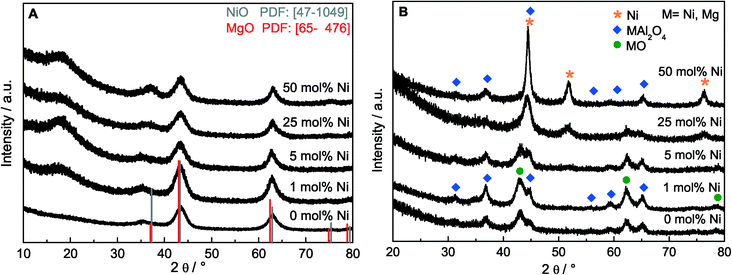 | ||
| Fig. 2 XRD patterns of the samples with different Ni contents (A) after calcination of the htl precursor at 600 °C and (B) after reduction at 1000 °C. | ||
| Ni content/mol% | Ni surface area/m2 g−1 | Ni dispersion/% | Ni particle size/nm (TEM) | BET area/m2 g−1 | C equivalents/mmol gcat−1 |
|---|---|---|---|---|---|
| 0 | 0.0 | — | — | 134 | 33 |
| 1 | 0.1 | 1.0 | 7.0 | 180 | 13 |
| 5 | 3.0 | 6.9 | 9.3 | 205 | 12 |
| 25 | 5.0 | 2.5 | 7.3 | 221 | 22 |
| 50 | 6.0 | 1.6 | 19.4 | 226 | 24 |
3.2 Catalytic testing
The TPR results revealed a strong influence of the catalyst composition on the reducibility of Ni. Therefore, the studies on the effect of the Ni loading on the catalytic performance were carried out with a reductive pre-treatment up to 1000 °C for all catalysts to ensure a complete reduction of Ni and to exclude the influence of different pre-treatment temperatures. During the reduction, the H2 consumption was only detectable for the samples with the highest Ni contents of 25 mol% and 50 mol% Ni due to the low amount of the catalyst used in the reactor. In good agreement with the TPR results, reduction peaks at around 720 °C for 25 mol% Ni and 670 °C for 50 mol% Ni were observed.We showed recently that the catalyst with 50 mol% Ni had a higher stability in DRM at 900 °C than at 800 °C.22 Therefore, the comparison of the ex-htl catalysts with varying Ni contents was performed at 900 °C. During the DRM, the catalysts with Ni contents between 5 mol% and 50 mol% achieved a stable degree of conversion over 10 h on stream as shown in Fig. 4B, whereas for the catalyst with 1 mol% Ni an activation period of about 2 h was observed (Fig. 4A). The detected H2/CO ratio was lower than the stoichiometric ratio of 1![[thin space (1/6-em)]](https://www.rsc.org/images/entities/char_2009.gif) :
:![[thin space (1/6-em)]](https://www.rsc.org/images/entities/char_2009.gif) 1, which would be expected for the exclusively occurring DRM (Table 3). In addition, the formation of water was detected, indicating the simultaneously occurring reverse water–gas shift reaction (RWGS, eqn (5)). The degrees of methane conversion (XCH4) as well as the integral specific rates of methane conversion (rCH4, eqn (2)), after 10 h on stream are summarized in Table 3. The degree of methane conversion increased with higher Ni content and correlated almost linearly with the specific Ni surface area (Fig. 3B). During the catalytic test using pure SiC, no significant conversion within the detection limits was observed.
1, which would be expected for the exclusively occurring DRM (Table 3). In addition, the formation of water was detected, indicating the simultaneously occurring reverse water–gas shift reaction (RWGS, eqn (5)). The degrees of methane conversion (XCH4) as well as the integral specific rates of methane conversion (rCH4, eqn (2)), after 10 h on stream are summarized in Table 3. The degree of methane conversion increased with higher Ni content and correlated almost linearly with the specific Ni surface area (Fig. 3B). During the catalytic test using pure SiC, no significant conversion within the detection limits was observed.
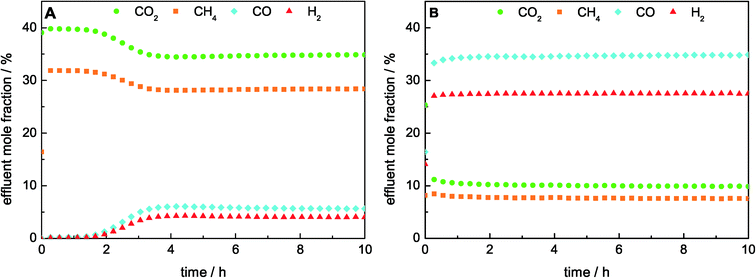 | ||
| Fig. 4 Effluent mole fractions during DRM at 900 °C in a total flow of 240 Nml min−1 consisted of 32% CH4 and 40% CO2 in Ar for A) 1 mol% Ni and (B) 50 mol% Ni catalysts. | ||
| Ni content/mol% | X CH4,10 h/% | Reaction rate/mmol s−1 gcat−1 | Metal sites/μmol gcat−1 | TOF/s−1 | H2/CO | H2 Yield |
|---|---|---|---|---|---|---|
| 0 | 0 | 0.0 | — | — | — | — |
| 1 | 7 | 0.4 | 3 | — | 0.7 | 0.07 |
| 5 | 42 | 2.4 | 77 | 31 | 0.7 | 0.36 |
| 25 | 66 | 3.7 | 128 | 29 | 0.8 | 0.61 |
| 50 | 67 | 3.8 | 154 | 25 | 0.8 | 0.63 |
The almost linearly increasing degree of conversion with increasing Ni surface area might indicate that the average turnover frequency does not depend on the Ni particle size (Table 3). However, both the dispersion (1–7%) and the mean particle size of the nickel particles estimated by TEM (7–19 nm) are comparable for all investigated catalysts (Table 2). Therefore, the catalytic data do not allow us to draw any conclusions on the structure sensitivity of DRM over Ni catalysts, which is known to be strucure-sensitive.10
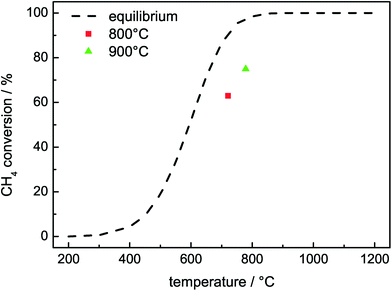
In the following, the kinetic DRM investigations were focused on the most active catalyst with 50 mol% Ni. Instead of 1000 °C maximum reduction temperature for the comparison of the different Ni contents, the catalyst was pre-reduced at temperatures only up to 800 °C, which should lead to complete reduction according to the TPR results. The lower pre-treatment temperature led to a slightly higher activity in the DRM due to less severe sintering of the Ni particles as detected by TEM.22 After the pre-reduction, the catalyst was tested in the DRM at 800 °C and 900 °C. The integral specific rates of methane conversion determined after 60 min on stream were 3.5 mmol s−1 gcat−1 at 800 °C and 4.2 mmol s−1 gcat−1 at 900 °C.22 Due to the outstanding activity, the catalyst mass had to be lowered to 10 mg to avoid operating the reaction in thermodynamic equilibrium. The resulting WHSV was as high as 1.44 × 10⁶ ml gcat−1 h−1 corresponding to 240 Nml min−1 total gas flow. The calculated thermodynamic equilibrium and the highest observed degrees of methane conversion are plotted against temperature in Fig. 5, as these are closest to equilibrium. For this purpose, the lowest measured temperature in the catalyst bed was used. Fig. 5 clearly shows that both DRM measurements at 800 °C and at 900 °C were below the thermodynamic equilibrium conversion.
The catalysts with Ni contents of 25 and 50 mol% were additionally tested in long-term measurements for 100 h at 900 °C after optimized maximum temperatures of pre-treatment of TRed = 850 °C for 25 mol% and TRed = 800 °C for 50 mol%. Both catalysts showed remarkable stability during the DRM as a function of time. For the catalyst with 50 mol% Ni, a degree of conversion of 94% of the initial conversion was detected after 100 h of DRM, while the stability of the 25 mol% Ni catalyst was even higher, amounting to 98% of the initial conversion.
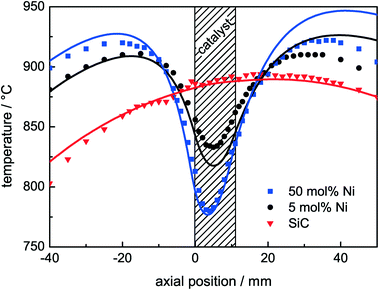
3.3 Temperature profiles
To assess the influence of the high endothermicity of the DRM (eqn (1)), axial temperature profiles of the catalyst bed were measured under reaction conditions. The profiles were determined after 1 h of DRM at 900 °C and during the catalytic tests after the reductive pre-treatment up to 1000 °C. With the exception of the 1 mol% Ni sample, steady-state conditions were achieved for all catalysts (Fig. 4). Three temperature profiles are shown in Fig. 6: a profile of pure SiC under DRM conditions and the profiles of the catalysts with Ni contents of 5 mol% for medium activity and 50 mol% for high activity under DRM conditions (Table 3). The recorded temperatures are plotted as a function of the axial position with respect to the beginning of the catalyst bed at 0 mm. As verified by the temperature profile of pure SiC, a homogeneous and due to the heat up of the feed gas asymmetric temperature distribution was established in the fixed bed by the furnace. For the active catalysts, the formation of significant cold spots was observed: for 5 mol% Ni ΔT > 80 °C and for 50 mol% Ni ΔT > 130 °C. This temperature gradient lowered the temperature even in the pre-catalyst region. As expected for an endothermic reaction, the temperature difference in the cold spot became larger with increasing conversion of methane. The control thermocouple of the furnace was placed close to the catalyst bed in the annular gap between the quartz reactor and the heater. The large temperature gradient in the catalyst bed led to a lower measured temperature at the control thermocouple. For this reason, the furnace adjusted the temperature and the temperature profile was shifted to higher temperatures. Therefore, temperatures slightly higher than 900 °C were detected in the pre-catalyst zone for the active catalysts.The measured axial temperature profiles were compared to the simulated ones (Fig. 6). The axial position of the simulated profiles was adjusted such that the turning point matches with the measurements. The simulations of the temperature profiles are in good agreement with the measured temperatures reproducing the qualitative and the quantitative characteristics of the temperature profiles with a maximum deviation of 15 °C close to the fixed-bed area. The model accurately describes the pre-heating phase in front of the bed and the temperature drop in the catalyst bed. The simulation showed further that due to the strong influence of thermal radiation, the lowest temperature in the catalyst bed is not the measured one (radial center of the reactor), but can be located in the radial center of the annular catalyst bed. The temperature difference between the measured and the simulated lowest temperature was detected to be only 5 °C. The heat is transported via two ways: the major part is the heat transfer from the quartz reactor into the SiC, and the minor part is from the ceramic tube into the SiC. In the catalyst bed and the pre-heating zone, conduction is the dominant mechanism, whereas the radiative heat transfer merely controls the bed and the gas temperature indirectly by heating up the aluminium oxide and the quartz tube. For the simulation of the temperature profiles, a simple extension of the Richardson kinetics was used to apply the Rh-based kinetics to our Ni-based catalysts. The catalytic activity was multiplied by a constant factor of 16 in the case of 50 mol% Ni and by a factor of 6 in the case of the 5 mol% Ni catalyst. It is worth noting that the investigated Ni-based catalysts are much more active than what Richardson kinetics27 based on Rh catalysts predicts.
3.4 TPO experiments
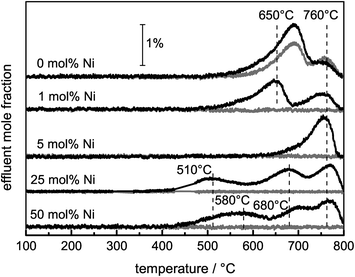
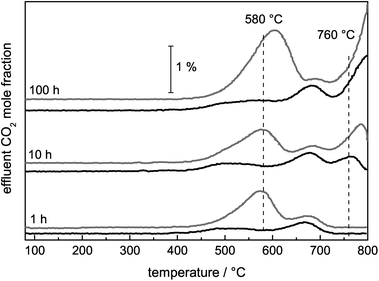
Ni catalysts tend to form coke deposits during the DRM, which can lead to fast deactivation. To investigate the carbon deposits, temperature-programmed oxidation was applied, and the amounts of O2 consumed and COx formed during a TPO experiment were used as a measure of the amount of carbon deposited during the DRM. Although the catalysts did not show significant deactivation during the DRM, the consumption of O2 and the simultaneous formation of COx due to the removal of carbonaceous species were detected for all samples (eqn (6)). Due to the re-oxidation of Ni, the consumption of O2 is not a suitable measure for the formed carbon deposits during DRM. Therefore, C equivalents were calculated as the sum of the formed COx species. In the presence of Ni, the carbon formation was suppressed compared with the pure support (0 mol% Ni). For Ni contents higher than 1 mol%, the amount of carbon formed can be correlated with the degree of methane conversion during the DRM (Table 2).Depending on the composition of the sample, total and partial oxidation of the carbonaceous deposits were observed. During the TPO experiments with pure MgAlOx and SiC, the formation of CO2 and CO occurred, while for the Ni-containing catalysts exclusively the formation of CO2 was detected due to Ni-catalyzed CO oxidation. In the TPO profiles shown in Fig. 7, different peaks can be detected, which are assigned to carbon deposits differing in their stability under oxidizing conditions. The TPO profiles of pure MgAlOx and 1 mol% Ni contain two peaks with comparable burn-off temperatures. In the presence of Ni, the maximum of the first peak was shifted from 690 to 650 °C. Furthermore, the intensity of this shifted peak was lowered significantly. Simultaneously, the overall amount of removed C was lower compared with the Ni-free sample. For the catalyst with 5 mol% Ni, only one peak at 760 °C was found. In the rather similar TPO profiles of the catalysts containing 25 mol% and 50 mol% Ni, three peaks appeared. The first one was observed in the temperature range between 450 and 570 °C, the second one between 650–700 °C, and the last one at 770 °C.
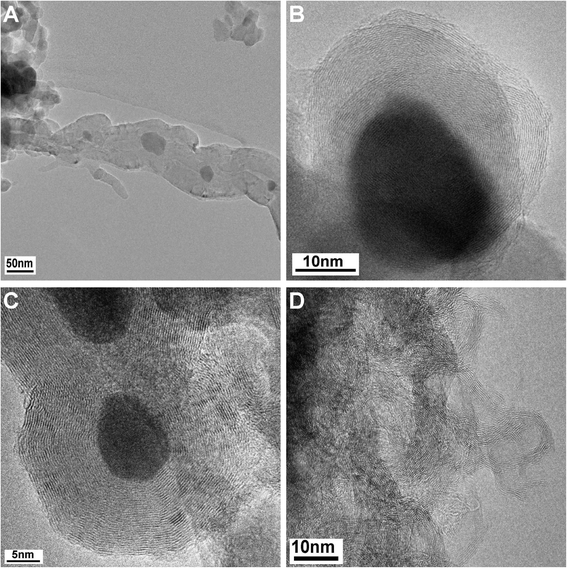
For the assignment of the different TPO peaks, several approaches were used. TEM micrographs of spent samples revealed the presence of different carbon species as a function of the Ni content as expected from the TPO profiles. The micrographs of the 25 and 50 mol% Ni catalysts show mainly graphite as well as filamentous carbon, i.e. multi-walled carbon nanofibers (CNFs, Fig. 8A and B). For the 5 mol% Ni catalyst, mainly graphitic carbon and no filaments were found (Fig. 8C), which is in agreement with the TPO profile showing only one major signal at 760 °C. The Ni-free sample led to the formation of far less ordered graphitic carbon layers (Fig. 8D), in agreement with its TPO profile showing an additional signal at lower temperatures compared to the 5 mol% Ni catalyst. Based on the local microscopy observations, the presence of less ordered graphite cannot be excluded for the catalysts with ≥5 mol% Ni.
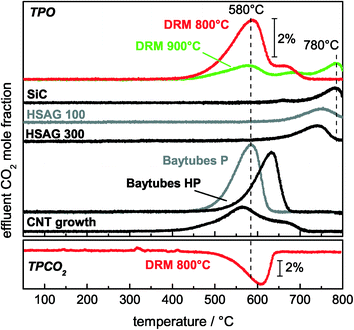
To clarify the correlation between the different carbon species detected by TEM and the TPO peaks, TPO experiments after a blank experiment, a CNF growth experiment, and TPO experiments with commercially available carbon reference materials were carried out. After the DRM blank experiment, only one peak at Tmax = 760 °C was observed during the subsequent TPO (Fig. 9). For the HSAG samples with different surface areas, it was found that these metal-free graphite powders showed burn-off temperatures higher than 700 °C, which increased with decreasing surface area (Fig. 9). These observations are in good agreement with results obtained by Gaur et al.43 and Serrano-Lotina et al.,44 who found burn-off temperatures of graphite at temperatures higher than 675 °C. Thus, the high-temperature TPO peak found after the DRM blank experiment is assigned to graphite on the diluent originating from methane pyrolysis.
Furthermore, TPO experiments with commercially available CNFs showed a strong influence of the residual amount of the metallic growth catalyst on the oxidation kinetics (Fig. 9). The metal residues in Baytubes C70 P lowered the burn-off temperature by 50 °C from 630 °C to 580 °C, and the same trend was found by Becker et al.45 A TPO profile after a CNT growth experiment using the 50 mol% Ni catalyst showed a clear peak at 580 °C with a shoulder at higher temperatures (Fig. 9). This burn-off temperature is in very good agreement with the TPO profile of metal-containing CNFs. Therefore, the peak at 580 °C originates from the catalyzed total oxidation of CNFs.
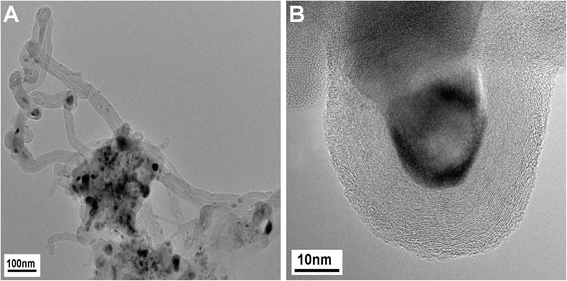
Additionally, the TEM micrographs of the sample used in the CNF growth experiment showed that in addition to CNFs, graphite-encapsulated Ni particles were formed in low amounts during the growth experiment (Fig. 10). On the basis of the previous assignment of the peak at 580 °C to the catalytic total oxidation of CNFs, these encapsulating graphite deposits should cause the shoulder at the high-temperature side (680–700 °C) in the TPO profile after CNT growth and DRM at 800 °C (Fig. 9). In summary, based on the TEM and TPO results, the peak at 580 °C is assigned to the catalyzed oxidation of CNFs, the peak between 650–690 °C to the removal of encapsulating graphite detected for the catalysts with ≥5 mol% Ni and less ordered graphitic carbon for ≤1 mol% Ni, and the peak at 760 °C to the non-catalyzed oxidation of low-surface area graphite.
3.5 Deactivation studies
For the identification of the carbon species that lead to deactivation, the stabilities during DRM were correlated with the subsequent TPO profiles. After a reductive pre-treatment with optimized maximum temperatures for 25 and 50 mol% Ni, as previously used during the long-term measurements, the DRM reaction was performed at 900 °C for 1, 10, and 100 h. Thereby, the consecutive formation of the carbon deposits was observed by TPO for both catalysts (Fig. 11). Initially, CO2 formation was observed between 500–700 °C, attributed to the removal of CNFs based on the established assignment. When performing the reaction for 10 and 100 h, the formation of graphite based on the pyrolysis of CH4 took place to a larger extent. The formation of the pyrolytic graphite was much more pronounced during the long-term measurements than the formation of other carbon species without much differences for both catalysts.The TPO profiles looked nearly identical, but the intensity of the CNF oxidation peak at 580 °C was different (Fig. 11). For the catalyst with the higher Ni content, the amount of CNFs removed by TPO after 100 h on stream was slightly higher than for the 25 mol% Ni catalyst. During the corresponding DRM measurements, different stabilities were observed as well. The methane conversion after 100 h of DRM compared to the initial one was higher for the 25 mol% Ni catalyst amounting to 98% than the conversion of the highly loaded catalyst with 94%. Furthermore, as already presented in ref. 22 for the 50 mol% Ni catalyst, the CNT peak was dominant in the TPO profile after DRM at 800 °C. The formation of low surface area graphite (TPO peak 760 °C) was only observed during the DRM at 900 °C. In addition, the higher temperature resulted in higher stability in the corresponding DRM experiments. Therefore, graphite originating from methane pyrolysis cannot be the main deactivating carbon species, because it was not formed during the DRM at 800 °C and the amounts of graphite were similar after 100 h on stream for the 25 mol% and the 50 mol% Ni catalysts at 900 °C. It is reasonable to assume that the formed graphite was not blocking the active Ni sites, but was located on the oxide matrix, the inner reactor wall, the SiC particles or the quartz wool. The major difference in the presented TPO profiles (Fig. 7) was the amount of CNFs. This observation points to a correlation between the stability during the DRM and the amount of formed CNFs; the higher amount formed at the lower reaction temperature and during 100 h of the DRM at 900 °C suggests that CNFs are the most deactivating carbon species.
3.6 Regeneration of the catalyst
The catalytic DRM activity can be recovered by removing the deposited carbon species, as shown by performing the DRM subsequent to a TPO experiment.22 Instead of O2, the carbon species can also be removed by CO2 according to the Boudouard reaction (eqn (3)). A slight shift to higher burn-off temperatures was observed when the TPO experiment was performed with CO2 instead of O2 (Fig. 9, bottom), whereas the effect on the catalytic activity was identical. In addition to the temperature-programmed mode, this regeneration can be performed in an isothermal way at the reaction temperature by changing the feed gas composition to CO2 and Ar only (Fig. 12A). The latter can easily be achieved by stopping the feed of methane for 60 min, inducing the removal of carbonaceous deposits by CO formation. After stopping the feed of CH4, initially a fast drop of the effluent mole fractions of CO and CO2 was observed. Thereafter, a slight increase in the effluent mole fraction of CO2 was detected, whereas a slight decrease of CO was observed. After 12 min, no further CO2 consumption and CO formation was observed, indicating complete removal of the carbonaceous deposits (Fig. 12B). Subsequent to the removal of carbonaceous deposits, methane can be added again, resulting in an increase in the effluent mole fraction of CO due to the ongoing DRM. After the regeneration, the initial activity is regained due to complete removal of carbonaceous deposits (Fig. 12A).4 Conclusions
The synthesis of hydrotalcite-like precursors for DRM catalysts is an effective route to obtain highly active and stable catalysts with different Ni contents. These catalysts with efficiently embedded Ni nanoparticles show outstanding stabilities in the high-temperature dry reforming reaction at 900 °C. Measured axial temperature profiles as well as CFD simulations demonstrated the strong influence of the endothermic DRM on the temperature gradient in the catalyst bed. During the reaction, different carbon species were formed, depending on the metal loading and the reaction temperature. At a higher temperature, the formation of non-deactivating graphite originating from methane pyrolysis is enhanced, whereas at lower temperature the formation of CNFs is favored, causing the continuous deactivation with time on stream. It was shown that the carbon species can easily be removed by O2 and CO2 either isothermally or using a temperature ramp to re-establish the original methane conversion.Acknowledgements
The investigations were performed within the scope of the joint research project CO2RRECT, which aims at the utilization of CO2 using regenerative energies for the production of value-added chemicals. Financial support was provided by the Federal Ministry of Education and Research of Germany (BMBF, FKZ 01RC1006). The authors thank Robert Schlögl for his support and valuable discussions.References
- K. Tomishige, M. Nurunnabi, K. Maruyama and K. Kunimori, Fuel Process. Technol., 2004, 85, 1103 CrossRef CAS PubMed.
- L. Yuliati and H. Yoshida, Ind. Eng. Chem. Res., 2008, 37, 1592 CAS.
- J. H. Butler, http://www.esrl.noaa.gov/gmd/aggi/.
- A. Holmen, Catal. Today, 2009, 142, 2 CrossRef CAS PubMed.
- T. V. Choudhary and V. R. Choudhary, Angew. Chem., Int. Ed., 2008, 47, 1828 CrossRef CAS PubMed.
- L. Kahle, T. Roussiere, L. Maier, K. H. Delgado, G. Wasserschaff, S. A. Schunk and O. Deutschmann, Ind. Eng. Chem. Res., 2013, 52, 11920 CrossRef CAS.
- Z. Jiang, T. Xiao, V. L. Kuznetsov and P. P. Edwards, Philos. Trans. R. Soc., A, 2010, 368, 3343 CrossRef CAS PubMed.
- K. Wang, X. Li, S. Ji, B. Huang and C. Li, ChemSusChem, 2008, 1, 527 CrossRef CAS PubMed.
- V. Havran, M. P. Duduković and C. S. Lo, Ind. Eng. Chem. Res., 2011, 50, 7089 CrossRef CAS.
- J. Wei and E. Iglesia, Ind. Eng. Chem. Res., 2011, 50, 7089 CrossRef.
- D. Baudouin, U. Rodemerck, F. Krumeich, A. D. Mallmann, K. C. Szeto, H. Ménard, L. Veyre, J. P. Candy, P. B. Webb, C. Thieuleux and C. Copéret, J. Catal., 2013, 297, 27 CrossRef CAS PubMed.
- T. Wurzel, S. Malcus and L. Mleczko, Chem. Eng. Sci., 2000, 55, 3955 CrossRef CAS.
- C. H. Bartholomew, Appl. Catal., A, 2001, 212, 17 CrossRef CAS.
- D. San José-Alonso, M. J. Illán-Gómez and M. C. Román-Martínez, Int. J. Hydrogen Energy, 2013, 38, 2230 CrossRef PubMed.
- J. Newnham, K. Mantri, M. Amin, J. Tardio and S. Bhargava, Int. J. Hydrogen Energy, 2012, 37, 1454 CrossRef CAS PubMed.
- V. Choudhary, B. Uphade and A. Mamman, Appl. Catal., A, 1998, 168, 33 CrossRef CAS.
- J. Claridge, A. York, A. J. Brungs, C. Marquez-Alvarez, J. Sloan, S. Chi Tsang and M. L. Green, J. Catal., 1998, 180, 85 CrossRef CAS.
- A. I. Tsyganok, T. Tsunoda, S. Hamakawa, K. Suzuki, K. Takehira and T. Hayakawa, J. Catal., 2003, 213, 191 CrossRef CAS.
- V. R. Choudhary and A. M. Rajput, Ind. Eng. Chem. Res., 1996, 35, 3934 CrossRef CAS.
- A. Horváth, G. Stefler, O. Geszti, A. Kienneman and A. G. L. Pietraszek, Catal. Today, 2011, 169, 102 CrossRef PubMed.
- D. Liu, X. Y. Quek, W. N. Cheo, R. Lau, A. Borgna and Y. Yang, J. Catal., 2009, 266, 380 CrossRef CAS PubMed.
- K. Mette, S. Kühl, H. Düdder, K. Kähler, A. Tarasov, M. Muhler and M. Behrens, ChemCatChem, 2014, 6, 100 CrossRef CAS.
- Chemical Energy Storage, ed. R. Schlögl, de Gruyter, Berlin/Boston, 2013 Search PubMed.
- K. Kugler, H. F. Niessen and K. A. Theis, Nucl. Eng. Des., 1975, 34, 65 CrossRef.
- T. A. Chubb, Chem. Tech., 1976, 6, 654 CAS.
- G. DeMaria, L. D'Alessio and C. A. Tiberio, Sol. Energy, 1985, 35, 409 CrossRef CAS.
- J. T. Richardson and S. A. Paripatyadar, Appl. Catal., 1990, 61, 293 CrossRef CAS.
- S. Sharma, Z. Hu, P. Zhang, E. McFarland and H. Metiu, J. Catal., 2011, 278, 297 CrossRef CAS PubMed.
- T. Shishido, M. Sukenobu, H. Morioka, R. Furukawa, H. Shirahase and K. Takehira, Catal. Lett., 2001, 73, 21 CrossRef CAS.
- K. Takehira, T. Shishido, P. Wang, T. Kosaka and K. Takaki, Phys. Chem. Chem. Phys., 2003, 5, 3801 RSC.
- K. Takehira, T. Shishido, P. Wang, T. Kosaka and K. Takaki, J. Catal., 2004, 221, 43 CrossRef CAS PubMed.
- K. Takehira, T. Shishido, D. Shouro, K. Murakami, M. Honda, T. Kawabata and K. Takaki, Appl. Catal., A, 2005, 279, 41 CrossRef CAS PubMed.
- K. Takehira, T. Kawabata, T. Shishido, K. Murakami, T. Ohi, D. Shoro, M. Honda and K. Takaki, J. Catal., 2005, 231, 92 CrossRef CAS PubMed.
- O. W. Perez-Lopez, A. Senger, N. R. Marcilio and M. A. Lansarin, Appl. Catal., A, 2006, 303, 234 CrossRef CAS PubMed.
- M. Fadoni and L. Lucarelli, Stud. Surf. Sci. Catal., 1999, 123, 289 CrossRef.
- O. F. Schlüter, B. I. Wehner, D. Hu, W. Xia, T. Quandt, G. Marginean, W. Brandl and M. Muhler, Appl. Catal., A, 2004, 274, 71 CrossRef PubMed.
- M. Nijemeisland, A. G. Dixon and E. H. Stitt, AIChE J., 2004, 50, 906 CrossRef CAS.
- H. P. Calis, J. Nijenhuis, B. C. Paikert, F. M. Dautzenberg and D. M. van den Bleek, Chem. Eng. Sci., 2001, 56, 1713 CrossRef CAS.
- H. A. Jakobsen, H. Lindbor and V. Handeland, Comput. Chem. Eng., 2002, 26, 333 CrossRef CAS.
- X. Gao, Y. P. Zhu and Z. H. Luo, Chem. Eng. Sci., 2011, 66, 6028 CrossRef CAS PubMed.
- S. S. Elnashaie and S. S. Elshishini, Chem. Eng. Sci., 1993, 48, 567 CrossRef CAS.
- D. A. Monti and A. Baiker, J. Catal., 1983, 83, 323 CrossRef CAS.
- S. Gaur, D. J. Haynes and J. J. Spivey, Appl. Catal., A, 2011, 403, 142 CAS.
- A. Serrano-Lotina, L. Rodríguez, G. Muñoz, A. J. Martin, M. A. Folgado and L. Daza, Catal. Commun., 2011, 12, 961 CrossRef CAS PubMed.
- M. J. Becker, W. Xia, J. P. Tessonnier, R. Blume, L. D. Yao, R. Schlögl and M. Muhler, Carbon, 2011, 49, 5253 CrossRef CAS PubMed.
| This journal is © The Royal Society of Chemistry 2014 |

