Silicon–nickel intermetallic compounds supported on silica as a highly efficient catalyst for CO methanation†
Xiao
Chen
a,
Jianhui
Jin
a,
Guangyan
Sha
a,
Chuang
Li
a,
Bingsen
Zhang
b,
Dangsheng
Su
b,
Christopher T.
Williams
*c and
Changhai
Liang
*a
aLaboratory of Advanced Materials and Catalytic Engineering, School of Chemical Engineering, Dalian University of Technology, Dalian 116024, China. E-mail: changhai@dlut.edu.cn; Web: http://finechem.dlut.edu.cn/liangchanghai Fax: +86 411 84986353
bShenyang National Laboratory for Materials Science, Institute of Metal Research, Chinese Academy of Sciences, Shenyang 110016, China
cDepartment of Chemical Engineering, Swearingen Engineering Center, University of South Carolina, SC 29208, USA. E-mail: willia84@cec.sc.edu; Web: http://www.che.sc.edu/faculty/williams Fax: +1 803 777 8265
First published on 8th November 2013
Abstract
Silicon–nickel intermetallic compounds (IMCs) supported on silica (Si–Ni/SiO2), as a highly efficient catalyst for CO methanation, have been prepared by direct silicification of Ni/SiO2 with silane at relatively low temperature in a fluidized bed reactor. The as-prepared materials were characterized by X-ray diffraction, transmission electron microscopy, in situ FT-IR of CO adsorption, and H2-temperature programmed reduction-mass spectrometry (TPR-MS) of CO. The results indicate that uniform NiSix nanoparticles with about 3–4 nm are evenly dispersed on silica. The combined in situ FTIR and TPR-MS results suggest that the Si–Ni/SiO2 catalysts afforded high activity in CO methanation, promoting the formation of CH4 at ca. 240 °C. The catalytic hydrogenation of CO on Si–Ni/SiO2 was investigated in a fixed-bed reactor at GHSVs 48![[thin space (1/6-em)]](https://www.rsc.org/images/entities/char_2009.gif) 000 mL h−1 g−1 under 1 atm in the temperature interval 200–600 °C. In the higher temperature reaction region (500–600 °C), it is notable that the Si–Ni/SiO2 catalysts present high activity for CO methanation as compared to the Ni/SiO2 catalyst. More importantly, the Si–Ni/SiO2-350 catalyst containing thermally stabile Si–Ni IMCs shows significantly higher resistance to the sintering of Ni particles. Raman characterization of the spent materials qualitatively shows that carbon deposition observed on the conventional Ni/SiO2 catalyst is much higher than that of the used Si–Ni/SiO2-350. It is proposed that small amounts of silicon interacting with Ni atoms selectively prevent the adsorption of resilient carbon species.
000 mL h−1 g−1 under 1 atm in the temperature interval 200–600 °C. In the higher temperature reaction region (500–600 °C), it is notable that the Si–Ni/SiO2 catalysts present high activity for CO methanation as compared to the Ni/SiO2 catalyst. More importantly, the Si–Ni/SiO2-350 catalyst containing thermally stabile Si–Ni IMCs shows significantly higher resistance to the sintering of Ni particles. Raman characterization of the spent materials qualitatively shows that carbon deposition observed on the conventional Ni/SiO2 catalyst is much higher than that of the used Si–Ni/SiO2-350. It is proposed that small amounts of silicon interacting with Ni atoms selectively prevent the adsorption of resilient carbon species.
Introduction
Natural gas is often used for producing heat and power and applied as a fuel in the transport sector. CO methanation as an option for producing substitute natural gas (SNG) from coal or biomass has attracted much attention, due to its potential to replace oil products for transportation and other uses.1,2Scheme 1 shows the block diagram of the progress from coal or biomass to SNG. The former can be gasified to syngas and then further hydrogenated according to the methanation reactions to SNG.3–5 CO methanation to SNG is the simplest reaction in Fischer–Tropsch synthesis. The reaction equation is described as follows: CO + H2 = CH4 + H2O (ΔH°298 K = −206 KJ mol−1).1,6 The methanation reaction has high calorific value, a single type of product and high conversion, along with having an excellent economic benefit, being environmentally friendly and exhibiting process simplicity. However, the catalysts in this reaction process are not only easily poisoned due to the high CO concentration, but also deactivate by carbon deposition at the high temperature (>400 °C).7–10 Therefore, the key for CO methanation is the development of catalysts with high activity at low temperature and high thermal stability at elevated temperature, while offering superior resistance to H2S and CO poisoning.The group VIII metals Ru, Fe, Co, and Ni have been employed as the major active components for CO methanation catalysts to date, but there are many existing problems. Ru is known to be a highly efficient catalyst for the removal of carbon oxides from inlet streams in hydrogen or ammonia plants.11 However, the active sites are easily lost in high concentration CO due to the formation of sublimed Ru(CO)x during the reaction.12 Iron is usually much less active and more prone to carbon deposition.13 Co-based catalysts have good stability but they afford poor selectivity to methane.14 Ni-based catalysts are widely applied in methanation reaction because of their initially high activity. However, they are less resistant to deactivation due to coke and/or sulfur on the metallic Ni surface, high-temperature sintering, and the easy removal of Ni from the support as volatile Ni(CO)4 under reaction conditions.9,15 Therefore, the research and development of novel highly efficient catalysts for CO methanation is of significant interest in the chemical industry.
Due to the dissolution of silicon atoms into metal lattices, transition metal silicides have specific crystal and electronic structures different from that of the corresponding metal, leading to unique physical and chemical properties. These include good electrical conductivity, high chemical inertness, thermal stability, and superior resistance to H2S poisoning.16,17 These properties suggest that such materials may be particularly rugged enough for the harsh environment of CO methanation. However, in past research, transition metal silicides were mainly applied as catalysts in hydrogenation reactions for tuning the selectivity towards target products through the formation of silicon–metal intermetallic compounds.18–22 Nevertheless, there has been a literature report dealing with the effective use of intermetallic compounds of the formula MNi5 as methanation catalysts.23 Thus, it is interesting to explore the stability and catalytic activity of metal silicides for CO methanation.
In this work, we report the preparation and characterization of various Si–Ni intermetallic compounds (IMCs) supported on silica, and their evaluation as catalysts for CO methanation. The results demonstrate that Si–Ni/SiO2 possesses efficient catalytic activity and high-temperature stability compared with conventionally reduced Ni catalyst. More importantly, silicon promotion was found to prevent the adsorption of residual carbon species, without affecting the initial activity or selectivity.
Experimental
Catalyst preparation
Si–Ni IMCs supported on silica were prepared by the reaction of Ni/SiO2 with a gas mixture containing silane and hydrogen in a fluidized bed reactor. Typically, 20% NiO deposition onto the silica support (SBET 596 m2 g−1, pore volume 0.33 cm3 g−1) was achieved by precipitation of nickel acetylacetonate dissolved in ethylene glycol with sodium carbonate aqueous solution at 120 °C and then thermal calcination in air at 400 °C for 2 h. The NiO/SiO2 sample (0.30 g) was further reduced with hydrogen (30 sccm) at 350 °C for 3 h and then silicified by 10 vol.% SiH4 in H2 with 100 sccm flow rate at 1 atm at temperatures of 250, 350, and 450 °C. Then the product was passivated in 1% O2–Ar overnight. The obtained solids were designated as Si–Ni/SiO2-Ts, where Ts referred to the silicification temperature.Characterization
The surface area, pore volume, and pore size distribution of the support and catalysts were determined from nitrogen adsorption–desorption isotherms at −196 °C using an Autosorb-iQ (Quantachrome Instrument, U.S.). Prior to the measurements, all samples were degassed at 300 °C at 10−3 Torr for at least 3 h. The surface areas were calculated from the linear part of the Brunauer–Emmett–Teller (BET) plots. The pore volume and the pore size distribution were derived from the desorption profiles of the isotherms using the Non Local Density Functional Theory (NLDFT) method.X-Ray diffraction (XRD) patterns were recorded on a Rigaku D/Max-RB diffractometer with a Cu Kα monochromatized radiation source, operated at 40 kV and 100 mA. Diffraction data were collected between 5° and 90° (2θ) with a resolution of 0.02°. The average size of Si–Ni IMC particles was evaluated by the Scherrer formula as follows:
 | (1) |
Transmission electron microscopy (TEM) was performed using a Philips CM200 FEG transmission electron microscope (accelerating voltage 200 kV) with high-resolution imaging. Powder samples were ultrasonicated in ethanol and dispersed on copper grids covered with a holey carbon film.
In situ FTIR spectra were recorded using a Nicolet Nexus 470 spectrometer equipped with mercury–cadmium–telluride B (MCT-B) detector cooled by liquid nitrogen. FTIR spectra were collected in single beam absorbance mode with a resolution of 4 cm−1. Before characterization, the sample (about 0.02 g) was compressed into a self-supporting disc. The sample was reduced in H2 (100 sccm) for 2 h at 400 °C, and then cooled down to 25 °C in He, at which point a background spectrum was acquired. The sample was then exposed to 1% CO in He (100 sccm). After 30 min, the flow cell was purged with pure He to remove any physisorbed and gas-phase CO. The spectra of CO chemisorption on the sample were taken, while the He gas was switched to H2 (100 sccm) and the temperature increased from RT to 400 °C with a ramp of 5 °C min−1. To distinguish between desorption and methanation of CO with increasing temperature, the temperature-programmed desorption FTIR (TPD-FTIR) in He was also carried out.
In the H2-temperature programmed reduction-mass spectrometry (TPR-MS) of CO, the sample was reduced at 400 °C in 10% H2–He for 3 h, and then cooled down in He. CO was introduced into the reactor to adsorb on the surface of the catalyst at 25 °C and 1 × 10⁻⁶ Torr. The gas phase CO was removed by flowing He through the reactor. H2-temperature programmed reduction was performed at 100 sccm flow (10% H2 in He) at a ramp rate of 10 °C min−1 from 25 to 400 °C. The gaseous effluent from the reactor was monitored by a mass spectrometer.
Raman spectra were recorded on a Thermo DXR Raman microscope at room temperature using a 532 nm laser excitation line and constant power of 10 mW. The resolution of all measured spectra was 4 cm−1. The average spectral resolution in the Raman shift range of 50–3000 cm−1 was 5 cm−1 (grating 900 lines per mm).
CO methanation measurements
The evaluation of CO methanation performance was carried out in a continuous flow fixed bed reactor made of stainless steel with a diameter of 8 mm within the temperature range 200–600 °C and 1 atm. The reaction temperature was measured with an interior placed thermocouple in direct contact with the catalyst bed. Prior to the activity test, the passivated catalysts (0.25 g, diluted with quartz sand to 5 mL) were activated in situ with 30% H2–Ar at 450 °C for 2 h. The mixed reactant gas with a molar ratio of H2/CO = 3![[thin space (1/6-em)]](https://www.rsc.org/images/entities/char_2009.gif) :
:![[thin space (1/6-em)]](https://www.rsc.org/images/entities/char_2009.gif) 1 and the internal standard gas (Ar) for gas chromatography (GC) analysis were introduced into the reactor at a gas hourly space velocity (GHSV) of 48
1 and the internal standard gas (Ar) for gas chromatography (GC) analysis were introduced into the reactor at a gas hourly space velocity (GHSV) of 48![[thin space (1/6-em)]](https://www.rsc.org/images/entities/char_2009.gif) 000 mL h−1 g−1. The reaction temperature was controlled by the heat controller with the heating rate of 2 °C min−1. The outlet product gas steam was cooled down and analysed online using a GC with a thermal conductivity detector (TCD). CO conversion and CH4 selectivity are defined as follows:
000 mL h−1 g−1. The reaction temperature was controlled by the heat controller with the heating rate of 2 °C min−1. The outlet product gas steam was cooled down and analysed online using a GC with a thermal conductivity detector (TCD). CO conversion and CH4 selectivity are defined as follows: | (2) |
 | (3) |
Results and discussion
Synthesis of Si–Ni/SiO2 catalysts
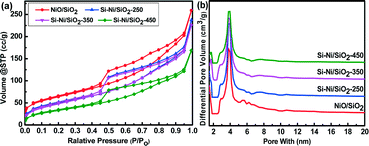
Fig. 1a shows the N2 adsorption–desorption isotherms of NiO/SiO2 and Si–Ni/SiO2-Ts samples prepared at 250, 350, and 450 °C. The corresponding structural parameters are summarized in Table 1. Adsorption–desorption isotherms of NiO/SiO2 and Si–Ni/SiO2 samples show type IV behavior with an H1 hysteresis loop according to IUPAC classification.24 The structure of the Si–Ni/SiO2 samples is consistent with that of NiO/SiO2, indicating that the structure was not destroyed during the silicification process. The hysteresis loops showed sharp adsorption and desorption branches in the P/P0 range from 0.4 to 0.9 indicating a narrow mesopore size distribution. As shown in Table 1, the surface area decreased from 227 to 125 m2 g−1 and the pore volume decreased from 0.4 to 0.26 cm3 g−1, while the average pore size were almost unchanged, remaining at 3.9 nm after silicification at all temperatures. This can be attributed to formation of Si–Ni IMC particles that fill and block a fraction of the SiO2 pores and growth in Si–Ni IMC particle sizes with the increasing silicification temperature.20| Sample | IMC phases | S BET (m2 g−1) | Average pore size (nm) | Pore volume (cm3 g−1) | H2 uptake (μmol g−1) | Particle size (nm) |
|---|---|---|---|---|---|---|
| NiO/SiO2 | — | 227 | 3.8 | 0.40 | 76.4 | 2 |
| Si–Ni/SiO2–250 | Ni2Si, NiSi | 182 | 3.9 | 0.37 | 76.7 | 2 |
| Si–Ni/SiO2–350 | Ni2Si, NiSi, NiSi2 | 181 | 3.9 | 0.35 | 76.7 | 3 |
| Si–Ni/SiO2–450 | NiSi, NiSi2 | 125 | 3.9 | 0.26 | 88.4 | 3 |
XRD patterns of the Si–Ni/SiO2-Ts samples with 20% loadings prepared at different silicification temperatures and Si–Ni/SiO2-450 with different loadings are shown in Fig. 2. A broad SiO2 diffraction peak at about 23.4° can be detected. As shown in Fig. 2a, while the peak at ca. 45° is due to Ni, diffraction peaks due to Si–Ni IMCs are not detected. This suggests the formation Si–Ni IMCs highly dispersed on SiO2 with low crystallinity. The estimated average sizes of the particles are ca. 3 nm (as summarized in Table 1). XRD patterns of the Si–Ni/SiO2-450 with higher loadings are further conducive to identifying the phase of Si–Ni/SiO2 catalysts (as shown in Fig. 2b). The crystalline phase was identified by comparison with the JCPDS file (NiSi2, cubic, no 43-0989). Upon increasing the loadings from 20% to 40%, four new diffraction peaks at 28.60, 47.41, 56.33, and 76.59° are observed, which can be attributed to the NiSi2 lattice planes (111), (220), (311), and (331) respectively. In addition, the Ni3Si2O5(OH)4 phase can be observed in the Ni/SiO2 sample, which can be attributed to the in situ reaction between SiO2 and Ni2+ salt during the precipitation as follows:25,26 2SiO2 + 3Ni2+ + 5H2O = Ni3Si2O5(OH)4 + 6H+. XRD results show that this phase is very stable during thermal calcination in air at 400 °C and reduction in H2 at 350 °C. Only some of Ni3Si2O5(OH)4 was reduced to metallic Ni phase (Fig. S1†). The peaks due to Ni3Si2O5(OH)4 at 35° and 62° vanished with the increasing silicification temperature, possibly due to the following chemical reaction: Ni3Si2O5(OH)4 + SiH4 → NiSix + SiO2 + H2O.
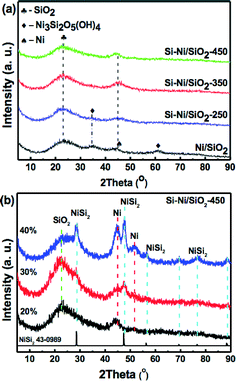 | ||
| Fig. 2 X-ray diffraction patterns of (a) Si–Ni/SiO2-Ts sample with 20% loadings prepared at different silicification temperature and (b) Si–Ni/SiO2-450 with different loadings. | ||
In addition, based on our previous research about the synthesis of bulk nickel silicides,19,27 the initially formed Ni2Si is further transformed through Si-enrichment into phases like NiSi or NiSi2 with the increase in silicification temperature from 250 to 450 °C. Therefore, we can deduce the IMC phases of Si–Ni/SiO2 catalysts prepared at different silicification temperature (as presented in Table 1).
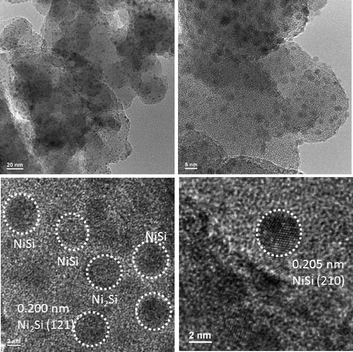
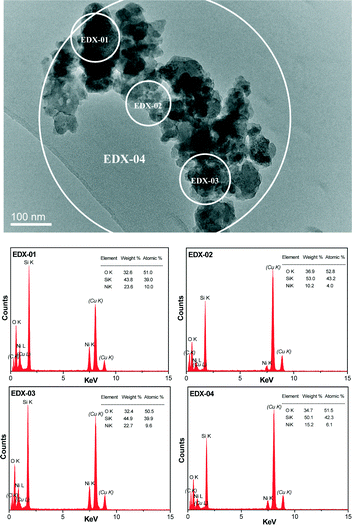
The crystalline nature and particle size of the Si–Ni/SiO2-350 sample were confirmed by TEM measurements. The TEM images in Fig. 3 show that uniform Si–Ni IMC nanoparticles with about 3–4 nm size are evenly dispersed on the silica. The high-resolution TEM image in Fig. 3 further confirms the formation of nickel silicide with 3 nm size, i.e., the lattice spacing of 0.200 nm corresponds to that of (121) planes of Ni2Si and the lattice spacing of 0.205 nm corresponds to that of (210) planes of NiSi.28,29 The EDX spectra shown in Fig. 4 further confirm the existence of Si and Ni elements in the samples. The Cu signals arise from the copper TEM grid and the peak of carbon is caused by contamination from irradiation of the electron beam. The typical STEM dark field image and corresponding elemental maps of the Si–Ni/SiO2-350 catalyst (Fig. 5) clearly show that Ni, Si, and O elements are well distributed in the sample, which may be demonstrated the existence of Si–Ni IMCs.
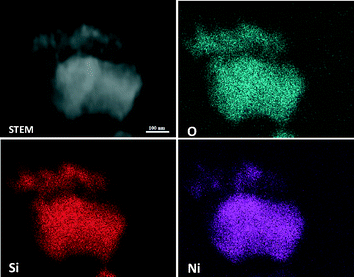 | ||
| Fig. 5 Representative STEM dark-field images and corresponding X-ray maps of O, Ni, and Si for Si–Ni/SiO2-350 sample. | ||
FTIR spectroscopic study of CO adsorption on Si–Ni/SiO2 catalysts
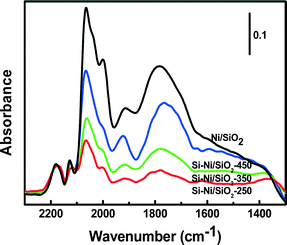
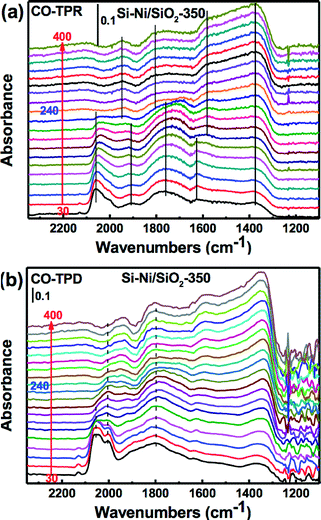
The local environment of Ni sites on Si–Ni/SiO2 samples can be probed by CO adsorption using FTIR spectroscopy, as shown in Fig. 6. The prominent bands centered around 2143 cm−1 are due to gas phase carbon monoxide.30 Adsorption of CO on Si–Ni/SiO2 samples at room temperature results in the two main bands at ca. 2060 and 2030 cm−1. These fall within the range of high frequency linear carbonyl species (2080–2040 cm−1), indicating the presence of subcarbonyl Ni(CO)n species on top of a single low-coordinated (corner, kink or step) Ni atoms due to strong interaction between Ni and Si.31 In addition, the peaks at ca. 1930 and 1760 cm−1, respectively, are attributed to Ni2CO bridged species and multibonded Ni4CO species that are preferentially formed on a bare Ni surface.32 After the silicification process, the intensity of absorbed CO significantly decreased compared with that observed on Ni/SiO2. This can be explained by the silicon withdrawing electrons from the less electronegative nickel substrate, thus decreasing π-back bonding between the Ni and CO.33 The resulting decrease in bond strength results in less strongly adsorbed CO.For the Si–Ni/SiO2 samples, the intensity of absorbed CO significantly increased with the increasing silicification temperature from 250 °C to 450 °C, especially the CO molecules absorbed on two or more Ni atoms at 1930 and 1760 cm−1. This is attributed to the modification of the Ni electronic states by the covalent bonding in Si–Ni IMCs.34 The stronger interaction of Si and Ni may promote the complex adsorption of CO, both through its C atom on reduced nickel and through its oxygen atom on the silicon species.35 In addition, the shift of the band around 1760 cm−1 to lower wavenumbers with the increasing temperature indicates that the active sites of Si–Ni are isolated.36
In order to investigate the reaction process on the catalyst surface under reaction conditions, temperature-programmed reaction FTIR (TPR-FTIR) in H2 and temperature-programmed desorption FTIR (TPD-FTIR) in He were used to characterize the Si–Ni/SiO2-350 sample (as shown in Fig. 7). The bonds of CO absorbed on the Si–Ni/SiO2-350 catalyst significantly changed during the heating. As shown in Fig. 7a, the linearly adsorbed CO band at 2060 cm−1 possesses the strongest absorbance initially, before weakening and slightly red shifting after the H2 introduction, and further decreasing with increasing temperature. However, as shown in Fig. 7b, increasing the temperature in He results in a significant decrease in the intensity of the higher frequency side of the broad band in the 2000–2060 cm−1 region. This is similar with FTIR studies of CO adsorption on Ru/SiO2 catalysts.37 The removal of linearly adsorbed CO is essentially the same for CO reaction with H2 and desorption in He. However, the intensity of absorbed bridged CO band at 1930 and 1760 cm−1 was decreased at around 200–260 °C in H2 but was unchanged in He.
These various changes of the IR bands reveal a strong modification of the Ni surface (i.e., reconstruction) during the CO adsorption and disproportionation.36 The presence of hydrogen during the measurement decreases slightly the coverages of the bridged CO species at high temperatures due to either a decrease in the heat of adsorption or the perturbation of the adsorption equilibrium by hydrogenation of the adsorbed CO species.38 All of the peaks of absorbed CO almost vanished at the reaction temperature of about 240 °C, which provides considerable evidence that CO hydrogenation is completed during the TPR. Thus, the following possible mechanism is indicated: 1) the gas phase CO initially absorbed on the surface of nickel silicide as linear-and bridge-type species; 2) the bridge-type CO was easily dissociated to Cs (adsorbed carbon) and CO2 on the surface of nickel silicide; and 3) the linear adsorbed CO and the Cs were then quickly reacted with dissociated hydrogen (Hs) to form the CH4.38,39
TPR-MS of CO on Si–Ni/SiO2 catalysts
The CO methanation using Si–Ni/SiO2 catalysts was further detected by the TPR-MS. The major gas phase products from TPR of the Si–Ni/SiO2-350 catalyst include CO, CH4, H2O, and CO2 (shown in Fig. 8a). The signal of mass 28, which includes a major contribution from N2 as well as perhaps some CO, drifted down continuously. However, the CO2 signal is almost invariant with increasing temperature and only the peaks of H2O and CH4 appeared at ca. 230 °C, as indicated by the consumption of syngas (CO and H2) and simultaneous generation of methane.40,41 In addition, the peak of H2O appearing at ca. 120 °C likely comes from desorption off of the support. Comparing the signals of TPR-MS for CO over the series of Si–Ni/SiO2 catalysts with the Ni/SiO2 (shown in Fig. 8b), the intensity of CH4 increased and shifted to lower temperature with the increasing silicification temperature due to the effect of silicon promotion on the Si–Ni/SiO2 catalysts. The doping of silicon into the Ni/SiO2 leads to the formation of Si–Ni IMCs and transformation of crystal and electronic structures.19 This in turn significantly enhances catalytic activity in CO methanation with respect to the reduced Ni/SiO2 catalyst. The results are therefore consistent with the data of in situ FT-IR.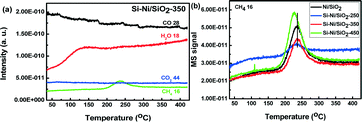 | ||
| Fig. 8 (a) Products response distribution from TPR-MS profile as a function of temperature; (b) CH4 response distribution from TPR-MS profile for Ni/SiO2 and the series of Si–Ni/SiO2 catalysts. | ||
CO methanation properties of Si–Ni/SiO2 catalysts
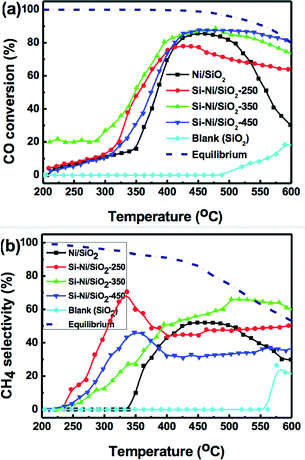
The catalytic properties of CO methanation on the series of Si–Ni/SiO2 catalysts at 1 atm and GHSV of 48![[thin space (1/6-em)]](https://www.rsc.org/images/entities/char_2009.gif) 000 mL h−1 g−1 between 200–600 °C were investigated, as shown in Fig. 9. To investigate the intrinsic catalytic performance of Si–Ni IMCs on the silica, there were no promoters or additives used. At 350 °C, for the series of Si–Ni/SiO2 catalysts silicified at 250, 350, and 450 °C, CO conversions were 48%, 53%, and 30%, respectively, and the selectivities to methane were 60, 45, and 30%, respectively. The other products are CO2, and a negligible amount of light alkane. In all cases, the CO conversion and CH4 selectivity for the Si–Ni/SiO2 catalysts at 350 °C were higher than Ni/SiO2 alone (16% conversion and 10% selectivity). As silicification temperature is increased, the activity of CO methanation first increases, followed by a dramatic decrease at the highest temperature. This trend can perhaps be explained by the varying electronic and geometrical structures present in these catalysts due to the formation of Si–Ni IMCs. This result is similar to that obtained for hydrogenation of the C
000 mL h−1 g−1 between 200–600 °C were investigated, as shown in Fig. 9. To investigate the intrinsic catalytic performance of Si–Ni IMCs on the silica, there were no promoters or additives used. At 350 °C, for the series of Si–Ni/SiO2 catalysts silicified at 250, 350, and 450 °C, CO conversions were 48%, 53%, and 30%, respectively, and the selectivities to methane were 60, 45, and 30%, respectively. The other products are CO2, and a negligible amount of light alkane. In all cases, the CO conversion and CH4 selectivity for the Si–Ni/SiO2 catalysts at 350 °C were higher than Ni/SiO2 alone (16% conversion and 10% selectivity). As silicification temperature is increased, the activity of CO methanation first increases, followed by a dramatic decrease at the highest temperature. This trend can perhaps be explained by the varying electronic and geometrical structures present in these catalysts due to the formation of Si–Ni IMCs. This result is similar to that obtained for hydrogenation of the C![[double bond, length as m-dash]](https://www.rsc.org/images/entities/char_e001.gif) O bond of cinnamaldehyde over unsupported Ni–Si IMCs catalysts.20
O bond of cinnamaldehyde over unsupported Ni–Si IMCs catalysts.20
In the highest temperature reaction region (500–600 °C), it is notable that the Si–Ni/SiO2 catalysts present high activity for CO methanation. Although the thermodynamic equilibrium value for CO conversion and CH4 selectivity decreased at high temperature (shown as short dashed lines in Fig. 9), CO conversions for the series of Si–Ni/SiO2 catalysts are stable over 70%. In addition, the selectivities toward CH4 for the series of Si–Ni/SiO2 catalysts silicified at 250, 350, and 450 °C were ca. 48%, 60%, and 37%, respectively, exhibiting excellent stability. However, the CO conversion and the CH4 selectivity for the Ni/SiO2 catalyst at 600 °C is 28% and 30%, which represents a significant drop. The Ni particles were sintered at high methanation temperature and carbon was deposited on the Ni/SiO2 catalyst during the reaction, leading to catalyst deactivation.9,14 However, due to the modified electronic structure and the geometrical site isolation at the surface of Si–Ni IMCs, these catalysts exhibited dramatically improved resistance to sintering and carbon deposition, increasing the thermal stability.42,43
Stability test of Si–Ni/SiO2 catalysts
Catalyst lifetime is a key consideration in the economical production of SNG from coal-derived gases.44 Therefore, the stability of Si–Ni/SiO2 catalyst during CO methanation was further examined. As shown in Fig. 10, with increasing time on stream to 1500 min at 450 °C, the CO conversions of Si–Ni/SiO2-350 catalyst remained at ca. 75% and the selectivity to methane was ca. 55%. The CO methanation reaction is a strong exothermic reaction, which is constrained by thermodynamic equilibrium at high temperature range of 450–600 °C at 1 atm. When the reaction temperature was further increased to 550 °C, the CO conversion increased dramatically to 90% but methane selectivity almost stabilized at ca. 55%. This is explained by the conversion of CO to carbon at high temperature due to Boudouard reaction (2CO → C + CO2).6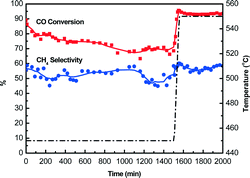 | ||
| Fig. 10 CO methanation properties on Si–Ni/SiO2-350 catalyst changing with time (the first step at 450 °C for 1500 min and the second step at 550 °C for 500 min). | ||
To further probe the stability, additional tests of Si–Ni/SiO2-350 and Ni/SiO2 catalysts at 600 °C were conducted, with results summarized in Fig. 11. Before the test, the catalysts were activated at 600 °C for 2 h. As shown in Fig. 11a, CO conversion for Ni/SiO2 was stabilized at ca. 82% during the initial 1000 min, with an increase to 100% with the prolonging of the reaction time to 2000 min. For the Si–Ni/SiO2-350 catalyst, the CO conversion was stabilized at ca. 80% during the 2500 min. It is worth noting that the pressure of the catalyst bed for the Ni/SiO2 catalyst increased to 0.2 MPa with the longer reaction time of 2000 min, while that for the Si–Ni/SiO2-350 catalyst was unchanged (i.e., was stable at 1 atm). This indicated that a large amount of carbon was formed on Ni/SiO2, which is in agreement with thermodynamics for the coke formation due to the Boudouard reaction and methane cracking when the reaction temperature exceeds ca. 600 °C.6,45 This is consistent with Nørskov et al., who observed that carbon nanofibers developed initially at step edges on nickel surfaces.46 After the silicification reaction, the formation of Si–Ni IMCs selectively blocked and stabilized the active sites of Ni particles, improving the resistance to coking in the high-temperature catalytic reaction.47
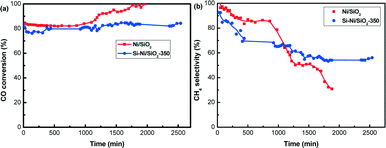 | ||
Fig. 11 Stability of Si–Ni/SiO2-350 and Ni/SiO2 catalyst for CO methanation (600 °C, 1 atm, GHSVs 48![[thin space (1/6-em)]](https://www.rsc.org/images/entities/char_2009.gif) 000 mL h−1 g−1). (a) CO conversion (b) CH4 selectivity. 000 mL h−1 g−1). (a) CO conversion (b) CH4 selectivity. | ||
With respect to the CH4 selectivity (as shown in Fig. 11b), the CH4 selectivity of Ni/SiO2 catalyst decreased dramatically from 100% to 31% with increasing time on stream. However, the CH4 selectivity of Si–Ni/SiO2-350 catalyst decreased from 93% to 60% during the in initial 1000 min, and then showed no obvious change. The decreases are likely due to the methane cracking reaction, leading to carbon formation.6,45 On the basis of the results from Fig. 10 and 11, Si–Ni IMCs supported on silica have enhanced high temperature stability in CO methanation compared to reduced Ni/SiO2 catalysts.
Structural characterization of tested catalysts
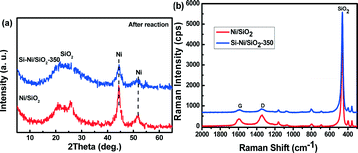
The effect of Si–Ni IMCs on the thermal stability of Ni particles was determined from measurements of particle size and carbon content in the used catalysts, using XRD and Raman spectroscopy, respectively, as shown in the Fig. 12. For the Ni/SiO2 catalyst, the Ni peaks located at 44.8 and 51.9 are prominent. The Ni particle size is calculated to be ca. 10 nm after the long term methanation (2000 min), suggesting sintering and agglomeration of Ni particles after the high temperature reaction. However, the particle size of Si–Ni/SiO2-350 catalyst is only ca. 5 nm after 2500 min of reaction, indicating its good stability.Raman spectroscopy is a very sensitive method to study coke.48,49 In Fig. 12b, Raman spectra of Si–Ni/SiO2-350 and Ni/SiO2 catalysts after the stability test at high temperature are shown. The G band at ca. 1590 cm−1 and the D band at ca. 1340 cm−1 resemble closely those of pregraphitic carbons, confirming the formation of carbon species on the catalysts during the high temperature CO methanation.50 However, the spectral intensity from coke on the used Ni/SiO2 catalyst is much higher than that of the used Si–Ni/SiO2-350. Ni atoms are scattered and spatially isolated by silicon, which is similar to Ga modified Pd-based IMC surfaces.36,51,52 This in turn prevents the sintering of Ni particles and resists carbon deposition. In our work, the feed gas (H2/CO = 3/1) is rich in carbon content, thus carbon deposition is favored.53 Ni-based catalysts have been widely used in growing carbon materials by chemical vapor deposition. The growth mechanisms are found to be assisted by a dynamic formation and restructuring of mono-atomic step edges at the nickel surface.46,54 However, the formation of Si–Ni IMCs leads to the variation of geometric configuration and electronic structure of nickel due to the strong interaction between silicon and nickel atoms,20,47 affording higher resistance to carbon deposition.
Conclusions
Highly dispersed Si–Ni IMCs supported on silica have been synthesized by direct silicification with volatile silane at relatively low temperature in a fluidized bed reactor. The combined results of FTIR and TPR-MS indicated that the resulting Si–Ni/SiO2 materials presented high activity and stability for CO methanation, in contrast to the reduced Ni/SiO2. The formation of Si–Ni IMCs improved the initial activity of CO methanation at the lower temperature, indicating that the specific electronic and geometrical structure of these catalysts has significantly enhanced catalytic activity in CO methanation. Because the silicon binds strongly with and thermodynamically stabilizes the Ni active sites on the surface, the Si–Ni/SiO2 presented excellent stability at the higher temperature. The strong interaction between silicon and nickel atoms can destabilize the adsorption of carbon atoms and reduce the deposition of resilient carbon species. These Si–Ni/SiO2 materials therefore show promise as highly efficient Ni-based catalysts for syngas methanation.Acknowledgements
We gratefully acknowledge the financial support provided by the National Natural Science Foundation of China (21073023 and 21373038) and the Fundamental Research Funds for the Central Universities (DUT12YQ03). CTW thanks the support of the SeaSky Visiting Professor program of Dalian University of Technology.Notes and references
- E. L. Muetterties and J. Stein, Chem. Rev., 1979, 79, 479 CrossRef CAS.
- G. W. Huber, S. Iborra and A. Corma, Chem. Rev., 2006, 106, 4044 CrossRef CAS PubMed.
- M. Sudiro and A. Bertucco, Synthetic Natural Gas (SNG) from Coal and Biomass: a Survey of Existing Process Technologies, Open Issues and Perspectives, Natural Gas, ed. Primoz Potocnik, InTech, 2010 Search PubMed, ISBN: 978-953-307-112-1..
- J. Kopyscinski, T. J. Schildhauer and S. M. A. Biollaz, Fuel, 2010, 89, 1763 CrossRef CAS PubMed.
- R. C. Baliban, J. A. Elia and C. A. Floudas, Ind. Eng. Chem. Res., 2010, 49, 7343 CrossRef CAS.
- J. J. Gao, Y. L. Wang, Y. Ping, D. C. Hu, G. W. Xu, F. N. Gu and F. B. Su, RSC Adv., 2012, 2, 2358 RSC.
- Catalysts are key to direct methanation, Chem. Eng. News, 1974, 52, 26, http://pubs.acs.org/doi/pdf/10.1021/cen-v052n037.p026a Search PubMed.
- Catalysts allow CO, CO comethanation, Chem. Eng. News, 1980, 58, 21, http://pubs.acs.org/doi/pdf/10.1021/cen-v058n041.p021a Search PubMed.
- T. Wigmans and J. A. Moulijn, J. Chem. Soc., Chem. Commun., 1980, 170 RSC.
- R. C. Everson, L. N. Mulay, O. P. Mahajan and P. L. Walker Jr., J. Chem. Technol. Biotechnol., 1979, 29, 1 CrossRef CAS.
- P. Panagiotopoulou, D. I. Kondarides and X. E. Verykios, Appl. Catal., B, 2009, 88, 470 CrossRef CAS PubMed.
- R. A. Dalla Betta, A. G. Piken and M. Shelef, J. Catal., 1974, 35, 54 CrossRef CAS.
- N. S. Govendera, F. G. Botesb, M. H. J. M. de Croona and J. C. Schoutena, J. Catal., 2008, 260, 254 CrossRef PubMed.
- V. Frøseth, S. Storsæter, Ø. Borg, E. A. Blekkan, M. Rønning and A. Holmen, Appl. Catal., A, 2005, 289, 10 CrossRef PubMed.
- A. L. Kustov, A. M. Frey, K. E. Larsen, T. Johannessen, J. K. Nørskov and C. H. Christensen, Appl. Catal., A, 2007, 320, 98 CrossRef CAS PubMed.
- A. L. Schmitt, J. M. Higgins, J. R. Szczech and S. Jin, J. Mater. Chem., 2010, 20, 223 RSC.
- J. J. G. Burton and R. L. Garten, Adv. Mater. Catal., Academic Press, New York, 1977 Search PubMed.
- X. Chen, A. Q. Zhao, Z. F. Shao, C. Li, C. T. Williams and C. H. Liang, J. Phys. Chem. C, 2010, 114, 16525 CAS.
- X. Chen, B. S. Zhang, C. Li, Z. F. Shao, D. S. Su, C. T. Williams and C. H. Liang, Mater. Res. Bull., 2012, 47, 867 CrossRef CAS PubMed.
- X. Chen, M. Li, J. C. Guan, X. K. Wang, C. T. Williams and C. H. Liang, Ind. Eng. Chem. Res., 2012, 51, 3604 CrossRef CAS.
- C. H. Liang, A. Q. Zhao, X. F. Zhang, Z. Q. Ma and R. Prins, Chem. Commun., 2009,(15), 2047 RSC.
- A. Q. Zhao, X. F. Zhang, X. Chen, J. C. Guan and C. H. Liang, J. Phys. Chem. C, 2010, 114, 3962 CAS.
- A. Elattar, T. Takeshita, W. E. Wallace and R. S. Craig, Science, 1976, 196, 1093 Search PubMed.
- K. S. W. Sing, D. H. Everett, R. A. W. Haul, L. Moscou, R. A. Pierotti, J. Rouquerol and T. Siemieniewska, Pure Appl. Chem., 1985, 57, 603 CrossRef CAS.
- P. Burattin, M. Che and C. Louis, J. Phys. Chem. B, 1999, 103, 6171 CrossRef CAS.
- Z. Y. Guo, F. L. Du, G. C. Li and Z. L. Cui, Chem. Commun., 2008, 2911 RSC.
- X. Chen, X. Liu, L. Wang, M. Li, C. T. Williams and C. H. Liang, RSC Adv., 2013, 3, 1728 RSC.
- X. Q. Yan, H. J. Yuan, J. X. Wang, D. F. Liu, Z. P. Zhou, Y. Gao, L. Song, L. F. Liu, W. Y. Zhou, G. Wang and S. S. Xie, Appl. Phys. A: Mater. Sci. Process., 2004, 79, 1853 CrossRef CAS PubMed.
- C. J. Kim, K. Kang, Y. S. Woo, K. G. Ryu, H. Moon, J. M. Kim, D. S. Zang and M. H. Jo, Adv. Mater., 2007, 19, 3637 CrossRef CAS.
- G. Herzberg, Infrared and Raman Spectra of Polyatomic Molecules, D. Van Nostrand Co., New York, 1945 Search PubMed.
- M. Agnelli, H. M. Swaan, C. Marquez-Alvarez, G. A. Martin and C. Mirodatos, J. Catal., 1998, 175, 117 CrossRef CAS.
- R. Frety, L. Tournayan, M. Primet, G. Bergeret, M. Guenin, J. B. Baumgartner and A. Borgna, J. Chem. Soc., Faraday Trans., 1993, 89, 3313 RSC.
- G. W. Huber, J. W. Shabaker and J. A. Dumesic, Science, 2003, 300, 2075 CrossRef CAS PubMed.
- T. Ueckert, R. Lamber, N. I. Jaeger and U. Schubert, Appl. Catal., A, 1997, 155, 75 CrossRef CAS.
- H. Praliaud, M. Primet and G. A. Martin, Bull. Soc. Chim. Fr., 1986, 5, 719 Search PubMed.
- K. Kovnir, M. Armbrüster, D. Teschner, T. V. Venkov, F. C. Jentoft, A. Knop-Gericke, Yu. Grin and R. Schlögl, Sci. Technol. Adv. Mater., 2007, 8, 420 CrossRef CAS PubMed.
- S. Y. Chin, C. T. Williams and M. D. Amiridis, J. Phys. Chem. B, 2006, 110, 871 CrossRef CAS PubMed.
- S. Derrouiche and D. Bianchi, Appl. Catal., A, 2006, 313, 208 CrossRef CAS PubMed.
- C. W. Hu, Y. Q. Chen, P. Li, H. Min, Y. Chen and A. M. Tian, J. Mol. Catal. A: Chem., 1996, 110, 163 CrossRef CAS.
- W. Wang and J. L. Gong, Front. Chem. Sci. Eng., 2011, 5, 2 CrossRef CAS.
- S. T. Hussain, M. A. Nadeem, M. Mazhar and F. Larachi, Bull. Korean Chem. Soc., 2007, 28, 529 CrossRef CAS.
- K. B. Kester and J. L. Falconer, J. Catal., 1984, 89, 380 CrossRef CAS.
- H. Thomas and I. I. Maugh, Science, 1984, 225, 403 Search PubMed.
- A. Zhao, W. Ying, H. Zhang, H. Ma and D. Fang, Catal. Commun., 2012, 17, 34 CrossRef CAS PubMed.
- G. A. Mills and F. W. Steffgen, Catal. Rev. Sci. Eng., 1974, 8, 159 Search PubMed.
- S. Helveg, C. López-Cartes, J. Sehested, P. L. Hansen, B. S. Clausen, J. R. Rostrup-Nielsen, F. Abild-Pedersen and J. K. Nørskov, Nature, 2004, 427, 426 CrossRef CAS PubMed.
- J. Lu, B. Fu, M. C. Kung, G. Xiao, J. W. Elam, H. H. Kung and P. C. Stair, Science, 2012, 335, 1205 CrossRef CAS PubMed.
- C. Li and P. C. Stair, Catal. Today, 1997, 33, 353 CrossRef CAS.
- Y. T. Chua and P. C. Stair, J. Catal., 2003, 213, 39 CrossRef CAS.
- D. Espinat, H. Dexpert, E. Freund and G. Martino, Appl. Catal., 1985, 16, 343 CrossRef CAS.
- L. Shao, W. Zhang, M. Armbrüster, D. Teschner, F. Girgsdies, B. Zhang, O. Timpe, M. Friedrich, R. Schlögl and D. S. Su, Angew. Chem., Int. Ed., 2011, 50, 10231 CrossRef CAS PubMed.
- L. D. Li, B. S. Zhang, E. Kunkes, K. Fçttinger, M. Armbrüster, D. S. Su, W. Wei, R. Schlögl and M. Behrens, ChemCatChem, 2012, 4, 1764 CrossRef CAS.
- C. Jia, J. Gao, J. Li, F. Gu, G. Xu, Z. Zhong and F. Su, Catal. Sci. Technol., 2013, 3, 490 CAS.
- J. R. Rostrup-Nielsen, J. Sehested and J. K. Nørskov, Adv. Catal., 2002, 47, 65 CrossRef CAS.
Footnote |
| † Electronic supplementary information (ESI) available. See DOI: 10.1039/c3cy00743j |
| This journal is © The Royal Society of Chemistry 2014 |


