Kinetics and catalyst deactivation in the enantioselective hydrogenation of ethyl benzoylformate over Pt/Al2O3†
Gerson
Martin
,
Päivi
Mäki-Arvela
,
Dmitry Yu.
Murzin
* and
Tapio
Salmi
Process Chemistry Centre, Åbo Akademi University, 20500 Turku/Åbo, Finland. E-mail: dmurzin@abo.fi
First published on 13th November 2013
Abstract
The enantioselective hydrogenation of ethyl benzoylformate (EBF) to (R)-ethyl mandelate over (−)-cinchonidine (CD)-modified Pt/Al2O3 catalyst in toluene in a semi-batch reactor was studied as a function of modifier concentration, reaction temperature, stirring rate and catalyst particle size. The kinetic results showed higher enantioselectivity and lower initial rates tending asymptotically to a constant value as the amount of modifier increased. The maximum enantiomeric excess (ee) and the initial hydrogenation rate or turnover frequency obtained under optimized conditions with an initial concentration of 5.6 mmol L−1 EBF at 25 °C over 5% (w/w) Pt/Al2O3 were 85% (modifier-to-surface Pt of 1.28) and 109 h−1 (modifier-to-surface Pt of 0.16), respectively. Additionally, catalyst deactivation due to the presence of impurities in the feed was prominent in some cases; therefore activated carbon was used as a cleaning agent of the raw material to remove impurities prior to catalyst addition.
1. Introduction
Today, asymmetric hydrogenation is mainly carried out by employing expensive homogeneous catalysts. However, these catalysts have their limitations in large scale industrial production and, therefore, new asymmetric catalysts need to be developed. Asymmetric synthesis using modified heterogeneous catalysts has gained a lot of interest for the production of optically pure chemicals in several areas, such as pharmaceuticals, nutraceuticals, fragrances and agrochemicals. The modified heterogeneous catalysts are industrially interesting because some available examples have demonstrated that high enantioselectivities (>95%) close to or even exceeding those obtained with existing homogeneous catalysts for the same reaction can be achieved.1,2The hydrogenation of α-ketoesters on supported Pt catalysts modified with cinchona alkaloids was discovered by Orito et al. in 19793 and, since then, detailed studies have been conducted and different substrates have been investigated using Pt-cinchona alkaloid catalytic systems. High enantiomeric excesses have been obtained in many cases for ketopantolactone (ee > 90%),4,5 α-ketoacetals (ee > 95%),6 ethyl-4,4-dimethylpyrrolidine-2,3,5-trione (ee > 90%),7 trifluoro-β-ketoester (ee = 90%),8 2,2,2-trifluoroacetophenone (ee = 56%),9,10 and α-ketoamides (eemax = 60%).11
The most widely studied model compound has been ethyl pyruvate.12,13 An important observation is that the reaction with the modifier is much faster than the reaction with the unmodified one, and furthermore, the reaction rate and enantioselectivity change in parallel (i.e. low reaction rates are related to low ee and high reaction rates are related to high ee).12–14 In contrast to ethyl pyruvate, the hydrogenation of ethyl benzoylformate (EBF) has been scarcely studied. Although the reaction was originally described by Orito et al.3 at the time of discovery of α-ketoesters' catalytic enantioselective hydrogenation and they achieved an optical yield of 84% for the production of ethyl-(R)-mandelate (EM), only a few papers have recently been published on the hydrogenation of EBF. For instance, Bartók et al.15 studied the effects of different alkaloids (cinchonidine, cinchonine, quinine, quinidine, α-isocinchonine, α-isocinchonidine and δ-isoquinidine) on the hydrogenation of EBF, and Sutyinszki et al.16 found an extremely high enantioselectivity (98%) using dihydrocinchonidine-modified 5% Pt/Al2O3 as a catalyst at 25 bar in AcOH. Hydrogenation of EBF yields very valuable building blocks such as ethyl-(R)- and ethyl-(S)-mandelate (EM).
In the present paper, the three-phase hydrogenation of ethyl benzoylformate in the presence of Pt/Al2O3 and a catalyst modifier [(−)-cinchonidine] is studied. The main studied parameters are temperature, modifier-to-surface Pt ratio, catalyst particle size, stirring rate and the feedstock. Finding optimized conditions in order to improve the reaction performance and to overcome catalyst deactivation was the main goal of this study.
2. Experimental section
2.1 Chemicals
Ethyl benzoylformate (Aldrich, 95%, 25,891-1) was used as purchased. For some experiments (section 3.3.4), EBF was treated with activated carbon (Chemviron Carbon, IVP, FE 51012A) prior to its use. Hydrogen (AGA, 99.999%), toluene (J.T. Baker, 8077, >99.5%) and (−)-cinchonidine (Fluka, 27350, 98%) were used as received.2.2 Hydrogenation of ethyl benzoylformate
Experiments were performed in a glass reactor at atmospheric pressure under a flow of molecular H2 at a volumetric flow rate of 295 ml min−1 at 25 °C. The reaction temperatures were 0, 25 and 50 °C, and toluene was used as a solvent. The catalyst (5% (w/w) Pt/Al2O3 Aldrich, Strem, 78-1660) was pre-reduced under flowing hydrogen at 400 °C for 2 h. For some experiments, EBF was treated with 220 mg of activated carbon for 2 h prior to its use. To avoid interactions between the catalyst and oxygen, the reaction medium was bubbled with Ar for 10 min before being placed in contact with the catalyst. In order to study external mass transfer limitations, different stirring rates were tested (250, 500 and 750 rpm). The internal mass-transfer resistance was overcome by using small catalyst particles (<90 μm). The liquid-phase volume and the initial concentration of the substrate were 150 mL and 5.6 mmol L−1, respectively. (−)-Cinchonidine was used as a catalyst modifier at a concentration between 0 and 0.005 mol L−1. The mass of the catalyst was 220 mg.2.3 Analytical procedure
Samples were withdrawn from the reactor at different time intervals and analyzed using a gas chromatograph (GC) (Varian 3300) equipped with a chiral column (Silica Chirasil-DEX; length 25 m, diameter 0.25 mm, film thickness 0.25 μm). Helium was used as a carrier gas at a split ratio of 33. The flame ionization detector (FI) and injector temperatures were 270 and 240 °C, respectively. The temperature program of the GC was 120 °C (25 min)–20 °C min−1–190 °C (6 min). The GC analysis was calibrated with ethyl benzoylformate (Aldrich, 95%, 25,891-1), (R)-ethyl mandelate (Aldrich, 99%, 30,998-2) and (S)-ethyl mandelate (Aldrich, 99%, 30,997-4).2.4 Catalyst characterization
![[thin space (1/6-em)]](https://www.rsc.org/images/entities/char_2009.gif) :
:![[thin space (1/6-em)]](https://www.rsc.org/images/entities/char_2009.gif) 1 for Pt
1 for Pt![[thin space (1/6-em)]](https://www.rsc.org/images/entities/char_2009.gif) :
:![[thin space (1/6-em)]](https://www.rsc.org/images/entities/char_2009.gif) CO was assumed.17 The temperature-programmed reduction (TPR) of the catalyst was performed using the above-mentioned Autochem instrument with the following temperature program: 5 °C min−1 to 400 °C for Pt/Al2O3. The carrier gas was a mixture of 5% hydrogen in argon at a flow rate of 30 ml s−1.
CO was assumed.17 The temperature-programmed reduction (TPR) of the catalyst was performed using the above-mentioned Autochem instrument with the following temperature program: 5 °C min−1 to 400 °C for Pt/Al2O3. The carrier gas was a mixture of 5% hydrogen in argon at a flow rate of 30 ml s−1.
2.5 Determination of metals by ICP-MS
The presence of metals in the raw material was measured using a Perkin Elmer-Sciex Elan 610 DRC Plus inductively coupled plasma mass spectrometry (ICP-MS) device. The instrument operates at a nebulizer flow of 0.8 ml min−1 and an auxiliary gas flow of 0.2 ml min−1, respectively. The plasma gas flow is 1.5 ml min−1 and the plasma power is 1300 W. The samples were digested before the measurements; in this case approximately 100 mg of ethyl benzoylformate was weighed into a Teflon bomb, and 5 ml HNO3 (65%) and 1 ml H2O2 (30%) were added. The solution was digested in a microwave oven (Milestone, MLS 1200 Mega) and diluted to 100 ml with deionized water. A multi-element standard was used as a calibration solution, and the samples were diluted by a factor of 5 prior to the measurements.3 Results and discussions
The reaction scheme for the hydrogenation of EBF is displayed in Fig. 1. As the figure shows, the complete reaction scheme is comprised of three components. The reactant, ethyl benzoylformate (A), is hydrogenated over Pt catalyst to produce two enantiomers, (R)- and (S)-ethyl mandelate (B and C), respectively. All reaction components A, B, and C in the scheme were distinguishable by chromatographic analysis. In the presence of the chiral modifier (−)-cinchonidine, (R)-ethyl mandelate is formed in excess. The enantiomeric excess (ee) is defined as ee (%) = |CB − CC|/(CB + CC) × 100. Hydrogenation of A has been studied previously in both batch16 and continuous reactors.18 The highest reported ee was 98% (reaction conditions: 24 °C, acetic acid as a solvent, 25 bar, 10 mmol L−1 dihydrocinchonidine and 50 mg of 5% w/w Pt/Al2O3, Engelhard 4759).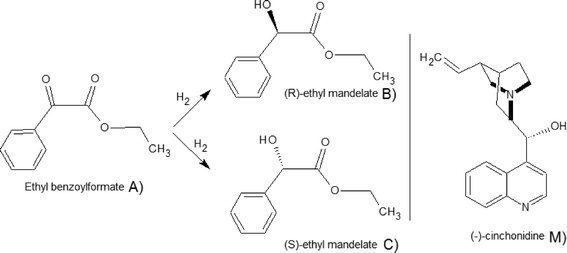 | ||
| Fig. 1 Reaction scheme for the hydrogenation of EBF and the catalyst modifier (M), (−)-cinchonidine.18 | ||
3.1 Catalyst characterization
The metal dispersion of the catalyst was investigated by CO pulse chemisorption. For Pt/Al2O3, the metal dispersion was 34%, which corresponds to an average platinum metal nanoparticle size of 3.4 nm. The metal crystal size close to 3 nm was found to be appropriate for high chiral induction in the hydrogenation of ethyl pyruvate,19 and it has been already reported that the larger the metal particle size, the higher the enantioselectivity.20 This behavior has been essentially attributed to a minimum ensemble required for appropriate reactant adsorption; otherwise only a small fraction of (−)-cinchonidine exhibits the conformation required to drive the reaction towards the desired enantiomer.It is important to note that steric requirements were discussed previously for 1-phenyl-1,2-propanedione,20 however both molecules possess similar molecular diameters, and the molecular length varies only by 2.5 Å,21 with ethyl benzoylformate being larger.
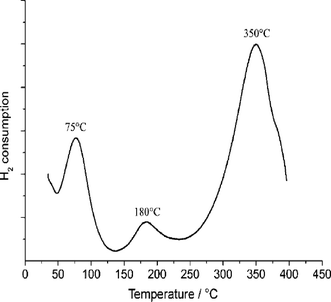
The temperature-programmed reduction profile of the catalyst showed three peaks at 75, 180, and 350 °C (Fig. 2). The first two peaks can be attributed to the reduction of Pt particles to their metallic state, whereas the peak observed at 350 °C is not caused by the reduction of Pt, and its intensity depends on the amount of carrier and not on the amount of Pt. Some phase changes might also take place both in the support material and in the Pt phase.22
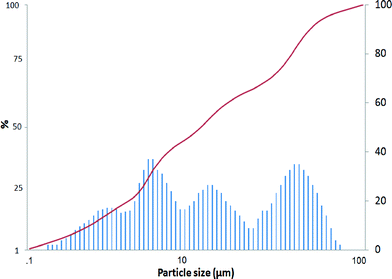
The mean Pt/Al2O3 catalyst particle size was 15.9 μm (Fig. 3), and the morphology of the catalyst particle is visible in Fig. S1.† Additionally, the largest particles were about 40.8 μm, whereas the smallest particles were ca. 2.8 μm. The specific surface area and the pore volume of the fresh catalyst determined by nitrogen adsorption were 95 m2 gcat−1 and 0.319 cm3 gcat−1, respectively.
The results from the EDX analysis showed that the main components present in this catalyst were Pt (6.2%), Al (42.6%) and O (51.2%) (Table 1). In the hydrogenation of EBF, some catalyst deactivation occurred (see section 3.3.4). To reveal the origin of the catalyst deactivation, both fresh and spent Pt/Al2O3 samples were analyzed by EDX.
| Fresh Pt/Al2O3 | |||||||
|---|---|---|---|---|---|---|---|
| O | Al | F | Si | K | Pt | S | |
| Weight (%) | 51 | 43 | — | — | — | 6 | — |
| Weight % error (±) | 0.4 | 0.2 | — | — | — | 0.2 | — |
| Atom % | 66 | 33 | — | — | — | 1 | — |
| Atom % error (±) | 0.6 | 0.1 | — | — | — | 0.02 | — |
| Compound (%) | 51 | 43 | — | — | — | 6 | — |
| Spent Pt/Al2O3. The raw material was not treated with activated carbon before the reaction | |||||||
|---|---|---|---|---|---|---|---|
| Weight (%) | 47 | 46 | 0.6 | — | — | 5.6 | 0.77 |
| Weight % error (±) | 0.4 | 0.1 | 0.2 | — | — | 0.3 | 0.09 |
| Atom % | 62 | 36 | 0.7 | — | — | 0.78 | 0.52 |
| Atom % error (±) | 0.5 | 0.1 | 0.2 | — | — | 0.03 | 0.06 |
| Compound (%) | 47 | 46 | 0.6 | — | — | 5.6 | 0.7 |
| Spent Pt/Al2O3. The raw material was treated with activated carbon before the reaction | |||||||
|---|---|---|---|---|---|---|---|
| Weight (%) | 49 | 44 | 0.29 | 0.16 | 0.15 | 6.4 | — |
| Weight % error (±) | 0.4 | 0.2 | 0.04 | 0.04 | 0.04 | 0.2 | — |
| Atom % | 64 | 35 | 0.2 | 0.10 | 0.06 | 0.64 | — |
| Atom % error (±) | 0.5 | 0.1 | 0.04 | 0.03 | 0.02 | 0.02 | — |
| Compound (%) | 49 | 44 | 0.29 | 0.16 | 0.15 | 6.4 | — |
The EDX analysis results showed that there was neither sulfur nor any other poisoning agent present in the fresh Pt/Al2O3 catalyst. However, the results on the spent catalyst revealed (Table 1) that sulfur and fluorine were introduced to the solution from the raw material.
3.2 ICP-MS results
Due to the amount of sulfur found in the spent catalyst (Table 1), it was decided to study the raw materials and their possible metal concentrations. The concentration of sulfur was around 2% w/w for ethyl benzoylformate. Knowing the amount of ethyl benzoylformate during the experiments, the total amount of sulfur was estimated to be 9.4 × 10⁻⁵ mol. Table 2 contains the calculated amounts of Pt loaded in the reactor at different catalyst masses and the respective sulfur to platinum ratios.The amount of sulfur found in the raw material (Aldrich, 95%, 25,891-1) was higher than the amount of surface Pt in 440 mg by 60%. However, these calculations refer only to the surface Pt and do not count the catalyst support. It was not possible to estimate the distribution of sulfur on the catalyst, leading to the uncertainty about how much sulfur is adsorbed on Pt or on the support. Nevertheless, these characterization results explain the poor conversion and ee found when the amount of catalyst was lower than 165 mg (section 3.3.4).
3.3 Kinetic results
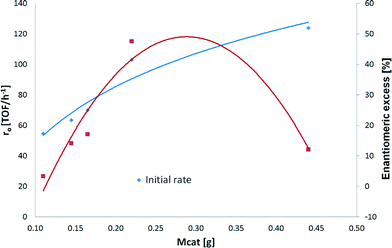
One of the aims of the current work was to study the hydrogenation kinetics of ethyl benzoylformate over Pt/Al2O3. In order to obtain optimum reaction conditions, a series of experiments was performed, varying catalyst particle size, stirring rate, modifier concentration, and catalyst amount, as well as investigating purification by contact with activated carbon. Finally, the effect of reaction temperature was studied under optimized conditions.A maximum initial rate acceleration of 54% compared to the one achieved with 110 mg of catalyst was observed with 440 mg of Pt/Al2O3. As illustrated in Fig. 4, the initial rate increased as the amount of catalyst increased. It can be noted that the increase in the initial hydrogenation rate is not linear as was expected, leading to assumptions that deactivation by sulfur occurs on the catalyst surface and that removal of impurities by the pretreatment of the raw material with activated carbon is needed prior to the hydrogenation of ethyl benzoylformate.
The hydrogenation rate of EBF differed very much when the amount of catalyst increased from 165 mg to 220 mg. The conversion after 24 hours and the initial hydrogenation rate went up from 35% to 100% and from 74 to 109 (TOF/h−1) when the amount of the catalyst increased by 33% (Table 3, entries 3 and 4, respectively). These results are explained by the amount of sulfur found in the raw material (section 3.2). Normally, small amounts are totally deactivated by sulfur, and their activity increases linearly with the mass. However, sulfur distribution on the catalyst surface and catalyst support is still unknown (section 3.2). It can be assumed that with 220 mg of Pt/Al2O3, a part of the catalyst remains active, allowing complete conversion.
| Mass of cat (g) | Initial rate (TOF/h−1) | Conversion (%) after 24 h | ee (%) |
|---|---|---|---|
| 0.110 | 56 | 12 | 3 |
| 0.145 | 62 | 20 | 14 |
| 0.165 | 74 | 35 | 17 |
| 0.220 | 109 | 100 | 48 |
| 0.440 | 124 | 100 | 12 |
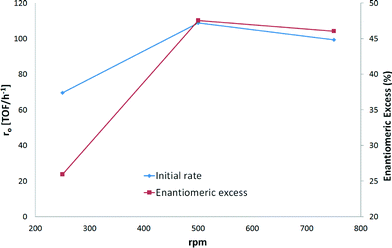
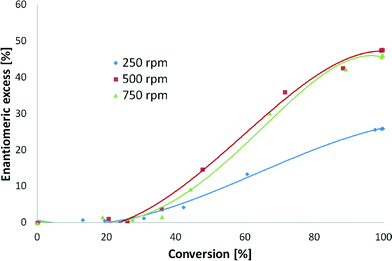
The initial hydrogenation rate and ee increased by 38% and 46%, respectively, when 500 rpm instead of 250 rpm was applied (Fig. 5). When comparing the stirring rates of 500 and 750 rpm, the variation in the initial hydrogenation rates was less than 10%. In fact, Fig 5 shows that almost the same rates were achieved with the two highest stirring speeds. A difference of less than 5% was found for ee when 500 and 750 rpm were used. These results correspond to previous studies which have demonstrated that enantioselective hydrogenation of α-ketoesters is not influenced by external mass transfer limitations and remains at the same level as that under kinetic control.23 Thus, the stirring speed of 500 rpm was considered to be sufficient for kinetic control.
Additionally, by plotting enantiomeric excess vs. conversion (Fig. 6), an increase in enantiodifferentiation after 30% of conversion is visible. This behavior has been observed before in ethyl pyruvate hydrogenation, where interactions between the product (R)-lactate and the modifier were proposed.24 Moreover, Baiker et al. suggested that the enantioselection is strongly influenced not only by the substrate–modifier–Pt interactions but also by substrate–substrate, substrate–solvent, and product–modifier interactions.25
Enantiomeric excess vs. conversion was plotted (Fig. 7), and the results confirmed the aforementioned dependence of ee on conversion.
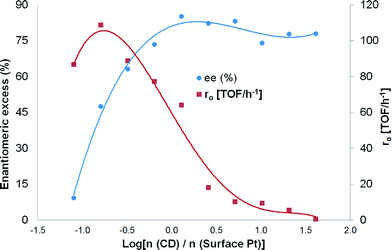
The highest enantiomeric excess (at 24 hours of the reaction) was 85% using the molar ratio of modifier-to-surface Pt of 1.28, but it varied as a function of the modifier concentration (Table 4). Due to high variations in ee and initial hydrogenation rates when small amounts of modifiers were added, it was decided to plot ee and r0vs. log[n (CD)/n (surface Pt)] (Fig. 8). It can be observed from Fig. 8 that ee passes through a maximum and decreases thereafter with increasing modifier concentration.
| n (CD)/n (surface Pt) | Initial rate (TOF/h−1) | Conversion after 24 h (%) | ee (%) |
|---|---|---|---|
| 0 | 69 | 100 | 1 |
| 0.08 | 87 | 100 | 8 |
| 0.16 | 109 | 100 | 48 |
| 0.32 | 89 | 100 | 63 |
| 0.64 | 77 | 100 | 74 |
| 1.27 | 64 | 100 | 85 |
| 2.53 | 18 | 96 | 82 |
| 5.06 | 10 | 95 | 83 |
| 10.12 | 9 | 90 | 74 |
| 20.24 | 6 | 86 | 78 |
| 40.48 | <1 | 68 | 78 |
The formation rate of the (R)-enantiomer rapidly increased when small amounts of modifiers were introduced into the system. However, at the same time, the formation rate of the (S)-enantiomer decreased significantly. Besides, it is well-known that the addition of bases such as cinchonidine (pKa = 8.3) increases the hydrogenation rate of a ketonic carbonyl due to the donor effect of the lone pair of electrons of the nitrogen atom. An increase in the ee from 1 to 8% was achieved (Table 4, entries 1 and 2) when the modifier-to-surface Pt ratio increased from 0 to 0.08. No variations in the ee were observed when a catalyst modifier-to-surface Pt molar ratio of between 20.24 and 40.48 was used (Table 4, entries 10 and 11). This could be explained by the solubility of CD in toluene which has a maximum value of 2.7 mmol L−1.30
Similar results have been found in the literature for the hydrogenation of EBF. For instance, Schmidt et al. achieved a 92% ee using a 2.4 molar ratio of the catalyst modifier-to-surface Pt and 10 bar.25 This ee value is higher than our results (Table 4, entry 7), and it could be explained by the differences in hydrogen pressure and the solvent. Sutyinszki et al. achieved a 90% ee using a 12.5 molar ratio of the catalyst modifier-to-surface Pt and acetic acid as a solvent.27 The ee value is also higher than our results (Table 4, entry 9) probably due to the influence of a protic solvent. Such solvents can act as H-bond donors and give an extra amount of hydrogen for the reaction. Moreover, the role of acetic acid in chiral hydrogenation has been explained by the protonation of the cinchona alkaloid.31
A maximum rate acceleration of 38% as compared to the absence of modifier was observed at about a 1![[thin space (1/6-em)]](https://www.rsc.org/images/entities/char_2009.gif) :
:![[thin space (1/6-em)]](https://www.rsc.org/images/entities/char_2009.gif) 6 molar ratio of the catalyst modifier-to-surface Pt, whereas a maximum ee was observed at slightly higher modifier concentrations, corresponding to about a 5
6 molar ratio of the catalyst modifier-to-surface Pt, whereas a maximum ee was observed at slightly higher modifier concentrations, corresponding to about a 5![[thin space (1/6-em)]](https://www.rsc.org/images/entities/char_2009.gif) :
:![[thin space (1/6-em)]](https://www.rsc.org/images/entities/char_2009.gif) 4 molar ratio of the catalyst modifier-to-surface Pt (Table 4, entry 6). After the maximum, the formation rate of (R)-ethyl mandelate rate started to decrease as the modifier concentration increased, and the rate decreased to a much lower level than in the absence of the modifier (Fig. 8). Similar analysis for the formation of (S)-ethyl mandelate revealed that its formation rate decreased rapidly when small amounts of the modifier were present. As the amount of modifier was further increased after the maximum enantioselectivity, the decrease in the formation of (S)-ethyl mandelate was somewhat less pronounced. From these observations it can be concluded that up to a certain optimum value of the modifier concentration, the enantioselectivity and the initial reaction rate increase; however, a further increase in the modifier concentration results in a decrease in the enantioselectivity and the reaction rate.
4 molar ratio of the catalyst modifier-to-surface Pt (Table 4, entry 6). After the maximum, the formation rate of (R)-ethyl mandelate rate started to decrease as the modifier concentration increased, and the rate decreased to a much lower level than in the absence of the modifier (Fig. 8). Similar analysis for the formation of (S)-ethyl mandelate revealed that its formation rate decreased rapidly when small amounts of the modifier were present. As the amount of modifier was further increased after the maximum enantioselectivity, the decrease in the formation of (S)-ethyl mandelate was somewhat less pronounced. From these observations it can be concluded that up to a certain optimum value of the modifier concentration, the enantioselectivity and the initial reaction rate increase; however, a further increase in the modifier concentration results in a decrease in the enantioselectivity and the reaction rate.
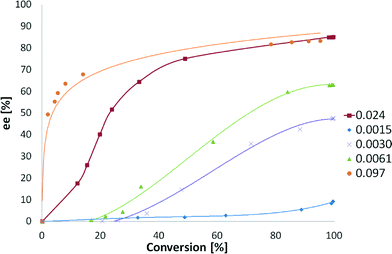
The dependence of ee on conversion has been also studied (Fig. 9). Low amounts of CD do not afford any enantiodifferentiation. However, larger amounts of the modifier led to a fast increase in ee and mediocre changes afterwards.
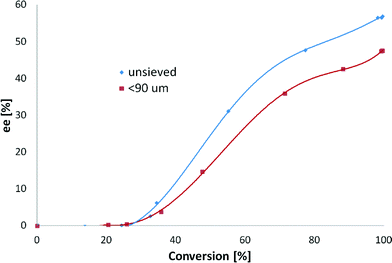
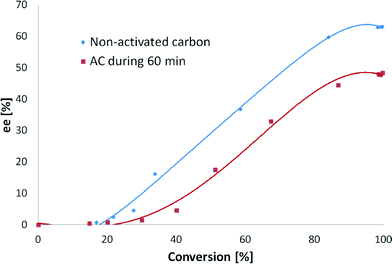
The initial TOF values obtained during these experiments with and without treatment with activated carbon were 123 and 109 h−1, respectively. Moreover, treatment of the substrate with activated carbon gave a 48% ee, whereas the substrate used as received gave a 63% ee (Fig. 10). A complete conversion after 24 hours was achieved with both reactants. Similar to the stirring rate effect (section 3.3.2), enantiodifferentiation was visible after 20% of conversion, proving that product–modifier interactions are a key factor in the hydrogenation of EBF.
The increase in the initial hydrogenation rate when activated carbon was used can be explained by the adsorption of sulfur present in the substrate. However, the difference in ee is more profound, showing a decrease of 24% when activated carbon was applied, which could be explained by an increase in the modifier-to-substrate molar ratio (θM/θS). The small amounts of modifier used in all of the experiments do not allow for its significant coverage on the surface; thus some sites are available for the formation of (S)-ethyl mandelate in racemic hydrogenation not requiring involvement of the modifier. When sulfur is present, the amount of sites available on the metal surface is substantially diminished, and they are mostly occupied by CD, thus leading to elevated production of (R)-ethyl mandelate.
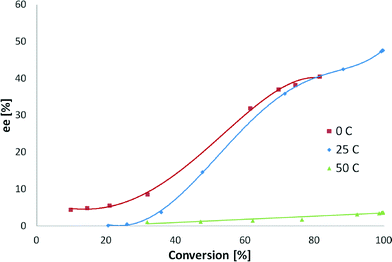
The reaction temperature influenced both the initial hydrogenation rate and the ee. The kinetics followed the Arrhenius law, and the initial rate increased with increasing temperature. The initial TOF values for the reaction temperatures 0, 25 and 50 °C were 26, 109 and 171 h−1, respectively. The enantiomeric excess did not change when the temperature increased from 0 to 25 °C at 80% of conversion (Fig. 11). An intense decrease in the ee from 48 to 3% was observed when the temperature was shifted from 25 to 50 °C.
ee increased continuously above 20% conversion, except for hydrogenation at 50 °C. At this temperature, ee was constant due to the fact that hydrogenation of the quinoline skeleton of CD32–36 occurs, leading to a diminished amount of CD on the surface responsible for enantioselection. High reaction temperature is not feasible for cinchona–alkaloid modified systems, as the enantioselectivity is known to dramatically decrease at higher temperatures (<50 °C),32,33 which is attributed to the desorption of the modifier- and temperature-induced changes in the modifier adsorption mode.34 Full conversion was obtained for 25 and 50 °C while at 0 °C it was not reached after 24 hours. Enantiomeric excesses at 0 and 25 °C were almost the same, which could be explained by the fact that desorption of CD does not occur and the hydrogenation of the quinoline skeleton does not take place in this temperature range.
4 Conclusions
Hydrogenation of ethyl benzoylformate was investigated in an isothermal batch reactor at atmospheric pressure over finely dispersed Pt/Al2O3 catalyst in toluene. The reaction temperature was varied between 0 and 50 °C. Experiments with different catalyst masses showed catalyst deactivation due to impurities in the feedstock. The EDX analysis from the spent catalyst revealed the presence of sulfur and fluorine originating from the reactant. No poisoning agents such as sulfur were, however, detected after the treatment with activated carbon.The presence of internal and external mass transfer limitations was studied. Utilization of an average catalyst particle size of 90 μm and a stirring rate of 500 rpm allowed the carrying out of experiments in the kinetic regime. The maximum enantiomeric excess obtained under optimized conditions (0.85 mmol of EBF and 0.025 mmol of CD, 220 mg of 5 wt% Pt/Al2O3, 150 mL of toluene, hydrogen atmosphere and 25 °C) was 85%. The most profound effects on the catalyst activity and the ee were observed as the modifier concentration was varied. The ee had its maximum at a 1.27 modifier-to-surface Pt molar ratio. The maximum initial TOF was 109 h−1. The maximum rate acceleration of 38% with respect to the absence of the modifier was observed at a 0.16 modifier-to-surface Pt molar ratio. Beyond the maximum values, the reaction rate and the ee decreased as the concentration of (−)-cinchonidine was further increased. The catalyst activity decreased even below the level of racemic hydrogenation at high (−)-cinchonidine concentrations. Product–modifier interactions in the liquid phase are proposed as a key factor for enantiodifferentiation. The results shown in this paper enhance the knowledge of enantioselective hydrogenation kinetics and could serve as a basis for scale-up reactors and model design.
Acknowledgements
This work is part of the activities at the Åbo Akademi Process Chemistry Centre (ÅA-PCC) within the Finnish Centre of Excellence Programme appointed by the Academy of Finland.References
- Y. Izumi, Adv. Catal., 1983, 32, 215–271 CrossRef CAS.
- H.-U. Blaser, H.-P. Jalett and J. Wiehl, J. Mol. Catal., 1991, 68, 215–222 CrossRef CAS.
- Y. Orito, S. Imai and S. Niwa, Nippon Kagaku Kaishi, 1979, 8, 1118–1120 CrossRef.
- M. Schürch, O. Schwalm, T. Mallat, J. Weber and A. Baiker, J. Catal., 1997, 169, 275–286 CrossRef.
- M. Schürch, N. Künzle, T. Mallat and A. Baiker, J. Catal., 1998, 176, 569–571 CrossRef.
- M. Studer, S. Burkhardt and H.-U. Blaser, Chem. Commun., 1999, 1727 RSC.
- N. Künzle, A. Szabo, Z. Wang, M. Schürch, T. Mallat and A. Baiker, Chem. Commun., 1998, 13, 1377–1378 RSC.
- M. von Arx, T. Mallat and A. Baiker, J. Catal., 2000, 193, 161–164 CrossRef CAS.
- T. Mallat, M. Bodmer and A. Baiker, Catal. Lett., 1997, 44, 95–99 CrossRef CAS.
- M. Bodmer, T. Mallat, and A. Baiker, Catalysis of Organic Reactions, ed. Herkes, F. E., Marcel Dekker, New York, 1998, pp. 75–87 Search PubMed.
- G. Z. Wang, T. Mallat and A. Baiker, Tetrahedron: Asymmetry, 1997, 8, 2113–2140 Search PubMed.
- A. Baiker, J. Mol. Catal. A: Chem., 1997, 115, 473–493 CrossRef CAS.
- H.-U. Blaser, H.-P. Jalett, M. Müller and M. Studer, Catal. Today, 1997, 37, 441–463 CrossRef CAS.
- H.-U. Blaser, H.-P. Jalett, M. Garland, M. Studer, H. Thies and A. Wirth-Tijani, J. Catal., 1998, 173, 282–294 CrossRef CAS.
- M. Bartók, K. Felföldi, B. Török and T. Bartók, Chem. Commun., 1998, 23, 2605–2606 RSC.
- M. Sutyinszki, K. Szöri, K. Felföldi and M. Bartók, Catal. Commun., 2002, 3, 125–127 CrossRef CAS.
- A. V. Tokarev, A. V. Kirilin, E. V. Murzina, K. Eränen, L. M. Kustov, D. Yu. Murzin and J. Mikkola, Int. J. Hydrogen Energy, 2010, 35, 12642–12649 CrossRef CAS PubMed.
- E. Toukoniitty, J. Wärnå, D. Yu. Murzin and T. Salmi, Chem. Eng. Sci., 2010, 65, 1076–1087 CrossRef CAS PubMed.
- J. T. Wehrli, A. Baiker, D. M. Monti and H.-U. Blaser, J. Mol. Catal., 1990, 61, 207–226 CrossRef CAS.
- E. Toukoniitty, P. Mäki-Arvela, M. Kuzma, A. Villela, A. K. Neyestanaki, T. Salmi, R. Sjöholm, R. Leino, E. Laine and D. Yu. Murzin, J. Catal., 2001, 204, 281–291 CrossRef CAS.
- Q. Shao, H. Liangliang, J. Zhou, L. Linghong, L. Zhang, X. Lu, S. Jiang, K. Gubbins, Y. Zhu and W. Shen, J. Phys. Chem. C, 2007, 111, 15677–15685 CAS.
- H. Lieske, G. Lietz, H. Spindler and J. Völter, J. Catal., 1983, 81, 8–16 CrossRef CAS.
- E. Toukoniitty, P. Mäki-Arvela, N. Kumar, T. Salmi and D. Yu. Murzin, Catal. Today, 2003, 79, 189–193 CrossRef.
- D. Yu. Murzin, Ind. Eng. Chem. Res., 1997, 36, 4784–4790 CrossRef CAS.
- E. Schmidt, C. Bucher, G. Santarossa, T. Mallat, R. Gilmour and A. Baiker, J. Catal., 2012, 289, 238–248 CrossRef CAS PubMed.
- L. M. Baldyga, Effect of Platinum Particle Size on the Sulfur Deactivation of Hydrogenation. University of South Florida, Miami, 2012, pp. 1–2 Search PubMed.
- M. Sutyinszki, K. Szöri, K. Felföldi and M. Bartók, Catal. Lett., 2002, 3, 281–284 CrossRef.
- M. F. Ibanez, V. Vetere, G. F. Santori, M. L. Casella and O. A. Ferretti, J. Argent. Chem. Soc., 2003, 91, 63–72 CrossRef CAS.
- E. Toukoniitty, B. Ševčíková, P. Mäki-Arvela, J. Wärnå, T. Salmi and D. Yu. Murzin, J. Catal., 2002, 213, 7–16 CrossRef.
- Z. Ma and F. Zaera, J. Phys. Chem. B, 2005, 109, 406–414 CrossRef CAS PubMed.
- M. Bartók, K. Balázsik, G. Szöllösi and T. Bartók, Catal. Commun., 2001, 2, 269–272 CrossRef.
- M. Bartók, G. Szöllösi, K. Balázsik and T. Bartók, J. Mol. Catal. A: Chem., 2002, 177, 299–305 CrossRef.
- V. Morawsky, U. Prüsse, L. Witte and K. D. Vorlop, Catal. Commun., 2000, 1, 15–20 CrossRef CAS.
- U. Böhmer, F. Franke, K. Morgenschweis, T. Bieber and W. Reschetilowski, Catal. Today, 2000, 60, 167–173 CrossRef.
- C. LeBlond, J. Wang, J. Liu, A. T. Andrews and Y.-K Sun, J. Am. Chem. Soc., 1999, 121, 4920–4921 CrossRef CAS.
- W.-R. Huck, T. Bürgi, T. Mallat and A. Baiker, J. Catal., 2003, 216, 276–287 CrossRef CAS.
Footnote |
| † Electronic supplementary information (ESI) available. See DOI: 10.1039/c3cy00548h |
| This journal is © The Royal Society of Chemistry 2014 |

