 Open Access Article
Proton dynamics of two-dimensional oxalate-bridged coordination polymers
Satoshi
Miyatsu
a,
Maiko
Kofu
a,
Atsushi
Nagoe
ab,
Takeshi
Yamada
ab,
Masaaki
Sadakiyo
cd,
Teppei
Yamada
c,
Hiroshi
Kitagawa
bc,
Madhusudan
Tyagi
e,
Victoria
García Sakai
f and
Osamu
Yamamuro
*ab
aInstitute for Solid State Physics, University of Tokyo, 5-1-5 Kashiwanoha, Kashiwa, Chiba 277-8581, Japan. E-mail: yamamuro@issp.u-tokyo.ac.jp
bCore Research for Evolutional Science and Technology (CREST), Japan Science and Technology Agency (JST), 7 Gobancho, Chiyoda-ku, Tokyo 102-0076, Japan
cGraduate School of Science, Kyoto University, Kitashirakawa Oiwake-cho, Sakyo-ku, Kyoto 606-8502, Japan
dInternational Institute for Carbon-Neutral Energy Research (WPI-I2CNER), Kyushu University, 744 Moto-oka, Nishi-ku, Fukuoka 819-0395, Japan
eNIST Center for Neutron Research, National Institute of Standards and Technology, 100 Bureau Drive, Gaithersburg, Maryland 20899-6102, USA
fISIS Facility, Rutherford Appleton Laboratory, Harwell Science & Innovation Campus, Chilton, Didcot, OX11 0QX, UK
First published on 3rd July 2014
Abstract
A two-dimensional porous coordination polymer (NH4)2{HOOC(CH2)4COOH}[Zn2(C2O4)3] (abbreviated as (NH4)2(adp)[Zn2(ox)3] (adp = adipic acid, ox = oxalate)), which accommodates water molecules between the [Zn2(ox)3] layers, is highly remarked as a new type of crystalline proton conductor. In order to investigate its phase behavior and the proton conducting mechanism, we have performed adiabatic calorimetry, neutron diffraction, and quasi-elastic neutron scattering experiments on a fully hydrated sample (NH4)2(adp)[Zn2(ox)3]·3H2O with the highest proton conductivity (8 × 10⁻³ S cm−1, 25 °C, 98% RH). Its isostructural derivative K2(adp)[Zn2(ox)3]·3H2O was also measured to investigate the role of ammonium ions. (NH4)2(adp)[Zn2(ox)3]·3H2O and K2(adp)[Zn2(ox)3]·3H2O exhibit higher order transitions at 86 K and 138 K, respectively. From the magnitude of the transition entropy, the former is of an order–disorder type while the latter is of a displacive type. (NH4)2(adp)[Zn2(ox)3]·3H2O has four Debye-type relaxations and K2(adp)[Zn2(ox)3]·3H2O has two similar relaxations above each transition temperature. The two relaxations of (NH4)2(adp)[Zn2(ox)3]·3H2O with very small activation energies (ΔEa < 5 kJ mol−1) are due to the rotational motions of ammonium ions and play important roles in the proton conduction mechanism. It was also found that the protons in (NH4)2(adp)[Zn2(ox)3]·3H2O are carried through a Grotthuss mechanism. We present a discussion on the proton conducting mechanism based on the present structural and dynamical information.
1 Introduction
Metal–organic frameworks (MOFs), which are composed of metal ions and organic ligands, have attracted much attention in the last decade due to their applications in gas sorption,1–3 catalysis,4,5 and ionic conductivity.6–12 They are often called porous coordination polymers (PCPs) because they commonly possess a porous structure, a key characteristic of MOFs since the architecture (e.g., size, dimensionality) can be controlled by changing metal ions and ligands.13–15We have focused on PCPs exhibiting proton conductivity. High-performance proton conductors have an important role in fuel cell applications.16–18 Protons are supplied by acidic groups such as –COOH and –OH (sometimes –NH2 group) on the pore wall and are carried by molecules (in most cases, water molecules) inside the pore.19–21,23,24 For example, in copper rubeanate (H2C2N2S2Cu; H2dtoaCu), the proton conductivity is mainly governed by the protons provided by the –NH2 group in the pore wall. H2dtoaCu adsorbs water in its pores to a maximum hydration of 3.7 molecules at a relative humidity (RH) of 100%. The conductivity at this concentration is 0.01 S cm−1, comparable to that of Nafion, currently the best commercial proton conductor. Our quasi-elastic neutron scattering (QENS) study has revealed that the water inside the pore behaves as bulk water (or free water) above the phase transition temperature, and is condensed on the pore surface below this temperature. This free water plays an important role as the proton carrier.25,26
(NH4)2(adp)[Zn2(ox)3] (adp = adipic acid, ox = oxalate) is one of the PCPs developed in recent years. It has been reported that (NH4)2(adp)[Zn2(ox)3] adsorbs as many water molecules as copper rubeanate and the proton conductivity of the trihydrate sample ((NH4)2(adp)[Zn2(ox)3]·3H2O) is also 0.01 S cm−1.22 Unlike copper rubeanate and Nafion which are amorphous solids, (NH4)2(adp)[Zn2(ox)3] can be synthesized as single crystals, leading to more homogeneous samples with high reproducibility, on which very precise structural work can be performed to investigate the mechanism of proton conduction.
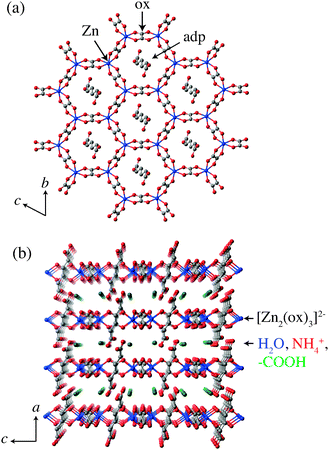
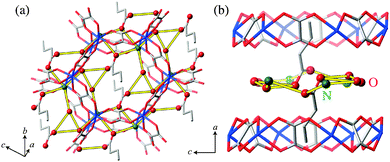
The crystal structure of (NH4)2(adp)[Zn2(ox)3], determined by single-crystal X-ray diffraction measurements,22 is shown in Fig. 1. Two-dimensional honeycomb sheets are formed by an oxalated-bridged framework [Zn2(ox)3]2− and adipic acids penetrate the sheets nearly vertically. There are carboxyl groups of adipic acids, ammonium ions and water molecules in the space between the zinc oxalate layers. We call this space “proton conducting layers”. It is presumed that protons are supplied by carboxyl groups and carried by water molecules and potentially by ammonium ions.
The first purpose of this study is to investigate the phase behavior of (NH4)2(adp)[Zn2(ox)3]·3H2O and clarify the relation between the phase transition, which is associated with water molecules and/or ammonium ions, and the proton conductivity. For this purpose, we have performed adiabatic calorimetry and neutron powder diffraction measurements at temperatures between 5 and 300 K. Next, to reveal the proton-conducting mechanism, QENS measurements have been carried out in a time range between 0.1 ps and 10 ns. The incoherent neutron scattering cross-section of a hydrogen atom (σinc = 80 b, 1 b = 10−24 cm2) is much larger than the incoherent/coherent cross-sections of other atoms such as carbon (σinc = 0 b), nitrogen (σinc = 0.5 b), oxygen (σinc = 0 b), and deuterium (σinc = 2.1 b). Therefore, the self-motions of molecules/ions/functional groups with hydrogen atoms are preferentially detected through the incoherent scattering from hydrogen atoms. For all experiments, we have also investigated K2(adp)[Zn2(ox)3]·3H2O in which ammonium ions are substituted by potassium ions.27 Since K2(adp)[Zn2(ox)3]·3H2O is isostructural with (NH4)2(adp)[Zn2(ox)3]·3H2O, the comparison between the two samples is significant in revealing the function of ammonium ions. It should be pointed out that the proton conductivity of K2(adp)[Zn2(ox)3]·3H2O is 1.2 × 10⁻⁴ S cm−1 (25 °C, 98% RH), which is two orders of magnitude smaller than that of (NH4)2(adp)[Zn2(ox)3]·3H2O.27 In the last part of the paper, we discuss the mechanism of proton conductivity in (NH4)2(adp)[Zn2(ox)3]·3H2O on the basis of presently accessible structural and dynamical information.
2 Experimental
2.1 Samples
(NH4)2(adp)[Zn2(ox)3]·3H2O was prepared by a hydrothermal method with zinc oxide, adipamide, and H2(ox)·2H2O in water using an autoclave at 130 °C. In order to remove bulk water and ensure adsorption equilibrium, the sample was kept in a glove bag with relative humidity RH = 98% for a few hours. After this procedure, all sample handling was done in a glove bag at RH > 95%, to avoid transformation of the trihydrate into the dihydrate form below 85% RH.22 K2(adp)[Zn2(ox)3]·3H2O was synthesized from a mixture of zinc oxide, adipic acid, K2(ox)·H2O, and H2(ox)·2H2O in a water solvent using an autoclave at 130 °C.27 The sample was handled in the same manner.In the neutron scattering experiments, the methylene chains of adipic acid were deuterated in both (NH4)2(adp)[Zn2(ox)3]·3H2O and K2(adp)[Zn2(ox)3]·3H2O, such that their contribution to the scattering signal is low, and the majority arises from the motions of the water, ammonium ions, and carboxyl groups.
2.2 Adiabatic calorimetry
The heat capacity measurements were performed using a custom-built adiabatic calorimeter.28 In adiabatic calorimetry, the heat exchange between the sample and the environment is virtually eliminated and the heat capacity is obtained from a simple relation C = ΔE/ΔT. The technique gives the most accurate absolute value of the heat capacity, with a precision and an accuracy of 0.05 and 0.1%, respectively.(NH4)2(adp)[Zn2(ox)3]·3H2O (0.4153 g; 6.581 × 10⁻⁴ mol) was loaded into the sample cell with helium gas (0.1 MPa) for heat exchange, and the cell was sealed with an indium gasket. The temperature range for the heat capacity measurements was from 5 to 300 K. The temperature increment was 0.5 K at around 5 K, gradually increasing up to 2.5 K at around 300 K. The heat capacity of K2(adp)[Zn2(ox)3]·3H2O (1.001 g; 1.487 × 10⁻³ mol) was measured in the same way.
2.3 Neutron scattering
The dynamics of the molecules and ions in the proton-conducting layers of (NH4)2(adp)[Zn2(ox)3]·3H2O and K2(adp)[Zn2(ox)3]·3H2O were probed using three neutron spectrometers with different energy resolutions, to cover timescales between 0.1 ps and 10 ns (five orders of magnitude).In the fixed window scans at the standard mode, the intensity was recorded at 25 K, 50 K, 75 K, 100 K, 125 K, 150 K, 170 K, and every 10 K from 190 K to 300 K. Data were collected for 40 mins for each point. The QENS data were recorded in both modes at 10 K (for resolution), 100 K, 120 K, 150 K, 180 K, 210 K, 240 K, and 300 K with a counting time of 12 h.
In the fixed window scans, the intensity was recorded at 3.5 K and at every 10 K from 10 K to 300 K. The QENS data were collected at 5 K (for resolution), 100 K, 120 K, 150 K, 180 K, 210 K, 240 K, 270 K, and 300 K with a counting time of 4 h for (NH4)2(adp)[Zn2(ox)3]·3H2O and at 210 K, 240 K, 270 K, and 300 K with a counting time of 6 h for K2(adp)[Zn2(ox)3]·3H2O. The diffraction patterns were simultaneously recorded at every measurement temperature.
The fixed window scan was performed from 4 K to 285 K continuously at a rate of 1 K min−1. The QENS data were recorded at 4 K (for resolution), 65 K, 70 K, 75 K, 80 K, 90 K, 100 K, 120 K, 150 K, 180 K, 200 K, 220 K, and 260 K for (NH4)2(adp)[Zn2(ox)3]·3H2O and at 100 K, 180 K, 200 K, 220 K, 240 K, 270 K, and 300 K for K2(adp)[Zn2(ox)3]·3H2O. The counting time was 10 h for each QENS measurement.
3 Results and discussion
3.1 Adiabatic calorimetry
Fig. 2 and 3 show the heat capacities of (NH4)2(adp)[Zn2(ox)3]·3H2O and K2(adp)[Zn2(ox)3]·3H2O, respectively. Both (NH4)2(adp)[Zn2(ox)3]·3H2O and K2(adp)[Zn2(ox)3]·3H2O exhibited phase transitions at 86 K and 138 K, respectively. They both are higher order transitions without latent heat. This is confirmed by temperature drifts after heating; an endothermic drift is usually observed in first order transitions. The transition in (NH4)2(adp)[Zn2(ox)3]·3H2O is accompanied by a λ-type heat capacity anomaly. On the other hand, the heat capacity exhibits a step-like anomaly at the transition temperature in K2(adp)[Zn2(ox)3]·3H2O. To estimate the entropy change at the transitions, the baseline Cbase was estimated by fitting the heat capacities to a quartic function in the temperature range from 60 K to 80 K (below Ttrs) and from 90 K to 130 K (above Ttrs). For K2(adp)[Zn2(ox)3]·3H2O, the heat capacities were fitted by a cubic function in the temperature range from 70 K to 100 K and from 150 K to 200 K. The baselines are shown as the dashed lines in Fig. 2 and 3. The transition entropy ΔtrsS as a function of temperature is evaluated from the equation: | (1) |
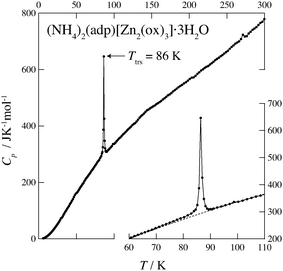 | ||
| Fig. 2 Heat capacity of (NH4)2(adp)[Zn2(ox)3]·3H2O. The inset shows an enlarged plot around the phase transition. The dashed line represents the baseline for the transition. See text for the details. | ||
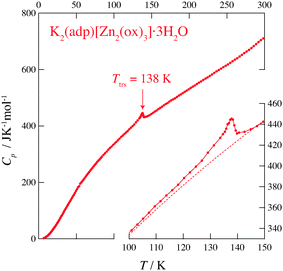 | ||
| Fig. 3 Heat capacity of K2(adp)[Zn2(ox)3]·3H2O. The inset shows an enlarged plot around the phase transition. The dashed line represents the baseline for the transition. See text for the details. | ||
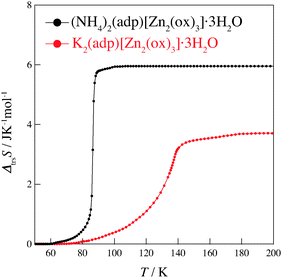
Fig. 4 shows the transition entropies for (NH4)2(adp)[Zn2(ox)3]·3H2O and K2(adp)[Zn2(ox)3]·3H2O. The former drastically increases at T = 86 K while the latter gradually increases in a wide range of temperature. The total (integrated) transition entropies of (NH4)2(adp)[Zn2(ox)3]·3H2O and K2(adp)[Zn2(ox)3]·3H2O are estimated to be 5.95 ± 0.74 J K−1 mol−1 and 3.70 ± 1.56 J K−1 mol−1, respectively. The uncertainty of the transition entropy is due to the arbitrary properties of the baseline; various temperature regions and various orders of polynomial function for the fitting were tested to estimate the uncertainty of the baseline. The transition entropy of 5.95 J K−1 mol−1 is close to R![[thin space (1/6-em)]](https://www.rsc.org/images/entities/char_2009.gif) ln
ln![[thin space (1/6-em)]](https://www.rsc.org/images/entities/char_2009.gif) 2 (= 5.76 J K−1 mol−1), suggesting that the transition at 86 K is an order–disorder phase transition. This may be due to ammonium ions since no ordering transition is observed in K2(adp)[Zn2(ox)3]·3H2O and the transition associated with water molecules usually occurs at higher temperatures due to strong intermolecular hydrogen bonds. On the other hand, the transition entropy of K2(adp)[Zn2(ox)3]·3H2O (3.70 ± 1.56 J K−1 mol−1) is smaller than R
2 (= 5.76 J K−1 mol−1), suggesting that the transition at 86 K is an order–disorder phase transition. This may be due to ammonium ions since no ordering transition is observed in K2(adp)[Zn2(ox)3]·3H2O and the transition associated with water molecules usually occurs at higher temperatures due to strong intermolecular hydrogen bonds. On the other hand, the transition entropy of K2(adp)[Zn2(ox)3]·3H2O (3.70 ± 1.56 J K−1 mol−1) is smaller than R![[thin space (1/6-em)]](https://www.rsc.org/images/entities/char_2009.gif) ln2, so that we consider this transition is of a displacive type.
ln2, so that we consider this transition is of a displacive type.
3.2 Neutron powder diffraction
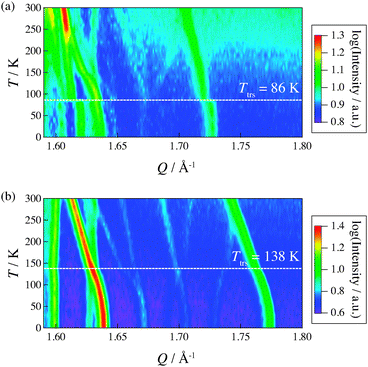
Fig. 5 shows two-dimensional contour intensity maps obtained from the neutron powder diffraction measurements on IRIS. The intensity is given on a logarithmic scale in order to make weak Bragg peaks as well as strong peaks visible.In (NH4)2(adp)[Zn2(ox)3]·3H2O, the Bragg peaks located at Q = 1.60–1.64 Å−1 drastically changed at the transition temperature 86 K. It should be noted that we could not recognize a significant structural change between 50 K and 100 K by single-crystal X-ray diffraction measurements. These results indicate that the phase transition is associated with hydrogen atoms; the hydrogen atoms are hardly detectable by X-rays. The present data also demonstrate that the deuteration of the methylene chain of adipic acid does not change the transition temperature much.
In K2(adp)[Zn2(ox)3]·3H2O, the weak peaks at 1.67 Å−1 and 1.70 Å−1 split above Ttrs = 138 K. Also, the position of Bragg peaks at 1.66 Å−1 and 1.74 Å−1 changed at the transition temperature. Unlike in the case of (NH4)2(adp)[Zn2(ox)3]·3H2O, the change in the diffraction pattern occurs gradually, which is consistent with the fact that the transition entropy gradually changes over a wide temperature range (see Section 3.1). To gain more insight into the arrangement of hydrogen atoms, further accurate neutron diffraction studies are required.
3.3 Mean square displacement
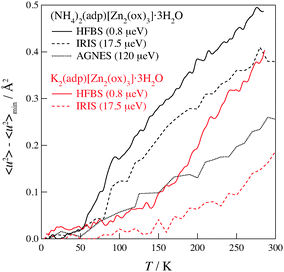
To investigate the temperature at which relaxation processes are activated within the time window of a given spectrometer, the mean square displacement, 〈u2〉, was obtained from an elastic fixed window scan. In the fixed window scan, we measure the elastic intensity I(Q,T) as a function of scattering vector Q and temperature T; the intensity is integrated around ℏω = 0 over a fixed energy region corresponding to the instrumental resolution. The mean square displacement, 〈u2〉, is evaluated from the equation | (2) |
Fig. 6 shows the mean square displacements taken on the three neutron spectrometers with different energy resolutions. As for (NH4)2(adp)[Zn2(ox)3]·3H2O, 〈u2〉 drastically increases above a temperature between 50 and 100 K, indicating the onset of a relaxation. It is noteworthy that 〈u2〉 deviates from the linear relationship at 50 K in HFBS data, at 80 K in IRIS data, and at 100 K in AGNES data. It is reasonable that the HFBS data exhibit a lower onset temperature than the AGNES data, because a slower motion can be observed by an instrument with a higher energy resolution at a given temperature. The deviation also occurred at around 140 K in K2(adp)[Zn2(ox)3]·3H2O. One can naturally understand that the motions of hydrogen atoms get activated above the phase transition temperatures, since the high-temperature (disordered) phase usually has a loosely packed and/or weakly interacting structure. It is exceptional and interesting that the excess increase of 〈u2〉 appeared even below the transition temperature (86 K) in (NH4)2(adp)[Zn2(ox)3]·3H2O.
3.4 Quasi-elastic neutron scattering
 | (3) |
 | (4) |
To obtain the spatial information on the relaxations, we investigated the Q-dependence of the relaxations. The Q regions where strong diffraction peaks appear were omitted from the analysis. Fig. 8 displays Γ as a function of Q at 120, 180, and 240 K on AGNES and at 100 and 220 K on HFBS. No pronounced Q-dependence of Γ implies that these motions of hydrogen atoms are of a local origin. In the measurements on IRIS, similar behavior was observed. Hence, all of the hydrogen motions observed in (NH4)2(adp)[Zn2(ox)3]·3H2O are local relaxations.
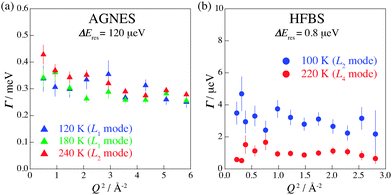 | ||
| Fig. 8 Q-dependence of Γ estimated from the fitting for the data taken on (a) AGNES and (b) HFBS spectrometers. | ||
The mechanisms of the proton diffusion assisted by water molecules are roughly divided into two: i.e., one is the Vehicle mechanism in which a water molecule having a proton, that is a hydronium ion (H3O+), carries a proton for a long distance34 and the other is the Grotthuss mechanism in which a hydronium ion reorients and passes a proton to a neighboring water molecules through a hydrogen bond.35,36 In (NH4)2(adp)[Zn2(ox)3]·3H2O, all of the motions related to hydrogen atoms are local relaxations as mentioned above. We thus conclude that the protons in (NH4)2(adp)[Zn2(ox)3]·3H2O are carried through the Grotthuss mechanism.
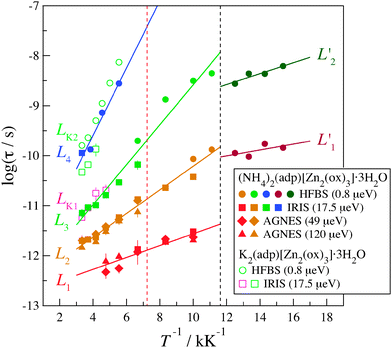
There exist four relaxation modes (L1, L2, L3, and L4) in (NH4)2(adp)[Zn2(ox)3]·3H2O. These relaxation modes were observed by two different instruments though their observation temperatures are sometimes different. This fact increases the reliability of the analysis and the related discussion. It is noteworthy that the data of each relaxation lie on each straight line, meaning that all relaxations follow the Arrhenius law in the whole temperature range. For each relaxation mode, the activation energy, ΔEa, of the relaxation is obtained from the slope of the plots assuming the Arrhenius equation
 | (5) |
| Mode | ΔEa (T > Ttrs) | Mode | ΔEa (T < Ttrs) |
|---|---|---|---|
| L 1 | 2.3 kJ mol−1 | L 1′ | 1.1 kJ mol−1 |
| L 2 | 4.5 kJ mol−1 | L 2′ | 2.1 kJ mol−1 |
| L 3 | 7.7 kJ mol−1 | ||
| L 4 | 12.9 kJ mol−1 |
On the other hand, in K2(adp)[Zn2(ox)3]·3H2O, only two relaxations LK1 and LK2 were observed around the positions of L3 and L4 of (NH4)2(adp)[Zn2(ox)3]·3H2O, respectively. From the results mentioned above, it is reasonably concluded that L1 and L2 of (NH4)2(adp)[Zn2(ox)3]·3H2O are associated with the motions of NH4+ ions, while L3, L4, LK1, and LK2 are the motions of H2O molecules. The small activation energies of the L1 and L2 modes reflect the fact that the hydrogen bonds of ammonium ions are weaker than those of water molecules. We accept the possibility that the slowest mode (L4) is assigned to the relaxation of COOH groups of adipic acid.
Why do two different types of motions related to ammonium ions exist? From the structural data obtained by the single crystal X-ray diffraction,22 the two NH4+ ions are located at the crystallographically equivalent sites. On the other hand, there are two crystallographically distinct sites for the three H2O molecules; two H2O molecules are located in the two crystallographically equivalent sites, whereas the 3rd H2O molecule is positionally disordered between another two equivalent sites with an occupancy of 50%. The NH4+ ions may be affected by the presence or absence of adjacent water molecules, and may have different activation energies.
Next, we discuss the relation between the phase transitions and the relaxation motions. In (NH4)2(adp)[Zn2(ox)3]·3H2O, the relaxations obviously changed at the transition temperature as shown in Fig. 9. It was confirmed that there is no relaxation below the transition temperature in a shorter time region of L1′. This measurement was performed by DCS (NCNR, NIST, USA),37 a chopper spectrometer suitable for a time region between 10−10 s and 10−12 s. In general, molecular/ionic motions do not become faster below the transition temperature; therefore, it is speculated that the two relaxations observed below the transition temperature are the motions of ammonium ions. It is interesting to note that the activation energy below the transition temperature is lower than that above the temperature. It may suggest that the quantum tunneling plays a role in the relaxational process. Further studies are required to address this issue.
In K2(adp)[Zn2(ox)3]·3H2O, no relaxation was observed below the transition temperature. This suggests that the carboxyl groups and water molecules become frozen at the transition temperature, 138 K. Thus, the phase transition of (NH4)2(adp)[Zn2(ox)3]·3H2O at 86 K is entirely different from that of K2(adp)[Zn2(ox)3]·3H2O at 138 K.
 | (6) |
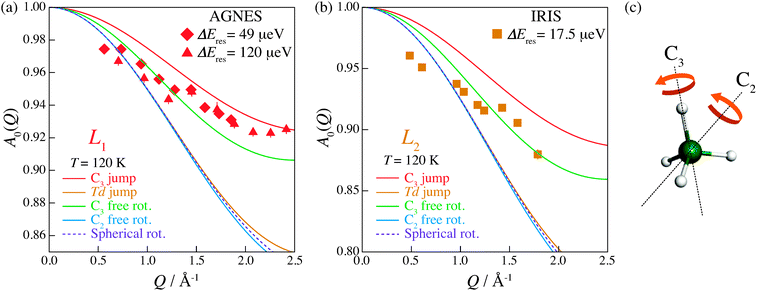
The EISF varies as a function of Q, depending on the dynamical model.38,39 In an ammonium ion, four hydrogen atoms surround a central nitrogen atom with tetrahedral symmetry. The contribution from the incoherent scattering of nitrogen atoms can be neglected, so that the incoherent scattering reflects only the motion of the hydrogen atoms. We considered several dynamic models; a jump about a threefold axis (C3 jump), a jump among the apices of a tetrahedron (Td jump), a continuous rotation about a threefold axis (C3 free rot.), a continuous rotation about a twofold axis (C2 free rot.), and an isotropic rotation on the circumscribed sphere of the tetrahedron (Spherical rot.). Note that a jump about the C2 axis is indistinguishable from that about the C3 axis. The A0s for the reorientation of the ammonium ion are given by
 | (7) |
 | (8) |
 | (9) |
 | (10) |
| A0 (Spherical rot.) = j02 (Qr), | (11) |
3.5 Proton conducting path
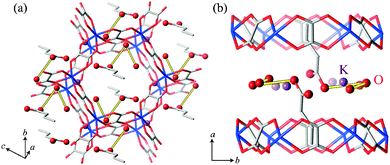
Finally, we discuss proton conducting pathways in (NH4)2(adp)[Zn2(ox)3]·3H2O and K2(adp)[Zn2(ox)3]·3H2O. As mentioned before, the protons are carried through the Grotthuss mechanism with H2O molecules, NH4+ ions (for (NH4)2(adp)[Zn2(ox)3]·3H2O), and –COOH groups of adipic acid located in the proton conducting layers. Since the positions of hydrogen atoms were not determined by the X-ray diffraction,22 we consider the oxygen and nitrogen atoms which can be associated with the hydrogen bonds. Table 2 lists the possible hydrogen bonds with bond lengths shorter than 3.1 Å that can be considered to be the largest limit for the hydrogen-bond formation. The number of hydrogen bonds in (NH4)2(adp)[Zn2(ox)3]·3H2O is three times larger than that in K2(adp)[Zn2(ox)3]·3H2O. These bonds are schematically shown in Fig. 11 and 12 for (NH4)2(adp)[Zn2(ox)3]·3H2O and K2(adp)[Zn2(ox)3]·3H2O, respectively. There exists an obvious hydrogen-bond network in the proton conducting layers of (NH4)2(adp)[Zn2(ox)3]·3H2O. On the other hand, hydrogen bonds neither form a network nor percolate over the proton conducting layer in K2(adp)[Zn2(ox)3]·3H2O. Evidently, the ammonium ions have a key role in forming the hydrogen-bond network; there are 3–4 hydrogen bonds between N(1) and O(n) (n = 8, 9, 10). We speculate that the high proton conductivity in (NH4)2(adp)[Zn2(ox)3]·3H2O is realized not only by many proton conducting paths but also by the high mobility of ammonium ions (rotation around the C3 axis with small activation energy). This would have to be confirmed through the determination of the exact positions of hydrogen atoms forming the hydrogen bonds.| Sample | Label | From molecule/ion | Label | To molecule/ion | Bond length d (Å) |
|---|---|---|---|---|---|
| (NH4)2(adp)[Zn2(ox)3]·3H2O | O(9) | H2O | O(10) | H2O | 2.64(1) |
| N(1) | NH4+ | O(10) | H2O | 2.79(1) | |
| N(1) | NH4+ | O(8) | –COOH | 2.84(2) | |
| N(1) | NH4+ | O(9) | H2O | 2.85(1) | |
| N(1) | NH4+ | O(8) | –COOH | 2.95(1) | |
| O(7) | –COOH | O(10) | H2O | 2.99(1) | |
| O(7) | –COOH | O(9) | H2O | 3.04(1) | |
| K2(adp)[Zn2(ox)3]·3H2O | O(9) | H2O | O(10) | H2O | 2.71(1) |
| O(8) | –COOH | O(10) | H2O | 3.04(1) | |
4 Conclusion
In this paper, in order to elucidate the relation between the proton conductivity and phase transitions, we have performed adiabatic calorimetry and neutron powder diffraction experiments for (NH4)2(adp)[Zn2(ox)3]·3H2O and K2(adp)[Zn2(ox)3]·3H2O, as well as QENS measurements to get insights into the mechanism for proton conduction. The adiabatic calorimetry revealed that (NH4)2(adp)[Zn2(ox)3]·3H2O and K2(adp)[Zn2(ox)3]·3H2O exhibit higher-order phase transitions at 86 K and 138 K, respectively. These transitions were also observed by the neutron powder diffraction measurement and the fixed window scan. In the QENS measurements, since Γ (HWHM of Lorentz function) is independent of Q, it is evident that the protons in (NH4)2(adp)[Zn2(ox)3]·3H2O are carried through the Grotthuss mechanism. By using the three spectrometers with different energy resolutions, we have succeeded to observe the overall feature of dynamics: there exist four and two relaxation motions in (NH4)2(adp)[Zn2(ox)3]·3H2O and K2(adp)[Zn2(ox)3]·3H2O, respectively. It is speculated that two fast rotational motions of ammonium ions having very small activation energy play a key role in the high proton conductivity in (NH4)2(adp)[Zn2(ox)3]·3H2O. We discuss the hydrogen-bond pathways in proton conducting layers using the previous structural data. We found that hydrogen-bond networks are well constructed by H2O and NH4+ in (NH4)2(adp)[Zn2(ox)3]·3H2O. This network can contribute to the Grotthuss mechanism of proton conduction. In order to further investigate the proton conducting mechanism, it is essential to determine the crystal structure and specifically the positions of the H atoms by means of a high resolution neutron diffractometer.Disclaimer
The identification of commercial products does not imply endorsement by the National Institute of Standards and Technology nor does it imply that these are the best for the purpose.Acknowledgements
The authors thank Dr John R. D. Copley (NCNR, NIST) for the DCS measurement, and Dr Kunihisa Sugimoto (SPring-8) and Dr Akihito Fujiwara (SPring-8) for the single-crystal X-ray diffraction measurement at low temperature. The HFBS experiment at NCNR was financially supported by Institute for Solid State Physics, the University of Tokyo, through the Travel Expense Support for the Overseas program. This work utilized facilities supported in part by the National Science Foundation under Agreement No. DMR-0944772.References
- H. K. Chae, D. Y. Siberio-Perez, J. Kim, Y. Go, M. Eddaoudi, A. J. Matzger, M. O'Keeffe and O. M. Yaghi, Nature, 2004, 427, 523 CrossRef CAS PubMed.
- X. Zhao, B. Xiao, J. A. Fletcher, K. M. Thomas, D. Bradshaw and M. J. Rosseinsky, Science, 2004, 306, 1012 CrossRef CAS PubMed.
- R. Matsuda, R. Kitaura, S. Kitagawa, Y. Kubota, R. V. Beloslusov, T. C. Kobayashi, H. Sakamoto, T. Chiba, M. Tanaka, Y. Kawazoe and Y. Mita, Nature, 2005, 436, 238 CrossRef CAS PubMed.
- J. S. Seo, D. Whang, H. Lee, S. I. Jun, J. Oh, Y. J. Jeon and K. Kim, Nature, 2000, 404, 982 CrossRef CAS PubMed.
- C.-D. Wu, A. Hu, L. Zhang and W. Lin, J. Am. Chem. Soc., 2005, 127, 8940 CrossRef CAS PubMed.
- H. Kitagawa, Y. Nagao, M. Fujishima, R. Ikeda and S. Kanda, Inorg. Chem. Commun., 2003, 6, 346 CrossRef CAS.
- H. Ōkawa, M. Sadakiyo, T. Yamada, M. Maesato, M. Ohba and H. Kitagawa, J. Am. Chem. Soc., 2013, 135, 2256 CrossRef PubMed.
- M. Sadakiyo, H. Ōkawa, A. Shigematsu, M. Ohba, T. Yamada and H. Kitagawa, J. Am. Chem. Soc., 2012, 134, 5472 CrossRef CAS PubMed.
- G. Xu, K. Otsubo, T. Yamada, S. Sakaida and H. Kitagawa, J. Am. Chem. Soc., 2013, 135, 7438 CrossRef CAS PubMed.
- J. M. Taylor, R. K. Mah, I. L. Moudrakovski, C. I. Ratcliffe, R. Vaidhyanathan and G. K. H. Shimizu, J. Am. Chem. Soc., 2010, 132, 14055 CrossRef CAS PubMed.
- N. C. Jeong, B. Samanta, C. Y. Lee, O. K. Farha and J. T. Hupp, J. Am. Chem. Soc., 2012, 134, 51 CrossRef CAS PubMed.
- D. Umeyama, S. Horike, M. Inukai, Y. Hijikata and S. Kitagawa, Angew. Chem., Int. Ed., 2011, 50, 1 CrossRef.
- G. Ferey, C. Mellot-Draznieks, C. Serre and F. Millange, Acc. Chem. Res., 2005, 38, 217 CrossRef CAS PubMed.
- S. Kitagawa, R. Kitaura and S. Noro, Angew. Chem., Int. Ed., 2004, 43, 2334 CrossRef CAS PubMed.
- O. M. Yaghi, M. O'Keeffe, N. W. Ockwig, H. K. Chae, M. Eddaoudi and J. Kim, Nature, 2003, 423, 705 CrossRef CAS PubMed.
- K. D. Kreuer, S. J. Paddison, E. Spohr and M. Schuster, Chem. Rev., 2004, 104, 4637 CrossRef CAS.
- K. D. Kreuer, Chem. Mater., 1996, 8, 610 CrossRef CAS.
- B. C. Steele and A. Heinzel, Nature, 2001, 414, 345 CrossRef CAS PubMed.
- Y. Nagao, R. Ikeda, S. Kanda, Y. Kubozono and H. Kitagawa, Mol. Cryst. Liq. Cryst., 2002, 379, 89 CrossRef CAS.
- Y. Nagao, M. Fujishima, S. Kanda, R. Ikeda and H. Kitagawa, Synth. Met., 2003, 133–134, 431 CrossRef CAS.
- T. Yamada, M. Sadakiyo and H. Kitagawa, J. Am. Chem. Soc., 2009, 131, 3144 CrossRef CAS PubMed.
- M. Sadakiyo, T. Yamada and H. Kitagawa, J. Am. Chem. Soc., 2009, 131, 9906 CrossRef CAS PubMed.
- S. Bureekaew, S. Horike, M. Higuchi, M. Mizuno, T. Kawamura, D. Tanaka, N. Yanai and S. Kitagawa, Nat. Mater., 2009, 8, 831 CrossRef CAS PubMed.
- A. Shigematsu, T. Yamada and H. Kitagawa, J. Am. Chem. Soc., 2011, 133, 2034 CrossRef CAS PubMed.
- T. Yamada, R. Yonamine, T. Yamada, H. Kitagawa and O. Yamamuro, J. Phys. Chem. B, 2010, 114, 8405 CrossRef CAS PubMed.
- T. Yamada, R. Yonamine, T. Yamada, H. Kitagawa, M. Tyagi, M. Nagao and O. Yamamuro, J. Phys. Chem. B, 2011, 115, 13563 CrossRef CAS PubMed.
- M. Sadakiyo, T. Yamada and H. Kitagawa, submitted.
- O. Yamamuro, M. Oguni, T. Matsuo and H. Suga, Bull. Chem. Soc. Jpn., 1987, 60, 1269 CrossRef CAS.
- T. Kajitani, K. Shibata, S. Ikeda, M. Kohgi, H. Yoshizawa, K. Nemoto and K. Suzuki, Physica B, 1995, 213–214, 872 CrossRef.
- O. Yamamuro, Y. Inamura, Y. Kawamura, S. Watanabe, T. Asami, H. Yoshizawa, Annual Report of Neutron Science Laboratory, Institute for Solid state Physics, University of Tokyo, 2005, 12, 12.
- C. J. Carlile and M. A. Adams, Physica B, 1992, 182, 431 CrossRef CAS.
- A. Meyer, R. M. Dimeo, P. M. Gehring and D. A. Neumann, Rev. Sci. Instrum., 2003, 74, 2759 CrossRef CAS PubMed.
- R. T. Azuah, L. R. Kneller, Y. Qiu, P. L. W. Tregenna-Piggott, C. M. Brown, J. R. D. Copley and R. M. Dimeo, J. Res. Natl. Inst. Stand. Technol., 2009, 114, 341 CrossRef CAS.
- K. D. Kreuer, A. Rabenau and W. Weppner, Angew. Chem., Int. Ed. Engl., 1982, 21, 208 CrossRef.
- N. Agmon, Chem. Phys. Lett., 1995, 244, 456 CrossRef CAS.
- X. Ke and I. Tanaka, Solid State Ionics, 2004, 172, 145 CrossRef CAS PubMed.
- J. R. D. Copley and J. C. Cook, Chem. Phys., 2003, 292, 477 CrossRef CAS.
- M. Bée, Physica B, 1992, 182, 323 CrossRef.
- T. Yildirim, P. M. Gehring, D. A. Neumann, P. E. Eaton and T. Emrick, Phys. Rev. B: Condens. Matter Mater. Phys., 1999, 60, 314 CrossRef CAS.
| This journal is © the Owner Societies 2014 |

