Sulfur-doped graphene as a potential alternative metal-free electrocatalyst and Pt-catalyst supporting material for oxygen reduction reaction†
Ji-eun
Park
a,
Yu Jin
Jang
a,
Yeo Jin
Kim
a,
Mi-sun
Song
b,
Seokhyun
Yoon
b,
Dong Ha
Kim
*a and
Sung-Jin
Kim
*a
aDepartment of Chemistry and Nano Science, Global Top 5 Program, Division of Molecular and Life Sciences, College of Natural Sciences, Ewha Womans University, 52, Ewhayeondae-gil, Seodaemun-gu, Seoul 120-750, Korea. E-mail: dhkim@ewha.ac.kr; sjkim@ewha.ac.kr; Fax: +82-2-3277-4546; Fax: +82-2-3277-3419; Tel: +82-2-3277-4517 Tel: +82-2-3277-2350
bDepartment of Physics, Division of Molecular and Life Sciences, College of Natural Sciences, Ewha Womans University, 52, Ewhayeondae-gil, Seodaemun-gu, Seoul 120-750, Korea
First published on 18th October 2013
Abstract
In this study, sulfur-doped graphene (S-graphene) was synthesized by thermal treatment of exfoliated graphene under CS2 gas flow. Its electrocatalytic activity as a metal-free catalyst was evaluated and compared with other doped-graphenes and commercial platinum nanoparticles loaded on carbon black (Pt/C) catalysts for oxygen reduction reaction (ORR) in fuel cell cathodes. The resultant S-graphene was shown to act as a viable catalyst for ORR and its limiting current density and durability were improved compared to those of the commercial Pt/C catalyst. The current density at −1.0 V for the commercial Pt/C catalyst, pristine graphene, nitrogen-doped graphene (N-graphene) and S-graphene was 4.7, 0.15, 6.26 and 6.99 mA cm−2, respectively. The durability of S-graphene (70.3%) was much better compared to commercial Pt/C (37.2%) and N-graphene (67.9%). When S-graphene was used as a supporting material for Pt nanoparticles, its catalytic performance was significantly higher than other Pt catalysts supported on different doped graphenes. Here, we demonstrate that S-graphene can be used as a novel graphene-based efficient metal-free ORR catalyst in fuel cells.
Introduction
A fuel cell is a green energy conversion device that generates electricity by electrochemically combining fuel through electrodes and across an ion conducting electrolyte. It has been attracting increasing attention in recent decades, because it can convert chemical energy into electrical energy with much higher conversion efficiencies than other conventional systems.1,2 Moreover, these devices do not run down or require any recharging, which is unlike a battery, and can produce energy as long as fuel is supplied. At the anode, the fuels are oxidized, releasing electrons and creating H+ ions. At the cathode, oxygen reacts with electrons taken from the electrode and H+ ions from the electrolyte to form water. However, this oxygen reduction reaction (ORR) process is very slow in nature, so catalysts must be used to boost the efficiency of fuel cells. Traditionally, platinum (Pt) and its alloys have been used as electrocatalysts for ORR.3–5 However, the Pt-based catalysts suffer from very limited reserves, high cost, susceptibility to time-dependent drift and CO poisoning. Thus, there is a need to identify non-precious metals or even metal-free catalysts to reduce or replace the Pt-based catalysts in fuel-cell technologies.Recent studies have demonstrated that carbon materials doped with non-metal elements such as nitrogen, phosphorus or boron atoms have pronounced catalytic activity.6 Vertically aligned nitrogen-doped carbon nanotubes have been used as ORR catalysts.7 These catalysts showed a higher electrocatalytic activity, long-term operation stability and tolerance against the poison effects than Pt electrodes. Meanwhile, graphene, a carbon allotrope, has unique physical and chemical properties, such as high mechanical strength, transparency, surface area and excellent conductivity.8–10 It has also been reported that graphene doped with nitrogen, phosphor or boron atoms displays pronounced catalytic activity.6 Various synthetic methods of producing nitrogen-doped graphene (N-graphene) have been developed and its high electrocatalytic activity toward ORR has been studied.11–13 Theoretical studies confirmed that breaking the electroneutrality of graphitic materials to create charged sites favorable for O2 adsorption is a key factor in enhancing ORR activity.14 It was reported that sulfur-doped graphene (S-graphene) has similar energy for O2 absorption to boron-doped graphene (B-graphene).15 Therefore, one can expect that S-graphene could act as an effective ORR catalyst with activity comparable to B-graphene.16 Although many studies have evaluated ORR catalysis based on heteroatom-doped carbon materials, more in-depth studies on the performance of S-graphene are still lacking. Very recently Shaoming' group and Liang' group fabricated S-graphene by annealing graphene oxide (GO) with benzyl disulfide and reported that it exhibited comparable catalytic activity to the commercial Pt/C catalyst.17,18
In this study, we prepared high-quality S-graphene with a lower content of oxygen-containing sulfur groups, using fluorinated graphite intercalation compounds (FGIC)-derived graphene9 as the starting material. We performed the sulfur-doping process at a comparatively lower temperature, 850 °C, and atmospheric pressure using a liquid precursor. The performance of S-graphene was compared with pristine graphene and N-graphene in terms of onset potential and limiting current density. Furthermore, we evaluated the potential of graphene, N-graphene and S-graphene as a support material for Pt nanoparticles (NPs).
Experimental details
Sample preparation
Materials characterization
High-resolution transmission electron microscopy (HRTEM) was performed using a JEOL (2100F) operated at an accelerating voltage of 200 kV. For TEM imaging, the synthesized samples were dispersed in ethanol and drop cast onto a 200-mesh Cu grid. Powder X-ray diffraction (PXRD) patterns were acquired using a Bruker diffractometer (D/max 2200), with Ni-filtered Cu Kα radiation (λ = 1.5418 Å) from the powder samples, which were placed on a glass substrate. Raman measurements were carried out using a confocal microscope (Renishaw InVia System) with a 100× (0.9 NA) microscope objective. A 632.8 nm He–Ne laser light was used as the excitation source with a laser power of 0.57 mW. X-ray photoelectron spectroscopy (XPS) was performed using an ESCALab spectrometer (Thermo VG, U.K.) with monochromated Al-Kα radiation. Microanalysis was performed with a Perkin Elmer 240 elemental analyzer at Organic Chemistry Research Center, Sogang University, Korea.Electrochemical tests
20 mg of an electrocatalyst was dispersed in 4 g of N,N-dimethylformamide (DMF) by sonication. 1 μL of the suspension was dropped onto a working electrode and 2 μL of a 0.5 wt% Nafion solution was applied. Electrochemical tests were performed in a conventional three-electrode system using a potentiostat (Autolab PGSTAT302N, EcoChemie) with a glassy carbon electrode, an Ag/AgCl electrode and a Pt foil as the working, reference and counter electrode, respectively. Cyclovoltammograms (CVs) were recorded in a N2- or O2-saturated 0.1 M KOH solution. The potential range was set between −1.0 and +0.2 V at a scan rate of 100 mV s−1 at room temperature. Electrocatalytic activity of the catalysts was examined by monitoring the oxygen reduction current of the cathode catalyst with an electrochemical cell using a rotating disk electrode (RDE) at a scan rate of 10 mV s−1 in O2-saturated 0.1 M KOH. Chronoamperometric (CA) measurements for NG, SG and the commercial Pt/C catalyst (20 wt% of Pt loading, E-TEK division, PeMEAS Fuel Cell Technologies) were performed at −0.30 V for 20![[thin space (1/6-em)]](https://www.rsc.org/images/entities/char_2009.gif) 000 s. O2-saturated 0.1 M KOH was used as an electrolyte.
000 s. O2-saturated 0.1 M KOH was used as an electrolyte.
Results and discussion
1. Preparation and characterization of SG
A typical TEM image of SG850 which appeared as a transparent sheet with wrinkled and folded features is shown in Fig. 1(a). The selected area electron diffraction (SAED) pattern (inset of Fig. 1(a)) revealed a broad ring-like diffraction pattern with symmetric hexagonal dispersed bright spots. This observation can be ascribed to the presence of S-doped sites in the SG structure. The characteristic (002) peak of graphite was observed at 26.45–25.04° from the PXRD patterns of all SGs (Fig. S2, ESI†). The calculated interlayer distance of SGs was in the range of 0.34–0.36 nm, which was slightly larger than that of graphite crystal structure with 0.34 nm. To confirm the presence of S atoms in the graphene, HRTEM with elemental composition mapping analysis was performed. As shown in Fig. 1(b), we can observe that the S atoms were homogeneously distributed throughout the investigated sample area.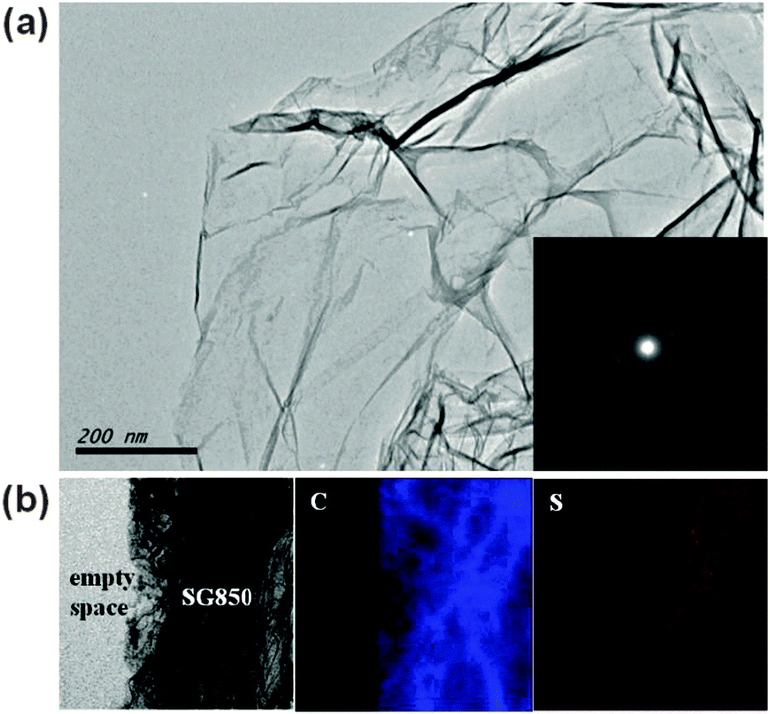 | ||
| Fig. 1 TEM and elemental analysis of the S-graphene films. (a) Low-magnification TEM image showing a few layers of the SG850 film on a grid. Inset shows the corresponding electron diffraction pattern. (b) High magnification TEM images showing SG850 film regions consisting of carbon, sulfur element mapping image. | ||
To probe the elemental composition and the nature of the chemical bonding of the resulting SGs, X-ray photoelectron spectroscopy (XPS) and Raman spectroscopy were performed. Characteristic peaks of C 1s and O 1s were observed at ∼285 eV and ∼534 eV, respectively, as shown in the XPS survey spectra for G and SGs (Fig. 2(a)). In the XPS spectra of SGs, we observed a distinct peak corresponding to S 2p at ∼164 eV, which was not observed in a typical spectrum of pristine graphene. The high resolution XPS C 1s spectrum (Fig. S3(a), ESI†) can be deconvoluted into three components. The main peak at 284.5 eV was assigned to sp2 hybridized C atoms in graphene, indicating that most of the carbon atoms remained in the conjugated honeycomb lattice. The two broad peaks located at 285.8 eV and 286.8 eV were assigned to sp2 C atoms bonded to S and carbonyl groups, such as C![[double bond, length as m-dash]](https://www.rsc.org/images/entities/char_e001.gif) O or O–C–O, respectively. The high resolution S 2p spectrum of SGs can be deconvoluted into two peaks at 163.6 and 165.3 eV (Fig. 2(b)). This observation is consistent with the reported S 2p3/2 (S1) and S 2p1/2 (S2) positions of thiophenic S.21,22 Thus, it can be inferred that the S has mainly thiophene-like structure. However, XPS results of S-graphene prepared by Shaoming et al. showed extra S 2p peaks located over 165.5 eV. Those peaks can be attributed to oxygen-containing S groups, such as C–SOx–C (x = 2, 3, 4),17 confirming that their S-graphene retains oxygen-containing S species compared to our S-graphene. According to these XPS data, the annealing temperature was shown to play a very important role in dictating the S content in graphene. It is worth noting that when the temperature was increased from 600 to 850 °C, the S content became dominant, implying that more S atoms were incorporated into the graphene. However, when the annealing temperature was higher than 850 °C, the S content was significantly decreased. The S/C atomic ratios (%) in SG600, SG700, SG800, SG850 and SG900 estimated from XPS peaks were 0.73, 0.94, 1.79, 2.00 and 1.04, respectively. We also carried out elemental analysis and a similar trend of 0.59, 0.80, 1.39, 1.98 and 0.96% was obtained for SG600, SG700, SG800, SG850 and SG900, respectively.
O or O–C–O, respectively. The high resolution S 2p spectrum of SGs can be deconvoluted into two peaks at 163.6 and 165.3 eV (Fig. 2(b)). This observation is consistent with the reported S 2p3/2 (S1) and S 2p1/2 (S2) positions of thiophenic S.21,22 Thus, it can be inferred that the S has mainly thiophene-like structure. However, XPS results of S-graphene prepared by Shaoming et al. showed extra S 2p peaks located over 165.5 eV. Those peaks can be attributed to oxygen-containing S groups, such as C–SOx–C (x = 2, 3, 4),17 confirming that their S-graphene retains oxygen-containing S species compared to our S-graphene. According to these XPS data, the annealing temperature was shown to play a very important role in dictating the S content in graphene. It is worth noting that when the temperature was increased from 600 to 850 °C, the S content became dominant, implying that more S atoms were incorporated into the graphene. However, when the annealing temperature was higher than 850 °C, the S content was significantly decreased. The S/C atomic ratios (%) in SG600, SG700, SG800, SG850 and SG900 estimated from XPS peaks were 0.73, 0.94, 1.79, 2.00 and 1.04, respectively. We also carried out elemental analysis and a similar trend of 0.59, 0.80, 1.39, 1.98 and 0.96% was obtained for SG600, SG700, SG800, SG850 and SG900, respectively.
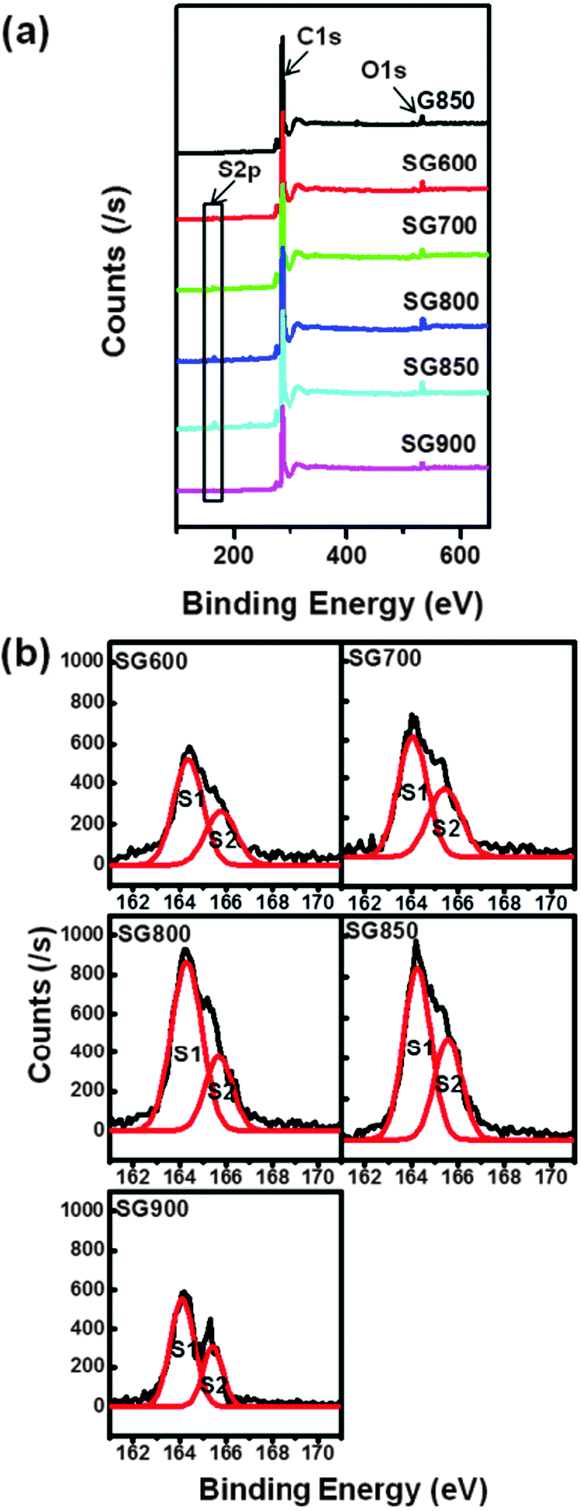 | ||
| Fig. 2 (a) XPS survey spectra of pristine graphene (G850) and S-graphenes (SG600, 700, 800, 850, and 900). The typical peaks at ∼164 eV, ∼285 eV and ∼534 eV correspond to S 2p, C 1s and O 1s, respectively. (b) S 2p spectrum of S-graphenes. The S 2p peak can be split into two Lorentzian peaks at 163.6 and 165.3 eV corresponding to 2p3/2 (S1) and 2p1/2 (S2) of thiophene-S. | ||
Raman spectroscopy has been widely used to evaluate the number of layers, degree of order and doping information of graphene.23,24 Raman spectra of the SG sheets synthesized at different temperatures are displayed in Fig. 3. Two typical peaks were observed for all samples, which were attributed to the D band at ∼1350 cm−1 and G band at ∼1580 cm−1, respectively. The D band corresponds to the breathing mode of the sp2 ring of the graphene layer, which is related to a series of defects, such as bond angle disorder, bond length disorder, and hybridization, which are caused by heteroatom doping and structural defects. The G band is related to the in-plane bond-stretching motion of the pairs of sp2 C atoms. In addition, the D′ band partially merged with the G band is observed at ∼1620 cm−1, which was related to the non-zero phonon density of states above the G band in graphite. The intensities of the D and D′ band for SGs were higher than those of pristine graphene. The intensity ratio of the D to G band (ID/IG) has commonly been used to evaluate the defect density in graphene. The relatively high ID/IG ratio of the SGs relative to pristine graphene could be ascribed to a more structural distortion caused by S doping. Furthermore, when the annealing temperature was increased, the ID/IG ratio of SG decreased. This indicates that the graphitic degree of SGs was improved accordingly due to the reduction effect and self-repairing effect of the graphene layer at high temperature.25 Another interesting change in the Raman spectra after S doping was the slight downshift (3–9 cm−1) of the G band. A similar downshift in the G band was also reported previously for N-graphene.25 The G band is sensitive to the chemical doping state and it was reported that doped n-type graphene or adsorption of molecules with electron-donating groups leads to downshifts and stiffening of the G band.6
 | ||
| Fig. 3 Raman spectra of pristine graphene (G850) and S-graphenes (SG600, SG700, SG800, SG850 and SG900). Laser wavelength 514.532 nm (Ar-ion laser), power = 0.3 mW. The D (∼1350 cm−1), G (∼1580 cm−1) and D′ (∼1620 cm−1) peaks are labelled. | ||
2. Study of electrocatalytic properties
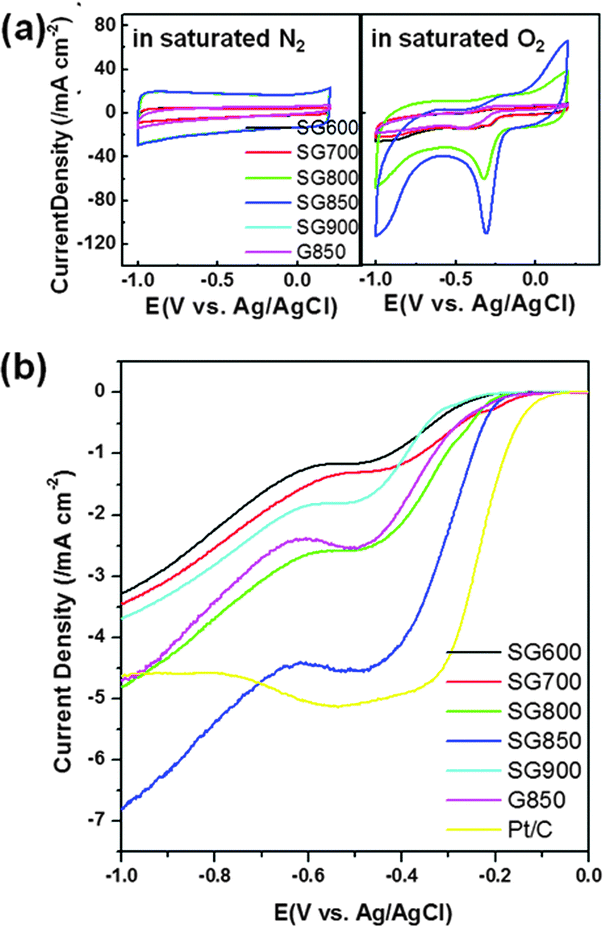 | ||
| Fig. 4 (a) CV curves of oxygen reduction on the pristine graphene (G850) and S-graphene (SG600, 700, 800, 850 and 900) electrodes in a N2 or O2-saturated 0.1 M KOH solution. (b) LSV curves for oxygen reduction for the graphene (G850), S-graphenes (SG600, 700, 800, 850 and 900) and commercial Pt/C catalyst (20 wt% of Pt loading, E-TEK) in an O2-saturated 0.1 M KOH solution with a rotation rate of 2500 rpm. | ||
To gain further insight into the ORR activity of S-graphene samples, linear sweep voltammetry (LSV) measurements were performed on a RDE at a rotation rate of 2500 rpm. For comparison, the LSV profiles of pristine graphene (G850) and commercial Pt/C catalyst (E-TEK, 20% Pt loading) were also recorded together with those of the S-graphene samples synthesized at different temperatures (Fig. 4(b)). The ORR activity of the S-graphene samples was in the following order: SG850 > SG800 > SG900 > SG700 > SG600, which corresponded to the sulfur content analyzed in graphene. This result demonstrates that the ORR activity of S-graphene increased with increasing the content of incorporated sulfur. The activity of SG850 was compared with a commercial Pt/C catalyst (E-TEK). In terms of onset potential, all graphene samples, regardless of sulfur incorporation, showed significantly lower ORR activities with high onset potentials compared with the commercial Pt/C catalyst (E-TEK). However, in terms of the current density, the activity of the SG850 was the highest among all the samples, including the commercial Pt/C catalyst (E-TEK) in the region above the potential of −0.7 V. Based on these combined results, SG850 holds a great promise for use as a metal-free cathode material with a high catalytic activity for ORR.
 | ||
| Fig. 5 (a) LSV curves for oxygen reduction on the graphene (G850), N-graphene (NG850) and S-graphene (SG850) in an O2-saturated 0.1 M KOH solution at various rotation rates. (b) The plot of onset potential and current density at −1.0 V of ORR on G850, NG850 and SG850 electrodes. (c) I–t chronoamperometric responses of the NG850, SG850 and commercial Pt/C catalyst (20 wt% of Pt loading, E-TEK) electrode at −0.30 V in O2-saturated 0.1 M KOH for 20000 s. | ||
The onset potential and current density of graphene electrodes are compared in Fig. 5(b). The onset potential for the G850 electrode commenced around −0.15 V, whereas the onset potential for the NG850 and SG850 electrodes exhibited significant positive shifts to −0.09 and −0.11 V, respectively. This result shows that the NG850 and SG850 exhibited better activity than G850, and NG850 showed slightly higher activity than SG850 in terms of the onset potential. However, the electrocatalytic activity of graphenes toward ORR in terms of the onset potential was still slightly poorer than that of the commercial Pt/C catalyst (E-TEK) (−0.08 V). In terms of the current density, SG850 (6.99 mA cm−2) showed slightly higher electrocatalytic activity than NG850 (6.26 mA cm−2). At the first step in the ORR process, O2 is absorbed on the catalyst surface, implying that adsorption energy for O2 can be an important factor to the ORR. It was previously reported that S-graphene has higher adsorption energy (−0.034 eV) for O2 than N-graphene (−0.149 eV);15 thus, it was predicted that S-graphene may show lower catalytic activity toward ORR than N-graphene. According to the results of the onset potential and electron transfer number, N-graphene was found to be a more suitable catalyst than S-graphene, whereas the results of the current density showed that S-graphene was a more active catalyst. There is a possible reason for the better activity of S-graphene than N-graphene in terms of the current density. The activity may be related to the configuration of the dopant atom in doped-graphenes. In the case of the N atoms incorporated in NG850, three types of N species were identified; pyridinic nitrogen (N1: located at 398.43 eV, 43.0%), pyrrolic nitrogen (N2: located at 400.12 eV, 50.7%) and graphitic nitrogen with a relatively lower content (N3: located at 401.10 eV, 6.2%) (Fig. S3(b), ESI†). According to recent reports, graphitic nitrogen-containing graphenes exhibited a higher ORR activity with large current density than pyridinic and pyrrolic nitrogen-containing ones.13 The SG850 investigated in this study had only a thiophene-type sulfur bonding, implying that the graphitic nitrogen analogue of sulfur bonding might be more effective in ORR than pyridinic and pyrrolic types of nitrogen. Moreover, Antonietti et al. reported that sulfur doping induces more strain and defect sites in the carbon material than nitrogen doping, because of the larger atomic size of sulfur than that of nitrogen. This may facilitate charge localization and the coupled chemisorption of oxygen. In addition, S-graphene can easily interact with molecules in the surrounding electrolyte via the lone pairs of sulfur in the polarizable d-orbitals than those of nitrogen.27 Based on the above discussion, sulfur doping may be a more effective pathway toward ORR than nitrogen doping in carbon materials. The durability of the NG850, SG850 and commercial Pt/C catalyst (E-TEK) was also compared. The catalysts were held at −0.30 V for 20000 s in an O2-saturated 0.1 M KOH solution. As shown in Fig. 5(c), the chronoamperometric response of NG850 (67.9%) and SG850 (70.3%) exhibited slower attenuation than the commercial Pt/C catalyst (E-TEK) (37.2%). These results confirmed that the catalytic stability of doped graphene in electro-oxidation reactions is better than Pt/C.
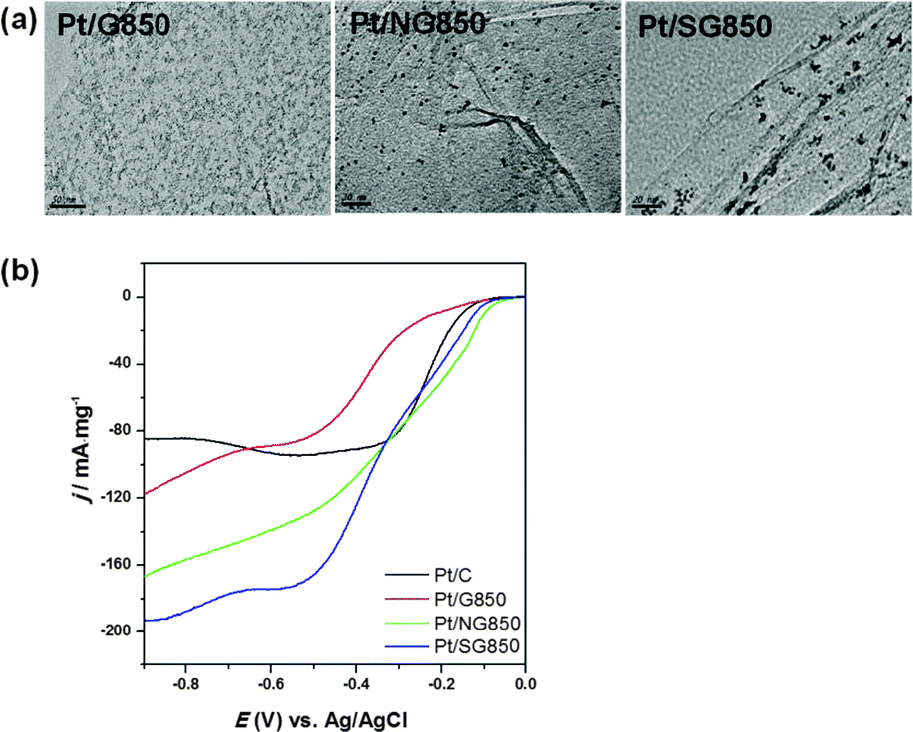 | ||
| Fig. 6 (a) Low-magnification TEM image of graphene composites loaded with Pt NPs that were 2–5 nm in diameter and samples contained 20 wt% Pt, which was the same content as the commercial Pt/C catalyst (E-TEK) electrode. (b) LSV curves for oxygen reduction on the Pt/graphene composite (Pt/G850), Pt/N-graphene composite (Pt/NG850), Pt/S-graphene composite (Pt/SG850), and commercial Pt/C catalyst (20 wt% of Pt loading, E-TEK) in an O2-saturated 0.1 M KOH solution with a rotation rate of 2500 rpm. | ||
Conclusions
We synthesized S-doped graphenes with dominant thiophene-like sulfur by liquid precursor based simple thermal treatment, and demonstrated that the resultant S-graphene can act as an efficient metal-free catalyst for ORR in fuel cells. The catalytic activity of the S-graphene catalyst was found to be dependent on the S content, which dictated the current density and onset potential toward ORR. S-graphene also showed higher electrocatalytic activity with large limiting current density and durability, while N-graphene improved the onset potential. This research suggests that S-graphene provides a new approach for fabricating carbon-based efficient metal-free catalysts for oxygen reduction in fuel cells.Acknowledgements
This work was supported by the National Research Foundation of Korea (NRF) grant funded by the Korean government (MEST) (2011-0014219; 2011-0029409; 2008-0062237; Global PhD Fellowship). We are grateful to Ekaterina D. Grayfer and Prof. Fedorov at Nikolaev Institute of Inorganic Chemistry in Russia for supplying FGIC-derived graphene.Notes and references
- H. Liu, C. Song, L. Zhang, J. Zhang, H. Wang and D. P. Wilkinson, J. Power Sources, 2006, 115, 95–110 CrossRef PubMed.
- J. Larminie and A. Dicks, Fuel Cell Systems, Wiley, New York, 2000 Search PubMed.
- M. K. Jeon, C. H. Lee, G. I. Park and K. H. Kang, J. Power Sources, 2012, 216, 400–408 CrossRef CAS PubMed.
- E. Antolini, J. Power Sources, 2007, 170, 1–12 CrossRef CAS PubMed.
- L. Zhang, L. Wang, C. M. B. Holt, B. Zahiri, Z. Li, K. Malek, T. Navessin, M. H. Eikerling and D. Mitlin, Energy Environ. Sci., 2012, 5, 6156–6172 CAS.
- H. Liu, Y. Liu and D. Zhu, J. Mater. Chem., 2011, 21, 3335–3345 RSC.
- K. Gong, F. Du, Z. Xia, M. Durstock and L. Dai, Science, 2009, 323, 760–764 CrossRef CAS PubMed.
- F. Schedin, A. K. Geim, S. V. Morozov, E. W. Hill, P. Blake, M. I. Katsnelson and K. S. Novoselov, Nat. Mater., 2007, 6, 183–191 CrossRef PubMed.
- K. S. Kim, Y. Zhao, H. Jang, S. Y. Lee, J. M. Kim, K. S. Kim, J.-H. Ahn, P. Kim, J.-Y. Choi and B. H. Hong, Nature, 2009, 457, 706–710 CrossRef CAS PubMed.
- Y. Zhu, S. Murali, W. Cai, X. Li, J. W. Suk, J. R. Potts and R. S. Ruoff, Adv. Mater., 2010, 22, 3906–3924 CrossRef CAS PubMed.
- H. Kim, K. Lee, S. T. I. Woo and Y. Jung, Phys. Chem. Chem. Phys., 2011, 13, 17505–17510 RSC.
- Z. Luo, S. Lim, Z. Tian, J. Shang, L. Lai, B. MacDonald, C. Fu, Z. Shen, T. Yu and J. Lin, J. Mater. Chem., 2011, 21, 8038–8044 RSC.
- L. Lai, J. R. Potts, D. Zhan, L. Wang, C. K. Poh, C. Tang, H. Gong, Z. Shen, J. Lin and R. S. Ruoff, Energy Environ. Sci., 2012, 5, 7936–7942 CAS.
- L. Yang, S. Jiang, Y. Zhao, L. Zhu, S. Chen, X. Wang, Q. Wu, J. Ma, Y. Ma and Z. Hu, Angew. Chem., Int. Ed., 2011, 50, 7132–7135 CrossRef CAS PubMed.
- J. Dai, J. Yuan and P. Giannozzi, Appl. Phys. Lett., 2009, 95, 232105 CrossRef.
- Z.-H. Sheng, H.-L. Gao, W.-J. Bao, F.-B. Wang and X.-H. Xia, J. Mater. Chem., 2012, 22, 390–395 RSC.
- Z. Yang, Z. Yao, G. Li, G. Fang, H. Nie, Z. Liu, X. Zhou, X. Chen and S. Huang, ACS Nano, 2012, 6, 205–211 CrossRef CAS PubMed.
- J. Liang, Y. Jiao, M. Jaroniec and S. Z. Qiao, Angew. Chem., Int. Ed., 2012, 51, 11496–11500 CrossRef CAS PubMed.
- V. G. Makotchenko, E. D. Grayfer, A. S. Nazarov, S.-J. Kim and V. E. Fedorov, Carbon, 2011, 49, 3233–3241 CrossRef CAS PubMed.
- H. K. He and C. Gao, Sci. China: Chem., 2011, 54, 397–404 CrossRef CAS.
- F. Buckel, F. Effenberger, C. Yan, A. Golzhauser and M. Grunze, Adv. Mater., 2000, 12, 901–905 CrossRef CAS.
- J. Noh, E. Ito, K. Nakajima, J. Kim, H. Lee and M. Hara, J. Phys. Chem. B, 2002, 106, 7139–7141 CrossRef CAS.
- A. C. Ferrari, J. C. Meyer, V. Scardaci, C. Casiraghi, M. Lazzeri, F. Mauri, S. Piscanec, D. Jiang, K. S. Novoselov, S. Roth and A. K. Geim, Phys. Rev. Lett., 2006, 97, 187401 CrossRef CAS.
- A. C. Ferrari, Solid State Commun., 2007, 143, 47–57 CrossRef CAS PubMed.
- Z. H. Sheng, L. Tao, J.-J. Chen, W.-J. Bao, F.-B. Wang and X.-H. Xia, ACS Nano, 2011, 5, 4350–4358 CrossRef CAS PubMed.
- L. Qu, Y. Liu, J.-B. Baek and L. Dai, ACS Nano, 2010, 4(3), 1321–1326 CrossRef CAS PubMed.
- S.-A. Wohlgemuth, R. J. White, M.-G. Willinger, M.-M. Titirici and M. Antonietti, Green Chem., 2012, 14, 1515–1523 RSC.
- L.-S. Zhang, X.-Q. Liang, W.-G. Song and Z.-Y. Wu, Phys. Chem. Chem. Phys., 2012, 12, 12055–12059 RSC.
- D. Geng, Y. Hu, Y. Li, R. Li and X. Sun, Electrochem. Commun., 2012, 22, 65–68 CrossRef CAS PubMed.
Footnote |
| † Electronic supplementary information (ESI) available. See DOI: 10.1039/c3cp54311k |
| This journal is © the Owner Societies 2014 |