Ionization-induced π → H site-switching in phenol–CH4 complexes studied using IR dip spectroscopy
Mitsuhiko
Miyazaki
a,
Akihiro
Takeda
a,
Matthias
Schmies
b,
Makoto
Sakai
a,
Kentaro
Misawa
a,
Shun-ichi
Ishiuchi
a,
François
Michels
c,
Klaus
Müller-Dethlefs
c,
Otto
Dopfer
*b and
Masaaki
Fujii
*a
aChemical Resources Laboratory, Tokyo Institute of Technology, 4259 Nagatsuta, Yokohama, 226-8503, Japan. E-mail: mfujii@res.titech.ac.jp
bInstitut für Optik und Atomare Physik, Technische Universität Berlin, Hardenbergstrasse 36, 10623 Berlin, Germany. E-mail: dopfer@physik.tu-berlin.de
cThe Photon Science Institute and School of Chemistry, The University of Manchester, Manchester, M13 9PL, UK
First published on 13th November 2013
Abstract
IR spectra of phenol–CH4 complexes generated in a supersonic expansion were measured before and after photoionization. The IR spectrum before ionization shows the free OH stretching vibration (νOH) and the structure of neutral phenol–CH4 in the electronic ground state (S0) is assigned to a π-bound geometry, in which the CH4 ligand is located above the phenol ring. The IR spectrum after ionization to the cationic ground state (D0) exhibits a red shifted νOH band assigned to a hydrogen-bonded cationic structure, in which the CH4 ligand binds to the phenolic OH group. In contrast to phenol–Ar/Kr, the observed ionization-induced π → H migration has unity yield for CH4. This difference is attributed to intracluster vibrational energy redistribution processes.
1. Introduction
Noncovalent interactions, such as hydrogen bonds (H-bonds) and van der Waals interactions (π-stacking), are responsible for a large number of phenomena in chemistry, biology, and their related research fields.1–3 Advanced quantum chemical calculations have proven that van der Waals interactions, particularly those generated by aromatic rings, are of comparable strength to H-bonds.3 Thus, their competition controls the structure, dynamics, and function of supramolecular systems such as DNA. Phenol (PhOH) and its van der Waals complexes with rare gas (Rg) or simple molecular ligands are benchmark systems to understand the competition between π-stacking and H-bonding, because they are the smallest molecular systems featuring both π-stacking to the aromatic ring and H-bonding to the OH group.4–38The structures of PhOH–Rgn complexes have been studied extensively. In the neutral ground state (S0), analyses of intermolecular vibrations in S1–S0 excitation spectra, high resolution UV spectra, and infrared (IR) dip spectra demonstrated a π-bound structure for PhOH–Rg (Rg = Ar and Kr), in which the Rg ligand binds above the benzene ring by π-stacking interactions, denoted as (10).4,5,7,18,22 The notation (pq) indicates PhOH–Rgn structures in which p and q π-bonded Rg ligands are located above and below the aromatic ring, respectively. For larger PhOH–Arn clusters (n = 2 to 4), IR dip spectra revealed that all of them have π-bound structural motifs in S0, but various isomers can coexist, such as (11) and (20) for n = 2, (21) and (30) for n = 3, and (31) for n = 4.27,30 Recently, high-level quantum chemical calculations indicated that the π-bound PhOH–Ar structure is a global minimum in the neutral ground state, while the H-bound structure was found to be a transition state or at most a shallow local minimum.16,20,21,30 All the isomers can readily be separated by their different S1–S0 electronic transitions, enabling isomer selective excitation and ionization.27,30
Structural studies of PhOH+–Rg cations in their cationic ground state (D0) were performed using photoionization efficiency, mass-analyzed threshold ionization, and zero-kinetic-energy photoelectron spectroscopy.4,8–10,14,23,24,26 These spectroscopic studies suggested a π-bound structure for PhOH+–Rg dimers (Rg = Ar, Kr, and Xe) in the D0 states. Early IR dip spectra also supported a π-bound structure, because almost no shift of the OH stretching vibration (νOH) was observed upon complex formation.7 However, IR photodissociation spectra of PhOH+–Ar/Kr generated in an electron impact (EI) ion source showed that the most stable isomer in the D0 state is in fact the H-bound form.11–13,19 Using photoionization, only the π-bound structure can directly be populated according to the Franck–Condon principle. On the other hand, EI does not have such a restriction and produces the most stable H-bonded structure.32 In this ion source, the first step of the reaction is EI ionization of the phenol monomer, which is followed by three-body aggregation forming the PhOH+–Rg cluster predominantly in its most stable H-bonded structure.13
The structural restriction in photoionization given by the Franck–Condon principle has opened a new research direction in the study of dynamical processes of noncovalent interactions.31 The π-bound structures in PhOH+–Rgn generated by photoionization are a metastable state in D0, and isomerization toward the H-bound global minima is possible. This photoionization induced π → H site switching reaction was observed for PhOH–Kr, the (11) isomer of PhOH–Ar2, and the (30) isomer of PhOH–Ar3 using nanosecond (“static”) and picosecond (time-resolved) UV-UV-IR dip spectroscopy.15,17–19,27–29,31 In nanosecond spectroscopy, the IR dip spectra of PhOH+–Rgn show the H-bonded νOH vibration for the photoionized complexes (in D0), although all of them are assigned to π-bound structures in S0.17,19,27,29 The picosecond time-resolved UV-UV-IR spectra demonstrate the formation and subsequent decay of the free νOH band of the π-bound complexes as a function of the delay time from the ionization event, with timescales of the order of 1–100 picoseconds.15,17,27,28,31 Simultaneously, a gradual growth of the bound νOH band of the H-bonded complex is observed. Thus, picosecond time-resolved IR spectroscopy clearly elucidates the formation of the metastable π-bound cation and its π → H switching reaction in real time.31 This π → H switching reaction is induced by the sudden change of the phenol–ligand interaction upon photoionization. In this respect, PhOH+–Rgn clusters can also serve as a molecular model system to probe solvation dynamics. Similar molecular migration reactions in clusters have recently been observed for water moving around a peptide linkage in the acetanilide–water dimer and for related molecular complexes with polar ligands.32,39–49
In these solvent migration events, the reaction yield is one of the important parameters for understanding their mechanism. For example, the IR spectrum of PhOH+–Kr recorded after photoionization shows both the free and the H-bonded νOH vibrations even for nanosecond delays after ionization.19,28,29 Similar results were observed for PhOH+–Ar.17,27 Thus, it has been concluded that the initially generated π-bound PhOH+–Rg isomer isomerizes towards the H-bound isomer, but the H → π back reaction also takes place, and finally both species coexist in equilibrium. As a result, the π → H switching reaction yield in PhOH+–Rg is less than unity. On the other hand, nanosecond IR spectra of PhOH–Ar2 and PhOH–Ar3 detect only H-bound species long after photoionization, indicating that the π → H reaction yield is unity.15,17,27 This significant difference in the yield can be understood by the presence of a second (and further) Rg ligand(s) in the larger PhOH+–Rgn complexes with n ≥ 2. The second ligand can remain at the original π-binding site after the π → H site switching of the first ligand. Its three intermolecular vibrational modes act as a bath for the switching reaction. As a result, the H-bound reaction product can immediately be stabilized by intracluster vibrational energy redistribution (IVR). IVR prevents the H → π back reaction to the π-bound structure leading to a 100% reaction yield for the π → H forward reaction. As the PhOH–Rg dimers do not have a second ligand, which can prevent the back reaction, the isomerization yield is non-unity.31
However, recent results on water migration from the CO to the NH site in the acetanilide+–water and related dimers show 100% reaction yields although the complex does not have a second ligand,39–41 indicating that a refined explanation for the yield is required. Actually, the H2O ligand has internal structure giving rise to more intermolecular degrees of freedom compared to the Rg complexes. To this end, we investigate here the complex of PhOH, the molecular benchmark for π → H site switching, with a CH4 ligand. Similar to Rg ligands, CH4 interacts with neutral and ionic phenol mainly via its polarizability. Thus, the topologies of the potential energy surfaces of PhOH–CH4 and PhOH–Rg are expected to be similar in both charge states.13 However, CH4 has internal structure and is not spherical like Rg atoms, which can influence the reaction dynamics and the reaction yield. With this motivation, we have measured IR spectra of PhOH–CH4 in S0 and D0. From the IR spectra before and after ionization, we will explore the photoionization-induced π → H site switching reaction and discuss its yield in terms of IVR. The only spectral information available for PhOH–CH4, namely the complexation-induced red shifts in the S1 and ionization energies34 and Raman spectra of PhOH–CH4 in the fingerprint range33 are consistent with a π-bound geometry in S0. In contrast, IR spectra of PhOH+–(CH4)n generated in the EI source prove that the H-bound structure is the global minimum in the cationic D0 state.13 Thus, it was anticipated that π → H isomerization of PhOH+–CH4 could be detected in the current study by photoionization of PhOH–CH4 complexes generated in a molecular beam.
2. Experimental and computational techniques
The setup for IR dip spectroscopy has been described previously.50 PhOH purchased from SIGMA-ALDRICH was used after purification by vacuum sublimation. The sample vapor was diluted at room temperature in a gas mixture of ∼10% CH4 in He at 3 bar. The resulting mixture was expanded into a vacuum chamber (typically 2 × 10⁻⁵ Torr) using a pulsed nozzle to produce PhOH–CH4 clusters in a supersonic jet. The clusters were ionized by two-colour two-photon resonance-enhanced multiphoton ionization (REMPI) using two tuneable UV lasers generating ν1 and ν2. Here, PhOH–CH4 was pumped to the S1 origin by ν1 and subsequently ionized by ν2. Two-colour soft ionization keeps the excess energy after ionization small and prevents dissociation. The produced cluster ions were guided into a quadrupole mass filter and detected by a channel multiplier. The ion signal was digitized by a digital boxcar integrator after amplification and recorded in a personal computer as a function of the laser frequency. The UV photons ν1 and ν2 were generated by frequency-doubled outputs of dye lasers pumped by nanosecond Nd:YAG lasers. Tuneable IR light (νIR) was generated by difference frequency generation in a LiNbO3 crystal between the second harmonic of a Nd:YAG laser and the output of a dye laser. The UV and νIR laser beams were focused on the molecular beam in a coaxial and counter-propagating geometry using lenses with f = 400 mm. The experiment was operated at 10 Hz. IR spectra in S0 were obtained using IR dip spectroscopy. To this end, clusters were first irradiated with νIR, and after a 50 ns delay with ν1 and ν2. While monitoring the ion signal of PhOH+–CH4, νIR was scanned through the OH stretching region. When νIR is resonant with a vibrational level, the population of the vibrational ground state decreases, and the ion signal is reduced (IR dip). Thus, the IR spectrum in S0 was measured as a depletion of the ion signal. The IR spectra in D0 were measured for two different ionization processes, namely photoionization (REMPI) and electron-impact ionization (EI). For the IR spectrum after REMPI (briefly REMPI-IR), the same setup as described above was used. In this case, νIR was introduced 50 ns after ν1 and ν2. Vibrational excitation of PhOH+–CH4 causes vibrational predissociation of the cluster, and the IR spectrum was obtained by monitoring the depletion of the parent mass signal. The IR spectrum of PhOH+–CH4 generated by EI was obtained in a tandem quadrupole mass spectrometer coupled with an electron impact ionization (EI) source and an octopole ion trap, as described elsewhere.13,31,32,51 The EI-IR spectrum exhibits the vibrational transitions of the most stable structure of the cold cation complexes and provides a reference OH stretching frequency (νOH) for the structural assignments in the D0 state.Ab initio quantum chemical calculations were carried out using the Gaussian09 program52 to obtain stable structures, theoretical IR spectra, and binding energies of PhOH+–CH4 (Table 1). Geometry optimization was performed at the MP2/aug-cc-pVDZ level, and normal mode analysis of the stationary points confirmed their nature as minima and was used to predict their IR spectra. Harmonic vibrational frequencies were scaled by factors of 0.9605 and 0.9509 for the neutral and the cationic species, respectively, to reproduce the νOH frequencies of PhOH+ in the respective charge states (3657 and 3534 cm−1).7,37,53 The binding energy of the cluster was estimated from single-point calculations on the minima at the MP2/aug-cc-pVTZ level, including basis set super-position error (BSSE) corrections and harmonic zero-point vibrational energy (ZPE) corrections obtained using the aug-cc-pVDZ basis. As spin contamination at the MP2 level is severe for the PhOH+ cation,30 additional calculations have been performed at the M06-2X/aug-cc-pVTZ level (Table 1). As will be shown below, the intermolecular binding energies obtained at the M06-2X level are systematically larger than those at the MP2 level and match better with the available experimental data.
![[thin space (1/6-em)]](https://www.rsc.org/images/entities/char_2009.gif) obs), calculated (νOHcalc) OH stretching frequencies, IR intensities of νOH, and binding energies of the neutral and ionic PhOH–CH4 cluster
obs), calculated (νOHcalc) OH stretching frequencies, IR intensities of νOH, and binding energies of the neutral and ionic PhOH–CH4 cluster
|
ν
OHobs/cm−1 |
ν
OHcalc
e/cm−1 |
I IR/km mol−1 | D0 (De)f/cm−1 | D0 (De)g/cm−1 | |
|---|---|---|---|---|---|
| a Ref. 60. b Ref. 53 and 63. c From REMPI-IR spectrum, see text. d From EI-IR spectrum (ref. 13). e Calculated at the MP2/aug-cc-pVDZ level and scaled by 0.9605 and 0.9509 for neutral and cationic species, respectively. f Estimated from BSSE-corrected single-point calculations at MP2/aug-cc-pVTZ level on structures optimized at MP2/aug-cc-pVDZ level, at which the harmonic ZPE corrections are evaluated. Binding energies without ZPE corrections are given in parentheses. g Evaluated at the M06-2X/aug-cc-pVTZ level. Binding energies without ZPE corrections are given in parentheses. | |||||
| PhOH | 3657a | 3657 | 64 | — | — |
| PhOH–CH4(π) | 3656 | 3655 | 64 | 354 (650) | 388 (654) |
| PhOH–CH4(OH) | Not observed | 3652 | 190 | 259 (556) | 282 (603) |
| PhOH+ | 3534b | 3534 | 332 | — | — |
| PhOH+–CH4(π) | Not observed | 3534 | 325 | 494 (748) | 647 (944) |
| PhOH+–CH4(OH) | ∼3390c, 3365d | 3423 | 1097 | 1129 (1495) | 1620 (1809) |
3. Results and discussion
To the best of our knowledge, the S1–S0 electronic spectrum of PhOH–CH4 has not been reported except for the frequency of the S1 origin.33,34Fig. 1 shows the S1–S0 REMPI spectrum of PhOH–CH4 obtained in a supersonic jet in the present work. The strongest transition at 36290 cm−1 is red shifted by ΔS1 = −59 cm−1 from the S1 origin of bare PhOH. The band position is slightly lower in energy than those reported previously (3630233 and 36298 cm−1 (ref. 34)), while the shift matches closely (ΔS1 = −58 cm−1). Several low-frequency transitions appearing above the S1 origin are attributed to intermolecular vibrations by comparison to the similar spectra of benzene–CH4,54 toluene–CH4,55 and aniline–CH4.56–59 To measure IR dip spectra in S0, ν1 was fixed to the S1 origin, while ν2 was tuned to 32140 cm−1. Fig. 2 shows the IR dip spectra of (a) PhOH and (b) PhOH–CH4 in S0, respectively. The free νOH band of PhOH at 3657 cm−1 is consistent with the previous report.60 The IR dip spectrum of the PhOH–CH4 complex shows a sharp vibrational transition at 3656 cm−1, which is readily assigned to νOH of PhOH in the complex. Since νOH is essentially unchanged by complex formation with CH4, the complex is concluded to have a π-bound structure, in which CH4 is located above the benzene ring. Similar π-bound structures were found for PhOH–Arn (n = 1 and 2),22 PhOH–Kr,5,7 aniline–Ar,58,61 and 4-aminobenzonitrile–Ar62 in S0. The MP2 and M06-2X calculations support this assignment as they predict the π-bound isomer to be significantly more stable than the H-bound one, D0(π) = 388 cm−1 and D0(OH) = 262 cm−1 at the M06-2X level (Table 1). Moreover, the predicted red shift of ΔνOH = −4 cm−1 for H-bound PhOH–CH4 is not compatible with the measured IR spectrum. The reported Raman spectrum of PhOH–CH4 is also inconsistent with a H-bonded structure in terms of complexation-induced frequency shifts and line widths.33 Finally, the intermolecular structure of the S1–S0 spectrum of PhOH–CH4 is quite similar to that of benzene–CH4 and toluene–CH4,54,55 both of which cannot have H-bound structures. Thus, all spectral and quantum chemical evidence is consistent with a π-bound equilibrium structure of PhOH–CH4 in S0.
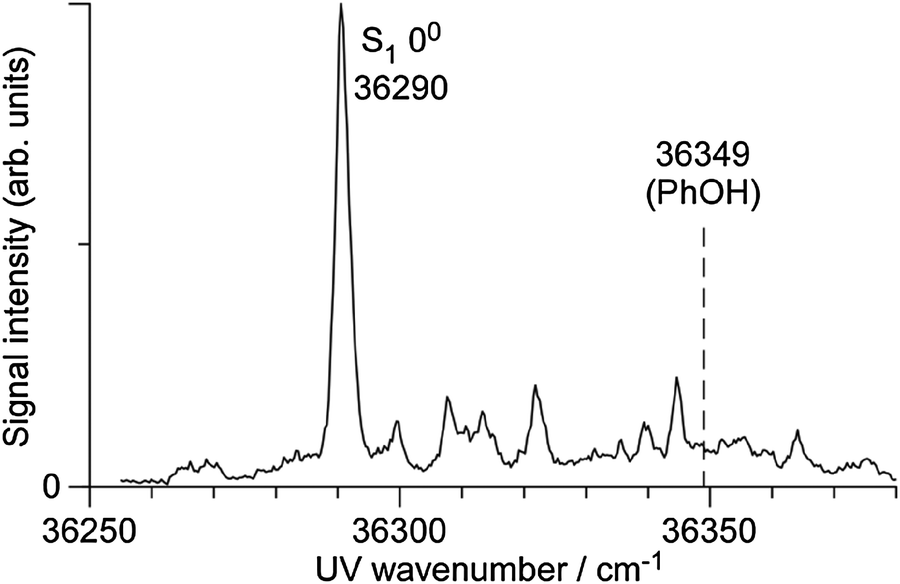 | ||
| Fig. 1 Two-color two-photon REMPI spectrum of the S1–S0 transition of PhOH–CH4. The S1 band origin of PhOH is indicated by a dashed line for comparison. | ||
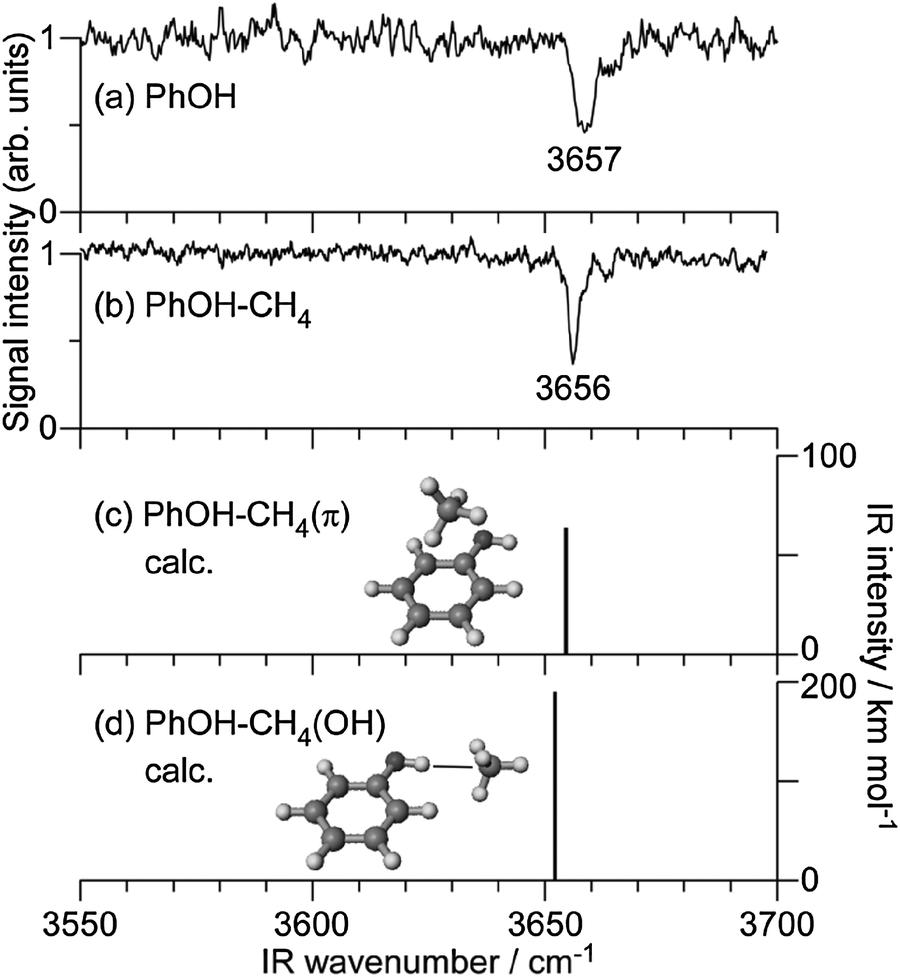 | ||
| Fig. 2 IR dip spectra of PhOH (a) and PhOH–CH4 (b) in the S0 state compared to theoretical spectra of PhOH–CH4(π) (c) and PhOH–CH4(OH) (d) calculated at the MP2/aug-cc-pVDZ level, respectively. The optimized structures are also shown. | ||
Fig. 3(a) shows the REMPI-IR spectrum of PhOH+–CH4 in the νOH region. A broad and intense vibrational transition was observed at ∼3390 cm−1. Significantly, no transition was found in the vicinity of νOH of bare PhOH+ at 3534 cm−1 (ref. 53 and 63) indicated by a dashed line. Thus, we assign the broad band to νOH of the cationic complex. The red shift and broadening of νOH is a clear signature of the formation of a H-bond. In fact, such a large red shift of ΔνOH ∼ −144 cm−1 is only reproducible by the H-bound isomer as shown by the theoretical IR spectra in Fig. 3(c) and (d). Therefore, it is concluded that PhOH+–CH4 generated by photoionization has an H-bonded structure in which CH4 binds to the OH group. The EI-IR spectrum of cold PhOH+–CH4 shown in Fig. 3(b) arises from the global minimum of the cation cluster and confirms this assignment.13 The H-bonded νOH transition is found at 3365 cm−1, which is consistent with the predicted value of 3423 cm−1 (MP2 level). The red shift predicted by the MP2 calculations is somewhat smaller than the experimental one (ΔνOH = −111 and −169 cm−1), as they underestimate the interaction energy. For comparison, the red shift calculated at the M06-2X level (ΔνOH = −136 cm−1) is closer to the experimental value, indicating that this level provides a closer approximation to the true interaction energy. The νOH frequency of cold H-bonded PhOH+–CH4 clusters observed in the EI-IR spectrum corresponds to the red edge of the broad νOH band observed in the REMPI-IR spectrum. This difference is rationalized by the different temperatures of PhOH+–CH4 generated by EI and REMPI. For the EI-IR spectrum, PhOH+–CH4 complexes were generated and cooled directly in the supersonic expansion. In the REMPI process, on the other hand, the complexes were ionized after the cooling process. The complexes are then under collision-free conditions, with the ionization excess energy remaining in the complexes. It is also known that H-bonded νOH bands of hot clusters are blue shifted because H-bonds are weakened by excitation of intramolecular proton donor vibrations.13,31,32 Therefore, the observed spectral feature in the REMPI-IR spectrum of PhOH+–CH4 arises from νOH of “hot” H-bound dimers (vide infra).
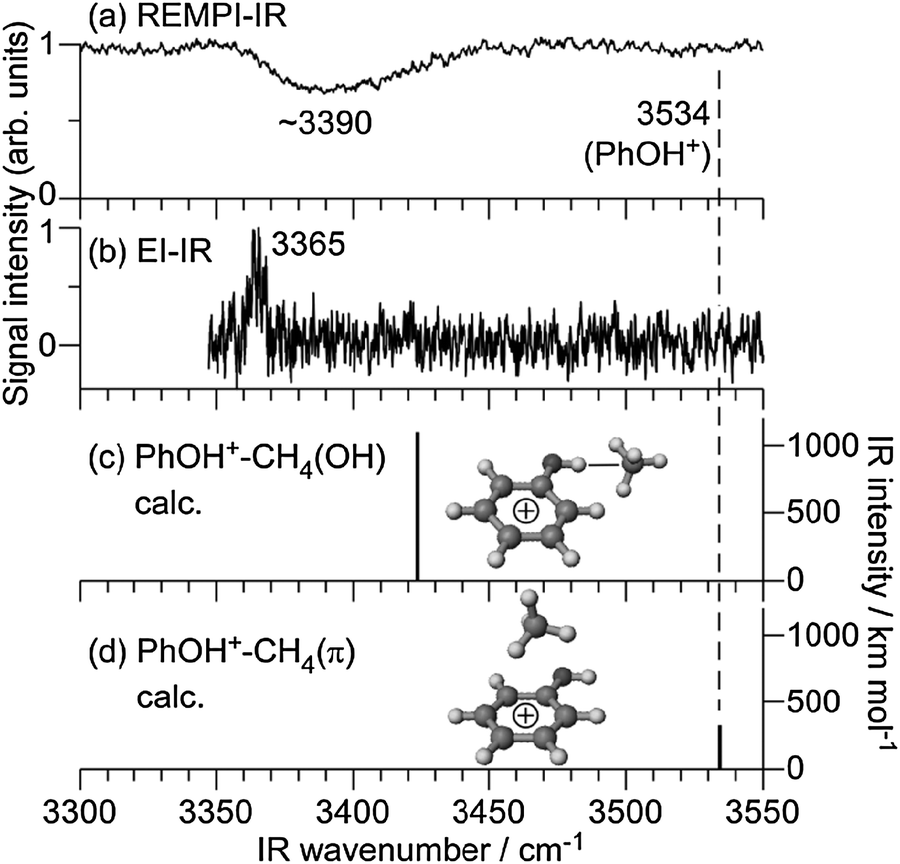 | ||
| Fig. 3 IR spectra of the PhOH+–CH4 cluster cation in the D0 state obtained by REMPI-IR (a) and EI-IR (b) spectroscopy compared to theoretical spectra of PhOH+–CH4(OH) (c) and PhOH+–CH4(π) (d) calculated at MP2/aug-cc-pVDZ level. The optimized structures are also shown. The νOH position of PhOH+ is indicated by a dashed line. | ||
The detection of the H-bound structure after photoionization indicates that CH4 migrates from the aromatic ring to the OH site in the cationic ground state, because the structure in S0 is π-bound and photoionization keeps the same structure due to the Franck–Condon principle. The migration may occur in S1; however, this scenario does not match the spectral features observed in the S1–S0 REMPI spectrum (Fig. 1). In the REMPI spectrum, the S1 origin is the strongest band and low frequency vibrations assigned to intermolecular modes are weak and without prominent progression. In addition, the S1–S0 excitation spectrum is very similar in appearance to that of benzene–CH4,54 which cannot exhibit any type of π → H isomerization. Thus, it is concluded that the structure remains π-bound also in S1, and the CH4 ligand switches the binding motif from π-bonded to H-bonded after photoionization in the D0 state.
Similar to PhOH–Ar2,15,17 the yield of the π → H isomerization reaction is 100% in the PhOH–CH4 dimer. In the (11) isomer of PhOH–Ar2, the two Ar atoms are bound to opposite sides of the benzene ring in S0.22 One of the Ar atoms migrates to the OH group after photoionization yielding the H-bonded structure denoted as (H10).15,17 No vibrational signature of the doubly π-bound (11) structure was found long after ionization, i.e., the reaction yield for the ionization-induced π → H site switching is unity. In contrast, the similar π-bound PhOH–Kr dimer shows both H-bonded and free νOH bands long after photoionization, with a finite equilibrium population between π-bound and H-bound structures.19,28,29 The reaction yield was evaluated as only ∼40%. Interestingly, for the PhOH–CH4 dimer, no free νOH band was found in the REMPI-IR spectrum, and the π → H site switching yield is unity, similar to that in the PhOH–Ar2 trimer. Thus, although both PhOH–Kr and PhOH–CH4 have only a single ligand and both are probed under isolated collision-free conditions in a supersonic jet, the reaction yields are qualitatively different.
For the PhOH–Ar2 trimer, the 100% reaction yield was rationalized by the stabilization of the H-bound (H10) isomer via fast IVR.17 After the π → H site switching reaction, the H-bound complex has significant vibrational excess energy originating from the energy difference between the π-bound and the H-bound structures. In the H-bound (H10) trimer, the spectator Ar atom remains located on the π-ring, and thus its three intermolecular vibrations can act as bath modes and accept vibrational excess energy of the H-bound Ar atom. In this way, the vibrational excess energy in the reaction coordinate decreases significantly and the H → π back reaction is efficiently quenched.
On the other hand, the π ⇌ H equilibrium observed after photoionization of PhOH–Rg (Rg = Ar, Kr) dimers can be explained by the lack of bath modes. All three intermolecular modes in PhOH+–Rg originating from the three translational degrees of freedom of the single Rg atom are required to describe the reaction coordinate for Rg isomerization. Just after the π → H site switching, the isomerization excess energy is localized in the reaction coordinate. However, no low frequency bath modes in the complex are available to accept the excess energy because all three intermolecular vibrational modes are already involved in the reaction coordinate and cannot act as bath modes for IVR. Therefore, the H → π back reaction can take place in accordance with the classical description, and finally the π ⇌ H equilibrium is achieved.
Similar to PhOH–Rg, the PhOH–CH4 dimer has a single spherical top ligand. The CH4 ligand, however, is not a sphere like a Rg atom but has internal structure and three rotational degrees of freedom. The PhOH–CH4 dimer has six intermolecular modes, three originating from translations and three from rotations. Analogous to the Rg case, the reaction coordinate for the CH4 site switching requires all three translational motions. As the coupling of the rotation-derived modes with the isomerization coordinate is weak, at least one of them can act as the bath mode for IVR. Those modes can accept the excess energy after the isomerization, stabilize the “hot” nascent H-bound complex by IVR and thus prevent the H → π back reaction. Therefore, the 100% reaction yield can be explained by fast IVR, mainly by coupling of the isomerization coordinates to the intermolecular vibrations related to the internal rotation of CH4.
Fig. 4 summarizes the reaction mechanism of the photoionization-induced π → H site switching reaction in PhOH+–CH4 in a potential energy diagram. In the following, we combine the available experimental information with the data from the M06-2X calculations (Table 1) to derive a consistent quantitative picture of the energetics of this reaction potential because of the importance of energetics in the reaction.64 The binding energy of H-bound PhOH+–CH4 predicted by the M06-X level (D0 = 1620 cm−1) is quite similar to that of the related H-bound PhOH+–N2 complex precisely measured as 1640 ± 10 cm−1 by mass-analyzed threshold ionization spectroscopy.35,38 This similarity is expected, because both complexes exhibit the same complexation-induced red shifts ΔνOH = −169 cm−1.13 Moreover, similar H-bond energies for CH4 and N2 ligands are due to their similar proton affinities.13,32,36 Clearly, the binding energy derived for H-bound PhOH+–CH4 at the MP2 level (D0 = 1129 cm−1) is too low and not consistent with the magnitude of the measured ΔνOH shift. Similarly, the binding energy predicted for the π-bonded PhOH+–CH4 isomer at the M06-2X level, (D0 = 647 cm−1) is more realistic than that at the MP2 level (D0 = 494 cm−1) by comparison to experimental dissociation energies estimated from photodissociation data of CH4-containing complexes of aromatic ions.65,66 On the basis of the M06-2X calculations, the gain in internal energy upon π → H isomerization is of the order of 1000 cm−1. Additionally, the initially prepared π-bound complex may already contain some amount of internal energy, which depends on the Franck–Condon factors for photoionization from the S1 origin and the ionization excess energy. The difference between the two-photon energy used for two-color soft ionization (ν1 + ν2 = 36290 + 32140 = 68430 cm−1) and the adiabatic ionization energy of π-bound PhOH+–CH4 (IE = 68334 cm−1)34,67 indicates that the maximum internal energy available upon photoionization is around 100 cm−1. As a result, the barrier for π → H isomerization in the D0 state of PhOH+–CH4 must be relatively small. Moreover, the total internal energy of the H-bound PhOH+–CH4 product after ionization is estimated as ∼1050 ± 100 cm−1. Finally, we note that both the adiabatic IE and its complexation-induced red shift measured for π-bound PhOH+–CH4 (IE = 68334 and ΔIE = −294 cm−1),34,67 are in good agreement with the predictions of the M06-2X calculations (IE = 68064 and ΔIE = −365 cm−1), confirming that this theoretical level indeed makes reliable predictions for the interaction between PhOH+ and CH4 in both charge states. In fact, ΔIE corresponds to the difference of the binding energies of π-bound PhOH+–CH4 in the S0 and D0 states.
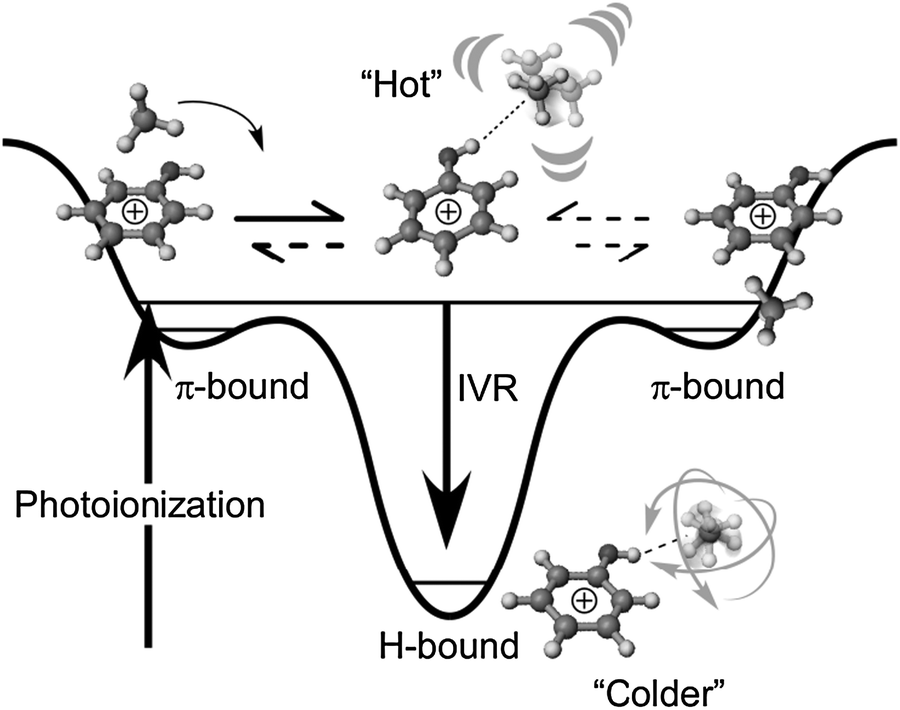 | ||
| Fig. 4 Schematic potential energy curve of PhOH+–CH4 along the reaction coordinate. The initial π-bound structure reacts to a “Hot” H-bound cluster, in which the excess energy remains as vibrational excitation. The “Hot” H-bound cluster may go back to the π-bound structure using this energy. Eventually, the excess energy flows to bath modes due to IVR. The rotation-derived intermolecular modes of the CH4 ligand can act as bath modes to suppress the back reaction. | ||
4. Conclusions
In summary, IR spectra of the PhOH+–CH4 dimer in the S0 and D0 states were recorded in the νOH range using IR dip spectroscopy. While the neutral dimer has a π-bound structure in S0, the cation dimer has a H-bound structure in D0. From the Franck–Condon principle for photoionization, one can conclude that the CH4 ligand switches its binding motif from π-bonding above the aromatic ring to H-bonding at the OH site. The 100% reaction yield observed for this prototypical π → H site switching triggered by ionization is explained by rapid IVR of the H-bound structure mainly due to the intermolecular energy transfer from the reaction coordinate to intermolecular modes originating from internal rotational degrees of freedom of CH4. Following aromatic complexes with atomic and nonpolar Rg ligands, and those with polar H2O and CH3OH ligands, PhOH+–CH4 is the first CH4-containing complex for which the ionization-induced site-switching of the preferred binding motif is observed. Typical time scales for such site switching reactions are of the order of 1–100 ps.15,17,40 Future efforts will be aimed at the time-resolved investigation of this prototypical intermolecular isomerization reaction.15,17,27,31,40Acknowledgements
This work was supported in part by the Core-to-Core Program 22003 from the Japan Society for the Promotion of Science (JSPS), KAKENHI on Innovative Area (2503) “Studying the Function of Soft Molecular Systems by the Concerted Use of Theory and Experiment”, the Cooperative Research Program of “Network Joint Research Center for Materials and Devices”, from the Ministry of Education, Culture, Sports, Science and Technology (MEXT), Japan, and the Deutsche Forschungsgemeinschaft (DFG, DO 729/4). F.M. was supported by the Fonds National de la Recherche, Luxembourg (AFR/1357660).References
- P. Hobza and K. Müller-Dethlefs, Non-covalent interactions, The Royal Society of Chemistry, Cambridge, 2010 Search PubMed.
- E. A. Meyer, R. K. Castellano and F. Diederich, Angew. Chem., Int. Ed., 2003, 42, 1210–1250 CrossRef CAS PubMed.
- P. Jurečka and P. Hobza, J. Am. Chem. Soc., 2003, 125, 15608–15613 CrossRef PubMed.
- N. Gonohe, H. Abe, N. Mikami and M. Ito, J. Phys. Chem., 1985, 89, 3642–3648 CrossRef CAS.
- M. Mons, J. L. Calvé, F. Piuzzi and I. Dimicoli, J. Chem. Phys., 1990, 92, 2155–2165 CrossRef CAS.
- O. Dopfer, G. Reiser, K. Müller-Dethlefs, E. W. Schlag and S. D. Colson, J. Chem. Phys., 1994, 101, 974–989 CrossRef CAS.
- A. Fujii, T. Sawamura, S. Tanabe, T. Ebata and N. Mikami, Chem. Phys. Lett., 1994, 225, 104–107 CrossRef CAS.
- O. Dopfer, M. Melf and K. Müller-Dethlefs, Chem. Phys., 1996, 207, 437–449 CrossRef CAS.
- C. E. H. Dessent, S. R. Haines and K. Müller-Dethlefs, Chem. Phys. Lett., 1999, 315, 103–108 CrossRef CAS.
- S. R. Haines, C. E. H. Desent and K. Müller-Dethlefs, J. Electron Spectrosc. Relat. Phenom., 2000, 108, 1–11 CrossRef CAS.
- N. Solcà and O. Dopfer, Chem. Phys. Lett., 2000, 325, 354–359 CrossRef.
- N. Solcà and O. Dopfer, J. Mol. Struct., 2001, 563/564, 241–244 CrossRef.
- N. Solcà and O. Dopfer, J. Phys. Chem. A, 2001, 105, 5637–5645 CrossRef.
- S. Ullrich, G. Tarczay and K. Müller-Dethlefs, J. Phys. Chem. A, 2002, 106, 1496–1503 CrossRef CAS.
- S. Ishiuchi, M. Sakai, Y. Tsuchida, A. Takeda, Y. Kawashima, M. Fujii, O. Dopfer and K. Müller-Dethlefs, Angew. Chem., Int. Ed., 2005, 44, 6149–6151 CrossRef CAS PubMed.
- J. Makarewicz, J. Chem. Phys., 2006, 124, 084310 CrossRef PubMed.
- S. Ishiuchi, M. Sakai, Y. Tsuchida, A. Takeda, Y. Kawashima, O. Dopfer, K. Müller-Dethlefs and M. Fujii, J. Chem. Phys., 2007, 127, 114307 CrossRef PubMed.
- S. Ishiuchi, Y. Tsuchida, O. Dopfer, K. Müller-Dethlefs and M. Fujii, J. Phys. Chem. A, 2007, 111, 7569–7575 CrossRef CAS PubMed.
- A. Takeda, H.-S. Andrei, M. Miyazaki, S. Ishiuchi, M. Sakai, M. Fujii and O. Dopfer, Chem. Phys. Lett., 2007, 443, 227–231 CrossRef CAS PubMed.
- J. Černý, X. Tong, P. Hobza and K. Müller-Dethlefs, Phys. Chem. Chem. Phys., 2008, 10, 2780–2784 RSC.
- J. Černý, X. Tong, P. Hobza and K. Müller-Dethlefs, J. Chem. Phys., 2008, 128, 114319 CrossRef PubMed.
- I. Kalkman, C. Brand, T.-B. C. Vu, W. L. Meerts, Y. N. Svartsov, O. Dopfer, K. Müller-Dethlefs, S. Grimme and M. Schmitt, J. Chem. Phys., 2009, 130, 224303 CrossRef PubMed.
- A. Armentano, M. Riese, M. Taherkahani, M. B. Yezzar, K. Müller-Dethlefs, M. Fujii and O. Dopfer, J. Phys. Chem. A, 2010, 114, 11139–11143 CrossRef CAS PubMed.
- X. Tong, A. Armentano, M. Riese, M. B. Yezzar, S. M. Pimblott, K. Müller-Dethlefs, S. Ishiuchi, M. Sakai, A. Takeda, M. Fujii and O. Dopfer, J. Chem. Phys., 2010, 133, 154308 CrossRef PubMed.
- C. Walter, R. Kritzer, A. Schubert, C. Meier, O. Dopfer and V. Engel, J. Phys. Chem. A, 2010, 114, 9743–9748 CrossRef CAS PubMed.
- A. Armentano, X. Tong, M. Riese, S. M. Pimblott, K. Müller-Dethlefs, M. Fujii and O. Dopfer, Phys. Chem. Chem. Phys., 2011, 13, 6071–6076 RSC.
- S. Ishiuchi, M. Miyazaki, M. Sakai, M. Fujii, M. Schmies and O. Dopfer, Phys. Chem. Chem. Phys., 2011, 13, 2409–2416 RSC.
- M. Miyazaki, A. Takeda, S. Ishiuchi, M. Sakai, O. Dopfer and M. Fujii, Phys. Chem. Chem. Phys., 2011, 13, 2744–2747 RSC.
- M. Miyazaki, S. Tanaka, S. Ishiuchi, O. Dopfer and M. Fujii, Chem. Phys. Lett., 2011, 513, 208–211 CrossRef CAS PubMed.
- M. Schmies, A. Patzer, M. Fujii and O. Dopfer, Phys. Chem. Chem. Phys., 2011, 13, 13926–13941 RSC.
- M. Fujii and O. Dopfer, Int. Rev. Phys. Chem., 2012, 31, 131–173 CrossRef CAS.
- O. Dopfer, Z. Phys. Chem., 2005, 219, 125–168 CrossRef CAS.
- G. V. Hartland, B. F. Henson, V. A. Venturo and P. M. Felker, J. Phys. Chem., 1992, 96, 1164–1173 CrossRef CAS.
- X. Zhang and J. L. Knee, Faraday Discuss., 1994, 97, 299–313 RSC.
- D. M. Chapman, K. Müller-Dethlefs and J. B. Peel, J. Chem. Phys., 1999, 111, 1955–1963 CrossRef CAS.
- A. Patzer, H. Knorke, J. Langer and O. Dopfer, Chem. Phys. Lett., 2008, 457, 298–302 CrossRef CAS PubMed.
- A. Fujii, M. Miyazaki, T. Ebata and N. Mikami, J. Chem. Phys., 1999, 110, 11125–11128 CrossRef CAS.
- S. R. Haines, W. D. Geppert, D. M. Chapman, M. J. Watkins, C. E. H. Dessent, M. C. R. Cockett and K. Müller-Dethlefs, J. Chem. Phys., 1998, 109, 9244–9251 CrossRef CAS.
- M. Weiler, T. Nakamura, H. Sekiya, O. Dopfer, M. Miyazaki and M. Fujii, ChemPhysChem, 2012, 13, 3875–3881 CrossRef CAS PubMed.
- K. Tanabe, M. Miyazaki, M. Schmies, A. Patzer, M. Schütz, H. Sekiya, M. Sakai, O. Dopfer and M. Fujii, Angew. Chem., Int. Ed., 2012, 51, 6604–6607 CrossRef PubMed.
- K. Sakota, S. Harada, Y. Shimazaki and H. Sekiya, J. Phys. Chem. A, 2011, 115, 626–630 CrossRef CAS PubMed.
- K. Sakota, Y. Shimazaki and H. Sekiya, Phys. Chem. Chem. Phys., 2011, 13, 6411–6415 RSC.
- T. Ikeda, K. Sakota, Y. Kawashima, Y. Shimazaki and H. Sekiya, J. Phys. Chem. A, 2012, 116, 3816–3823 CrossRef CAS PubMed.
- K. Sakota, Y. Kouno, S. Harada, M. Miyazaki, M. Fujii and H. Sekiya, J. Chem. Phys., 2012, 137, 224311 CrossRef PubMed.
- M. Gerhards, A. Jansen, C. Unterberg and A. Gerlach, J. Chem. Phys., 2005, 123, 074321 CrossRef PubMed.
- H. M. Kim, K. Y. Han, J. Park, G. S. Kim and S. K. Kim, J. Chem. Phys., 2008, 128, 041104 CrossRef PubMed.
- N. Solcà and O. Dopfer, Chem. Phys. Lett., 2001, 347, 59–64 CrossRef.
- M. Miyazaki, A. Fujii, T. Ebata and N. Mikami, Chem. Phys. Lett., 2001, 349, 431–436 CrossRef CAS.
- T. Nakamura, M. Schmies, A. Patzer, M. Miyazaki, S. Ishiuchi, M. Weiler, O. Dopfer and M. Fujii, Chem. Eur. J. DOI:10.1002/chem.201303321.
- T. Omi, H. Shitomi, N. Sekiya, K. Takazawa and M. Fujii, Chem. Phys. Lett., 1996, 252, 287–293 CrossRef CAS.
- O. Dopfer, Int. Rev. Phys. Chem., 2003, 22, 437–495 CrossRef CAS.
- M. J. Frisch, G. W. Trucks, H. B. Schlegel, G. E. Scuseria, M. A. Robb, J. R. Cheeseman, G. Scalmani, V. Barone, B. Mennucci, G. A. Petersson, H. Nakatsuji, M. Caricato, X. Li, H. P. Hratchian, A. F. Izmaylov, J. Bloino, G. Zheng, J. L. Sonnenberg, M. Hada, M. Ehara, K. Toyota, R. Fukuda, J. Hasegawa, M. Ishida, T. Nakajima, Y. Honda, O. Kitao, H. Nakai, T. Vreven, J. J. A. Montgomery, J. E. Peralta, F. Ogliaro, M. Bearpark, J. J. Heyd, E. Brothers, K. N. Kudin, V. N. Staroverov, R. Kobayashi, J. Normand, K. Raghavachari, A. Rendell, J. C. Burant, S. S. Iyengar, J. Tomasi, M. Cossi, N. Rega, J. M. Millam, M. Klene, J. E. Knox, J. B. Cross, V. Bakken, C. Adamo, J. Jaramillo, R. Gomperts, R. E. Stratmann, O. Yazyev, A. J. Austin, R. Cammi, C. Pomelli, J. W. Ochterski, R. L. Martin, K. Morokuma, V. G. Zakrzewski, G. A. Voth, P. Salvador, J. J. Dannenberg, S. Dapprich, A. D. Daniels, O. Farkas, J. B. Foresman, J. V. Ortiz, J. Cioslowski and D. J. Fox, Gaussian 09, Revision A.02, Gaussian, Inc., Wallingford, CT, 2009 Search PubMed.
- E. Fujimaki, A. Fujii, T. Ebata and N. Mikami, J. Chem. Phys., 1999, 110, 4238–4247 CrossRef CAS.
- M. Schauer and E. R. Bernstein, J. Chem. Phys., 1985, 82, 726–735 CrossRef CAS.
- M. Schauer, K. S. Law and E. R. Bernstein, J. Chem. Phys., 1985, 82, 736–746 CrossRef CAS.
- E. R. Bernstein, K. Law and M. Schauer, J. Chem. Phys., 1984, 80, 634–644 CrossRef CAS.
- K. Yamanouchi, S. Isogai and S. Tsuchiya, J. Mol. Struct., 1986, 146, 349–359 CrossRef CAS.
- K. Yamanouchi, S. Isogai, S. Tsuchiya and K. Kuchitsu, Chem. Phys., 1987, 116, 123–132 CrossRef CAS.
- J. M. Smith, X. Zhang and J. L. Knee, J. Chem. Phys., 1993, 99, 2550–2559 CrossRef CAS.
- T. Watanabe, T. Ebata, S. Tanabe and N. Mikami, J. Chem. Phys., 1996, 105, 408–419 CrossRef.
- P. Hermine, P. Parneix, B. Coutant, F. G. Amar and P. Bréchignac, Z. Phys. D: At., Mol. Clusters, 1992, 22, 529–539 CrossRef CAS.
- T. Nakamura, M. Miyazaki, S. Ishiuchi, M. Weiler, M. Schmies, O. Dopfer and M. Fujii, ChemPhysChem, 2013, 14, 741–745 CrossRef CAS PubMed.
- A. Fujii, A. Iwasaki, T. Ebata and N. Mikami, J. Phys. Chem. A, 1997, 101, 5963–5965 CrossRef CAS.
- A. Mahjoub, A. Chakraborty, V. Lepere, K. Le Barbu-Debus, N. Guchhait and A. Zehnacker, Phys. Chem. Chem. Phys., 2009, 11, 5160–5169 RSC.
- O. Dopfer, R. V. Olkhov and J. P. Maier, J. Chem. Phys., 1999, 111, 10754–10757 CrossRef CAS.
- N. Solcà and O. Dopfer, Chem.–Eur. J., 2003, 9, 3154–3163 CrossRef.
- O. Dopfer, G. Reiser, K. Müller-Dethlefs, E. W. Schlag and S. D. Colson, J. Chem. Phys., 1994, 101, 974–989 CrossRef CAS.
| This journal is © the Owner Societies 2014 |