 Open Access Article
Substrate steered crystallization of naphthyl end-capped oligothiophenes into nanofibers: the influence of methoxy-functionalization†
Frank
Balzer
*a,
Manuela
Schiek‡
b,
Andreas
Osadnik
b,
Ivonne
Wallmann
b,
Jürgen
Parisi
c,
Horst-Günter
Rubahn
a and
Arne
Lützen
b
aNanoSyd, Mads Clausen Institute, University of Southern Denmark, DK-6400 Sønderborg, Denmark. E-mail: fbalzer@mci.sdu.dk
bKekulé-Institute for Organic Chemistry and Biochemistry, University of Bonn, Gerhard-Domagk-Str. 1, D-53121 Bonn, Germany
cEnergy and Semiconductor Research Laboratory, Institute of Physics, University of Oldenburg, D-26111 Oldenburg, Germany
First published on 28th January 2014
Abstract
Naphthyl end-capped oligothiophenes are a class of materials well suited for high-performance organics based devices. The formation of nanofibers on muscovite mica from 2,5-bis(naphth-2-yl)thiophene (NaT), 5,5′-bis(naphth-2-yl)-2,2′-bithiophene (NaT2), and 5,5′′-bis(naphth-2-yl)-2,2′:5′,2′′-terthiophene (NaT3) as well as of the methoxy-functionalized variants MONaT, MONaT2, and MONaT3 is investigated via atomic force microscopy, X-ray diffraction, polarized fluorescence microscopy, and fluorescence spectroscopy. From polarized fluorescence microscopy spatially resolved molecular orientations are deduced revealing a profound anisotropy. Fibers from lying molecules grow along distinct substrate directions. Methoxy-functionalization substantially increases the crystallization into aligned fibers. In air Ostwald ripening is observed. The morphological variations of the aggregates result in specific optical signatures, disclosed by temperature dependent and spatially resolved fluorescence spectra.
1 Introduction
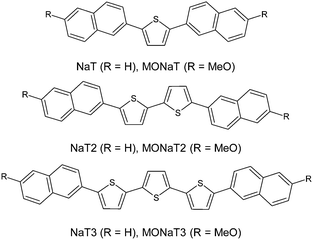
Small molecule organic semiconductors have vast application potential as the active ingredients in (opto-) electronic devices.1–7 Their self-organization into nanofibers adds a peculiar attribute, making nanoscopic waveguides and lasers straightforward to achieve.8–12 Extending the π-electron system by increasing the molecules' length together with functionalization is used to tune their properties13 leading to, e.g., effective frequency-doubling nanoaggregates.14,15 Since device performance critically depends on morphology and on optical and electronic properties of the constituents,16–21 the occurrence of different phases together with environmental stability is of major interest for any application.22Naphthyl end-capped oligothiophenes are well suited for high-performance devices.23–25 End-capping has the potential to hinder polymerization, thus eventually improving charge-carrier transport and device stability.26,27 Substitution of the molecular terminals with electron donating or withdrawing groups allows formation of p- and n-type semiconductors.7 Functionalization might also improve nanofiber formation as demonstrated for para-quaterphenylene.28 In the past muscovite mica has often been chosen as the substrate since the basal (001) surface is anisotropic and charged.29,30 Here the vacuum growth of six such molecules on muscovite is investigated to test the hypothesis that methoxy functionalization improves fiber growth: 2,5-bis(naphth-2-yl)thiophene (NaT), 5,5′-bis(naphth-2-yl)-2,2′-bithiophene (NaT2), and 5,5′′-bis(naphth-2-yl)-2,2′:5′,2′′-terthiophene (NaT3), and the methoxy-functionalized variants 2,5-bis(6-methoxynaphth-2-yl)thiophene (MONaT), 5,5-bis(6-methoxynaphth-2-yl)-2,2′-bithiophene (MONaT2), and 5,5′′-bis-(6-methoxynaphth-2-yl)-2:2′,5′:2′′-terthiophene (MONaT3). The molecules are sketched in Fig. 1.
2 Experimental
2.1 Synthesis
Tian et al. reported the synthesis of NaT2 and NaT3 by a Stille cross-coupling approach.23 Since we recently were able to employ Suzuki cross-coupling protocols for NaT, MONaT, NaT2 and MONaT2 thereby avoiding toxic organotin compounds,31,32 we used this strategy for NaT3 and MONaT3, too; Scheme S3 (ESI†) depicts the synthesis. Solvents were dried, distilled, and stored under argon according to standard procedures. 2-Naphthylboronic acid and 5,5′′-dibromo-2,2′:5′,2′′-terthiophene were purchased from commercial sources and used as received. Reactions were performed under an argon atmosphere in oven-dried glassware using standard Schlenk techniques. Products were purified by sublimation under high vacuum. Mass spectra were recorded on a Finnigan MAT-95XL. UV/Vis spectra were measured on a Jena Analytic Specord 200 spectrometer in a 1 cm quartz cuvette. Elemental analyses were carried out using a Heraeus Vario EL.For the synthesis of NaT3/MONaT3 a two-neck flask equipped with a condenser was charged with 5,5′′-dibromo-2,2′:5′,2′′-terthiophene (200 mg, 0.49 mmol), 2-naphthylboronic acid (1.03 mmol), CsF (225 mg, 1.48 mmol) and [Pd(PPh3)4] (29 mg, 0.025 mmol). THF (50 mL) was added and the reaction mixture was refluxed for 50 h. After allowing to cool to room temperature the precipitate was collected and washed with CH2Cl2 and H2O (2 × 50 mL each). The crude product was sublimed in high-vacuum to give the desired compound.
Treatment of the terthiophene with 2-naphthylboronic acid (178 mg, 1.03 mmol) gave NaT3 after sublimation in high-vacuum (1.7 × 10⁻⁶ mbar, sand bath temperature 290–313 °C). Yield: 210 mg (86%). UV/Vis (CH2Cl2): λmax = 415 nm, fluorescence (CH2Cl2): λmax = 475 nm; EI-MS (m/z (%)): 500.1 (100) [M]+, 250.1 (20), [M]2+; HRMS (EI, m/z): [M]+ calc. for C32H20S3: 500.0727; found: 500.0729; anal. calc. for C32H20S3: C: 76.76; H: 4.03; S: 19.21; found: C: 76.72; H: 4.10; S: 18.99.
Treatment of the terthiophene with 6-methoxynaphth-2-ylboronic acid (210 mg, 1.03 mmol) gave MONaT3 after sublimation in high-vacuum (4.2 × 10⁻⁷ mbar, sand bath temperature 282–350 °C). Yield: 264 mg (96%). UV/Vis (CH2Cl2): λmax = 391 nm, fluorescence (CH2Cl2): λmax = 488 nm; EI-MS (m/z (%)): 560.1 (100) [M]+, HRMS (EI, m/z): [M]+ calc. for C34H24O2S3: 560.0938; found: 560.0936.
2.2 Sample preparation
Muscovite mica sheets (grade V-4, Structure Probe, Inc.) are cleaved in air, mounted onto a sample holder, and transferred into a vacuum chamber (base pressure 1 × 10⁻⁸ mbar) within a few seconds. After heating (sample holder temperature Tsub = 435 K) to desorb contaminants a LEED pattern is observed, distorted by the surface electric fields.29 The molecules are deposited by thermal sublimation from a Knudsen cell. During deposition the pressure rises to approximately 3 × 10⁻⁷ mbar. Both the nominal film thickness d as well as the deposition rate (0.2–0.4 Å s−1) are monitored using a quartz microbalance (Inficon XTC/2). The substrate can be heated by a filament placed underneath. Note that all temperatures stated are sample holder temperatures.2.3 Sample characterization
All characterization is performed under ambient conditions, except the low temperature fluorescence spectroscopy, which is done in high vacuum. After deposition the samples are investigated by atomic force microscopy (AFM, JPK Nanowizard) in intermittent contact mode. To determine contact planes X-ray diffraction is performed using a PANalytical X'PertPro MPD diffractometer operating in Bragg–Brentano geometry and using Cu-Kα radiation (λ = 1.542 Å). The nanofibers are transferred to a cover glass slip to suppress distracting mica diffraction peaks,33,34 which is then mounted on a sample spinner to eliminate preferred orientation effects. Fluorescence microscope images are obtained using a Nikon Eclipse ME-600 epifluorescence microscope equipped with a high-pressure Hg-lamp (excitation wavelength λexc ≈ 365 nm). For the analysis of the polarization of the emitted fluorescence the samples are mounted on a computer controlled rotational stage (Thorlabs PRM1Z8) attached to the microscope table, and the fluorescence is observed using a camera (PixeLINK PL-B873-CU) through a sheet polarizer with its transmission axis along the east-west direction35 to minimize depolarization artifacts from the setup. The sample is rotated in steps of Δϕ = 5° over 360° and images are taken. By image processing36,37 the rotation of the sample is revoked and image drifts are corrected. From the intensity variation of each pixel at position (x,y), i.e. from Ix,yn with n = 0,1… (N = 73) – 1 the second discrete Fourier coefficient Ĩγ=2(x,y) is calculated via38The polarization angle
Fluorescence spectra are taken after excitation either with a cw HeCd laser (Kimmon Koha Co., excitation wavelength 325 nm, spot size 1.5 mm, irradiance 30 mW cm−2) by an Acton Research SpectraPro-150 Spectrograph and a cooled CCD camera (Pixis 100, Princeton Instruments), or after excitation with a high-pressure Hg-lamp by a CCD spectrometer (Ocean Optics Maja) coupled via an optical fiber (core diameter 200 μm) to the camera port of an inverted microscope (Nikon Eclipse TE-300). For the laser based measurements samples are cooled in a He cryostat (Sumitomo SHI-4) from room temperature down to 8 K.
3 Results and discussion
3.1 Morphology and growth
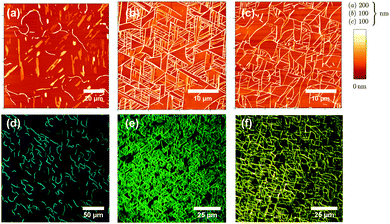
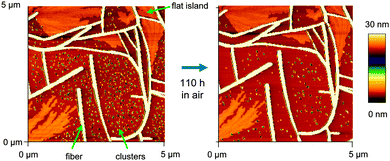
Atomic force microscope (AFM) images together with fluorescence microscope images of the molecules deposited on muscovite are shown in Fig. 2 and 3. Deposition temperatures have been chosen so that the formation of nanofibers (heights of several ten to a few hundred nm) is observed. For the case of NaT2 and for all methoxy-functionalized variants well-defined growth directions are found. To various extents nanoclusters (heights of several ten nm, diameters below 500 nm) and flat islands (height several nm, diameter up to several ten μm and monomolecular step heights) are also formed; they are denoted in Fig. 5. Both, fibers and clusters fluoresce strongly after normal incidence UV excitation, while the flat islands appear at least an order of magnitude darker, see the inset in Fig. S1(b) (ESI†). From this it is concluded that the fibers and clusters are composed of “lying” molecules with their long axis including a small angle with the surface, whereas the flat islands are made from upright standing molecules.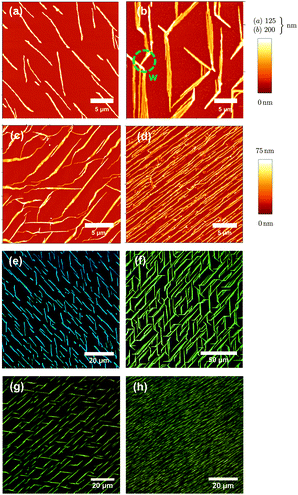 | ||
| Fig. 3 Same as Fig. 2 but for MONaT, (a, e), MONaT2, (b, f), and MONaT3, (c, d, g, h), deposited at Tsub = 377 K (a, e), 415 K (b, c, f, g), and 360 K (d, h). Nominal thicknesses are d = 9 nm for MONaT, and 18 nm for MONaT2 and MONaT3, respectively; “w” marks a winglet. | ||
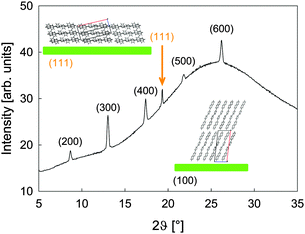 | ||
| Fig. 4 The XRD pattern of a 150 nm thick NaT2 film transferred onto glass. Sketches of lying and upright molecules together with their bulk unit cell are shown as insets. | ||
To quantify this, X-ray diffraction (XRD) measurements have been performed exemplarily for a 150 nm thick NaT2 film. In Fig. 4 the pattern is indexed according to the bulk crystal structure.23 The (k00) peaks stem from upright molecules in the flat islands, the peak at 2ϑ = 19.3° stems from lying molecules with their (111) plane parallel to the substrate. No obvious substrate induced phases are observed as, e.g., for p-6P on SiO2.39
The obtained morphology sensitively depends on the nominal film thickness d and on sample temperature Tsub during deposition. The thickness dependence for NaT3 is shown in Fig. S1 in the ESI.† First only clusters are observed, whereas for values of d ≳ 1 nm fibers and flat islands are found. The flat islands increasingly fill out the areas in between the fibers and consume the clusters. Fibers get longer and more isolated with increasing Tsub up to a certain maximal temperature, where no adsorption is observed anymore. For lower Tsub flat islands together with a dense fiber network are observed. Such a behavior has been observed numerous times12,40,41 and seems to be generic for fiber growth on muscovite. As a general trend for the non-methoxy-functionalized molecules it is found that the longer the molecule, the more fibers grow, but the less flat islands form. This has also been observed for other rod-like molecules before.42 It is attributed to the increasing interaction of the molecular backbone with the substrate with increasing molecule length. This forces the molecules to lie down on the substrate.16 The extent of condensation into flat islands is reduced with increasing Tsub. This dependence decreases even more for the methoxy-functionalized ones.
3.2 Aging
It is crucial that all morphological characterization is done immediately after transfer to ambient conditions since some of the morphological features become unstable: the samples undergo aging.43 Flat islands and fibers are rather static, but clusters tend to vanish as shown in Fig. 5: a sample of NaT3 is prepared in vacuum, and imaged under ambient conditions minutes after venting. Clusters, fibers, and flat islands are observed. After 110 hours, the same area is imaged again. Many of the small clusters have vanished, especially those situated close to fibers, resulting in denuded zones. The size of these zones is increasing with time. Some remaining clusters are getting taller and narrow fibers start vanishing. This is Ostwald ripening,44i.e. the growth of larger entities at the expense of smaller ones with the same constitution. Here the small clusters and the fibers are both composed of lying molecules with the same crystalline phase. There is no evidence that flat islands rearrange to be absorbed by the fibers or vice versa, but clusters loose material to flat islands, too, i.e. shrink via quasi-Ostwald ripening.3.3 Polarization analysis
The emitted fluorescence from the fibers is highly anisotropic, and the fibers are birefringent and bireflectant. For single fibers the fluorescence intensity observed through a linear polarizer follows a cos2![[thin space (1/6-em)]](https://www.rsc.org/images/entities/char_2009.gif) ϕ dependence, ϕ being the polarizer angle. Since the molecules are rod-like and since they crystallize in a herringbone manner,23 the polarizer angle ϕpol for which the maximum fluorescence intensity is observed matches the long molecular axis of NaT, MONaT, NaT3, and MONaT3 as long as no depolarization takes place. For NaT2 and MONaT2 the match is only approximate since the transition dipole is rotated by a few degrees with respect to the long molecule axis due to the even number of thiophene rings.45 To correlate the angle for maximum polarization ϕpol(x,y) at the image pixel (x,y) with morphology, the local fiber orientation at (x,y), θorient(x,y), is identified from the structure tensor.36,46,47 These two quantities define the local orientational angle
ϕ dependence, ϕ being the polarizer angle. Since the molecules are rod-like and since they crystallize in a herringbone manner,23 the polarizer angle ϕpol for which the maximum fluorescence intensity is observed matches the long molecular axis of NaT, MONaT, NaT3, and MONaT3 as long as no depolarization takes place. For NaT2 and MONaT2 the match is only approximate since the transition dipole is rotated by a few degrees with respect to the long molecule axis due to the even number of thiophene rings.45 To correlate the angle for maximum polarization ϕpol(x,y) at the image pixel (x,y) with morphology, the local fiber orientation at (x,y), θorient(x,y), is identified from the structure tensor.36,46,47 These two quantities define the local orientational angle| βmol(x,y) = ϕpol(x,y) − θorient(x,y). |
This angle, mapped to the range from 0° to 180°, describes how the long molecular axes are distributed within the fibers with respect to the local long fiber axis. Symmetric values in terms of 90° depict a mirrored molecule arrangement (mirror plane perpendicular to the substrate surface and along the local fiber orientation). XRD or selected area electron diffraction can of course deliver much more specific information on, e.g., contact faces and crystalline phases, but with the huge disadvantage of high equipment costs, beam damage of delicate structures, time-consuming investigations, missing spatial resolution, overlapping and disturbing peaks from the growth substrate, and non-visible diffraction peaks due to extinction.
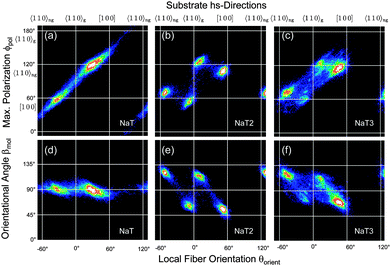
Correlating two of the three quantities βmol(x,y), θorient(x,y), and ϕpol(x,y) reveals a detailed understanding of fiber structure, Fig. 6 and 7. Different fiber directions correlate to specific polarization angles. Methoxy functionalization leads to more well defined fiber orientations, which manifests in smaller spot sizes in the correlation plots. All the observed angles are collected in Table S1 in the ESI.†
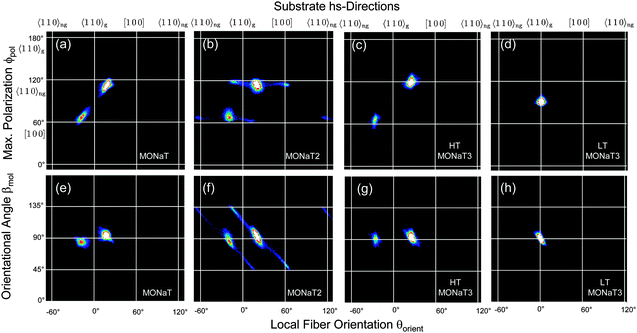 | ||
| Fig. 7 Correlation plots for the methoxy functionalized molecules. For details see Fig. 3 and 6. | ||
Using optical methods not only the organisation of molecules into fibers is exploited with μm resolution, but also the relationship with the substrate high-symmetry (hs)-directions [100] and 〈110〉. The hs-directions are determined by a percussion figure in between two crossed polarizers48,49 and are depicted by solid white lines in Fig. 6 and 7. Along one of the 〈110〉 directions, 〈110〉g, tilted SiO4 tetrahedra form grooves and define the mirror symmetry of the substrate. They change direction from [110] to [![[1 with combining macron]](https://www.rsc.org/images/entities/char_0031_0304.gif) 10] and back as one advances from one cleavage plane to the next.50 For unidirectionally growing fibers such as the ones from p-6P this results in two types of domains of mutually parallel fiber orientations.42,51
10] and back as one advances from one cleavage plane to the next.50 For unidirectionally growing fibers such as the ones from p-6P this results in two types of domains of mutually parallel fiber orientations.42,51
For NaT the molecules are preferentially aligned along [100] and—deduced from the mirror symmetry52—along the non-grooved 〈110〉ng direction. They are perpendicular to the local long fiber axis, i.e. βmol = 90°, Fig. 6(a and d). For NaT2 and NaT3, Fig. 6(b, c, e and f), the fibers are not exactly aligned along the hs-directions, but the four fiber directions clearly correspond to four different polarization directions, resulting in two fiber types. The orientational angle βmol takes on different values: for fibers along 〈110〉gβmol = 66° ± 4° (NaT2) and 74° ± 5° (NaT3), compared to 59° ± 5° (NaT2) and 66° ± 5° (NaT3) for the non-grooved directions. These different fiber types might be related either to different polymorphs, or to different contact faces of the fibers with the bulk crystal structure. Several low-index faces are possible which result in values for βmol between 60° and 75°. For NaT2 XRD has shown that molecules with their (111) face parallel to the substrate exist. Such nanofibers would have βmol ≈ 70°, well within the error bar for one of the fiber types determined optically. Good candidates for the other type are (010) (βmol ≈ 66°), (110) (βmol ≈ 65°), and (210) (βmol ≈ 61°). In a XRD powder pattern all these lead to peaks about two orders of magnitude weaker than the (111) peak, making them here undetectable for XRD. The occurrence of different values of βmol and of different contact faces is not new. Similar observations have been made for, e.g., p-6P, α-quaterthiophene, and α-sexithiophene12,40 on various substrates, thus limiting their applicability for devices based on ensembles of fibers.
In contrast, for the methoxy-functionalized variants only two fiber orientations are detected. Molecule orientations within the fibers are βmol ≈ 90°, in agreement with previous observations that methoxy functionalization favours crystallization into an orthorhombic structure.7,53 Molecules orient close to [100] and 〈110〉ng. For MONaT2 a small amount of four additional needle orientations is observed, which corresponds to the winglets forming at the end of the main fibers. Their polarisation properties are the same as for the associated main fiber, but since their growth direction is rotated by 45° the value of βmol is also 45°. For MONaT3 for lower Tsub only a single fiber orientation is realized, growing exactly along 〈110〉g.
In all cases (except for MONaT3 at low temperatures) the transition dipoles are oriented almost along the two non-grooved hs-directions, Fig. 8. For βmol ≈ 90° this results in two fiber orientations, for βmol ≠ 90° in four fiber orientations. In the past this has been explained by either electric dipole fields on the substrate surface54 or by the surface corrugation.55 Both can be avoided by choosing phlogopite mica instead of muscovite as a growth substrate.30 Then all three molecular orientations together with six fiber orientations are realized, as shown for NaT3 in Fig. S2 (ESI†). For a detailed analysis and comparison either the lattice mismatch56 or adsorption energies55,57 have to be calculated, both requiring the so far unknown molecular crystal structures.
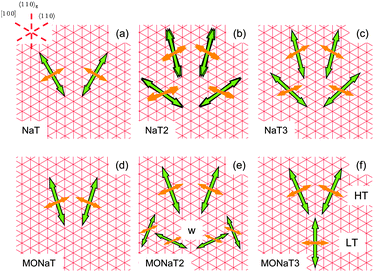 | ||
| Fig. 8 Sketch of transition dipoles (thin orange arrows) and fiber directions (bold green arrows) for the unfunctionalized naphthyl-thiophenes (a–c) and for the methoxy-functionalized variants (d–f). | ||
3.4 Fluorescence spectroscopy
The observed polarized fluorescence of the films after UV excitation makes them suitable for polarized light emitting devices. The longer the molecule and thus the larger the conjugation length, the more red-shifted the fluorescence becomes; the color changes from bluegreen (NaT and MONaT) to yellowgreen (NaT3 and MONaT3). Often the optical properties of thin films from small organic molecules strongly depend on morphology and defects, which in turn affects the performances of optoelectronic devices.58–60 Therefore temperature dependent and spatially resolved fluorescence spectra have been collected.In Fig. 9 temperature dependent spectra are presented. The sample polar angle is adjusted so that the highest amount of fluorescence is detected. At room temperature for all molecules spectra with vibronic progressions are found (“component I”). Methoxy functionalization leads for NaT/MONaT and NaT2/MONaT2 to a red-shift of 0.33 eV and 0.13 eV, respectively. For NaT3/MONaT3 the peak positions are basically unchanged. The total fluorescence intensities increase with decreasing temperature by factors of 2 to 5, hinting at a thermally activated process with two competitive decay channels.58,61 Relative peak intensities between samples can vary by up to 50%, possibly related to disorder.62 An overview of the band positions E measured at room temperature is given in Tables S2 and S3 in the ESI† (“component I”). The highest energy peaks, especially for NaT2, are distorted, probably due to reabsorption of the emitted fluorescence; the known bandgaps are 2.5 eV and 2.4 eV for NaT2 and NaT3, respectively.23 The energetic differences of the observed peaks of 0.18 ± 0.015 eV correspond to the C![[double bond, length as m-dash]](https://www.rsc.org/images/entities/char_e001.gif) C stretch vibration at 0.19 eV and to the breathing mode of the thiophene rings at 0.18 eV,63,64 except for the distorted NaT peak.65 These peaks do not shift with decreasing temperature; apparent peak shifts are induced by new peaks evolving (“components II + III”), increasing in intensity with respect to component I with decreasing temperature. The energetic differences between the peaks of a single component are again 0.18 ± 0.015 eV, Tables S2 and S3 (ESI†).
C stretch vibration at 0.19 eV and to the breathing mode of the thiophene rings at 0.18 eV,63,64 except for the distorted NaT peak.65 These peaks do not shift with decreasing temperature; apparent peak shifts are induced by new peaks evolving (“components II + III”), increasing in intensity with respect to component I with decreasing temperature. The energetic differences between the peaks of a single component are again 0.18 ± 0.015 eV, Tables S2 and S3 (ESI†).
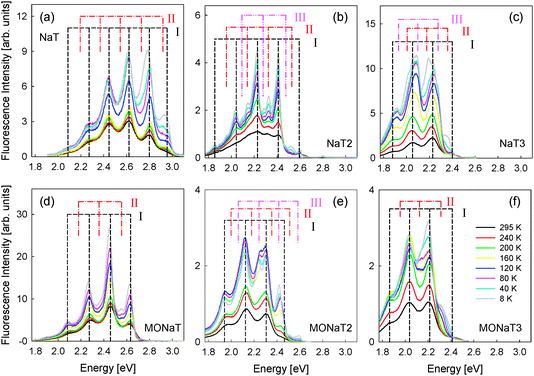 | ||
| Fig. 9 Temperature dependent fluorescence spectra on muscovite. Positions of different peak families (‘I’, ‘II’, and ‘III’) are marked. | ||
Spatially resolved fluorescence spectra for the three unfunctionalized molecules (λexc = 365 nm) are shown in Fig. 10. For the fluorescence from fibers (red solid lines) a vibronic progression with peaks at the exact positions as for the temperature dependent spectra are found. The areas from which the spectra are taken are shown as red squares on the right hand side. Flat islands or areas with many small clusters show much less detailed spectra (green dashed lines). Peak positions are redshifted compared to the fiber spectra. The reason for this might lie in fluorescence from different crystal faces,66 structural defects,67 a decrease of order, or a different type of aggregates (J- vs. H-aggregates).68 For NaT2 the positions of these peaks agree within 0.050 eV with the additional peaks observed during cooling of the samples in Fig. 9; for comparison the peak positions of component II are marked. Therefore we conclude that the additional families of fluorescence peaks observed in the temperature dependent spectra have their origin in different types of aggregates. Such additional peaks are not uncommon and were related to trap states at the interface or morphological defects,60,61,64,67 or to minor amounts of contamination from the synthesis of the molecules.69 Other possible causes such as different crystal structures induced by reversible structural phase transitions during cooling are ruled out due to the appearance even at room temperature.
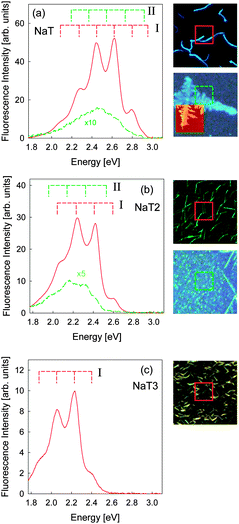 | ||
| Fig. 10 Left: spatially resolved fluorescence spectra. Right: corresponding fluorescence microscope images (together with an AFM image for NaT). Due to the large number of fibers that grow for NaT3 only a spectrum for fibers is shown. The peak positions of component I from Fig. 9 are marked for all spectra, and for NaT and NaT2 the positions of component II are also marked. | ||
4 Conclusions
A profound understanding of the structure of nanofibers, of their aging, and of their optical properties is an important prerequisite for the future design of reliable organic nanofiber based devices. Based on the occurrence of linearly aligned clusters and of denuded zones around embryonic fibers it has been proposed in the past that linear defects in the wetting layer serve as nucleation sites,70 and that these clusters move and agglomerate into nanofibers as soon as a critical coverage or a critical cluster size is reached.40,71 Since at room temperature the clusters are not mobile at all but loose molecules via Ostwald ripening and since the size of the denuded zones increases with storage time in air it is tempting to conclude in retrospect that also during initial fiber growth the clusters are not moving, but that fiber growth takes place by incorporating existing clusters as well as by transport of single molecules over the surface. This supports recent complementary experiments for para-hexaphenylene on mica72 and for rubicene on silicon dioxide73 where a dewetting process74 after the contact with water vapor during venting is made responsible for the formation of similar clusters.A polarization analysis of the emitted fluorescence is an excellent tool to characterize and to differentiate between dissimilar fibers; this is not necessarily possible or feasible with XRD. That way it has been shown that the alignment of the molecules and their crystallization with different contact faces is steered by the growth direction and thus by the muscovite surface anisotropy. Methoxy functionalization in all cases leads to fibers with molecules oriented perpendicular to the long fiber axis. The formation of well defined fibers is vastly improved, but the number of realized fiber orientations is reduced, which finally results in a more regularly decorated substrate. Such a strategy to improve fiber growth should also be suitable for other thiophenes and phenylenes.
Acknowledgements
AL thanks the DFG for financial support. MS thanks the DFG (SFB 624) and the Hanse Wissenschaftskolleg for supporting this work. We thank Jesper Jensen, MCI, for valuable help.References
- A. Facchetti, Mater. Today, 2007, 10, 28–37 CrossRef CAS.
- M. Schiek, F. Balzer, K. Al-Shamery, J. Brewer, A. Lützen and H.-G. Rubahn, Small, 2008, 4, 176–181 CrossRef CAS PubMed.
- A. Mishra, C.-Q. Ma and P. Bäuerle, Chem. Rev., 2009, 109, 1141–1276 CrossRef CAS PubMed.
- A. Mishra, C.-Q. Ma, J. Segura and P. Bäuerle, in Handbook of Thiophene-Based Materials, ed. I. Perepichka and D. Perepichka, Wiley, Chichester, 2009, ch. 1, vol. 1, pp. 1–155 Search PubMed.
- Y. Yan, C. Zhang, J. Yao and Y. Zhao, Adv. Mater., 2013, 25, 3627–3638 CrossRef CAS PubMed.
- E. Garcia-Frutos, J. Mater. Chem. C, 2013, 1, 3633–3645 RSC.
- S. Hotta, T. Yamao, S. Bisri, T. Takenobu and Y. Iwasa, J. Mater. Chem. C, 2014, 2, 965–980 RSC.
- F. Quochi, J. Opt., 2010, 12, 024003 CrossRef.
- F. Kim, G. Ren and S. Jenekhe, Chem. Mater., 2011, 23, 682–732 CrossRef CAS.
- L. Jiang, H. Dong and W. Hu, Soft Matter, 2011, 7, 1615–1630 RSC.
- K. Takazawa, J. i. Inoue and K. Mitsuishi, ACS Appl. Mater. Interfaces, 2013, 5, 6182–6188 CAS.
- C. Simbrunner, Semicond. Sci. Technol., 2013, 28, 053001 CrossRef.
- T. Katagiri, S. Ota, T. Ohira, T. Yamao and S. Hotta, J. Heterocycl. Chem., 2007, 44, 853–862 CrossRef CAS.
- J. Brewer, M. Schiek, A. Lützen, K. Al-Shamery and H.-G. Rubahn, Nano Lett., 2006, 6, 2656–2659 CrossRef CAS PubMed.
- J. Brewer, M. Schiek and H.-G. Rubahn, Opt. Commun., 2010, 283, 1514–1518 CrossRef CAS.
- T. Potocar, S. Lorbek, D. Nabok, Q. Shen, L. Tumbek, G. Hlawacek, P. Puschnig, C. Ambrosch-Draxl, C. Teichert and A. Winkler, Phys. Rev. B: Condens. Matter Mater. Phys., 2011, 83, 075423 CrossRef.
- S. Varghese and S. Das, J. Phys. Chem. Lett., 2011, 2, 863–873 CrossRef CAS PubMed.
- F. Liscio, C. Albonetti, K. Broch, A. Shehu, S. Quiroga, L. Ferlauto, C. Frank, S. Kowarik, R. Nervo, A. Gerlach, S. Milita, F. Schreiber and F. Biscarini, ACS Nano, 2013, 7, 1257–1264 CrossRef CAS PubMed.
- C. Bardeen, MRS Bull., 2013, 38, 65–71 CrossRef.
- S.-Y. Kwak, C. Choi and B.-S. Bae, Electrochem. Solid-State Lett., 2009, 12, G37–G39 CrossRef CAS.
- Y.-J. Lin, H.-Y. Tsao and D.-S. Liu, Appl. Phys. Lett., 2012, 101, 013302 CrossRef.
- J. Youn, S. Kewalramani, J. Emery, Y. Shi, S. Zhang, H.-C. Chang, Y. j. Liang, C.-M. Yeh, C.-Y. Feng, H. Huang, C. Stern, L.-H. Chen, J.-C. Ho, M.-C. Chen, M. Bedzyk, A. Facchetti and T. Marks, Adv. Funct. Mater., 2013, 23, 3850–3865 CrossRef CAS.
- H. Tian, J. Shi, B. He, N. Hu, S. Dong, D. Yan, J. Zhang, Y. Geng and F. Wang, Adv. Funct. Mater., 2007, 17, 1940–1951 CrossRef CAS.
- M. Zhang, H. Wang, H. Tian, Y. Geng and C. Tang, Adv. Mater., 2011, 23, 4960–4964 CrossRef CAS PubMed.
- Y. Chen, H. Tian, J. Chen, Y. Geng, D. Yan, L. Wang and D. Ma, J. Mater. Chem., 2012, 22, 8492–8498 RSC.
- H. Tian, J. Shi, D. Yan, L. Wang, Y. Geng and F. Wang, Adv. Mater., 2006, 18, 2149–2152 CrossRef CAS.
- A. Operamolla and G. Farinola, Eur. J. Org. Chem., 2011, 423–450 CrossRef CAS.
- M. Schiek, A. Lützen, R. Koch, K. Al-Shamery, F. Balzer, R. Frese and H.-G. Rubahn, Appl. Phys. Lett., 2005, 86, 153107 CrossRef.
- K. Müller and C. Chang, Surf. Sci., 1969, 14, 39–51 CrossRef.
- Y. Kuwahara, Phys. Chem. Miner., 2001, 28, 1–8 CrossRef CAS.
- I. Wallmann, G. Schnakenburg and A. Lützen, Synthesis, 2009, 79–84 CAS.
- X. Liu, I. Wallmann, H. Boudinov, J. Kjelstrupp-Hansen, M. Schiek, A. Lützen and H.-G. Rubahn, Org. Electron., 2010, 11, 1096–1102 CrossRef CAS.
- J. Brewer, H. Henrichsen, F. Balzer, L. Bagatolli, A. Simonsen and H.-G. Rubahn, Proc. SPIE, 2005, 5931, 59310Y CrossRef.
- R. Tettenhorst and C. Corbato, Clays Clay Miner., 1993, 41, 45–55 CAS.
- C. Gribble and A. Hall, Optical Mineralogy, UCL Press, London, 1992 Search PubMed.
- W. Rasband, ImageJ, 1997–2013 Search PubMed , http://imagej.nih.gov/ij/.
- P. Thévenaz, U. Ruttimann and M. Unser, IEEE Trans. Image Process., 1998, 7, 27–41 CrossRef PubMed.
- U. Bernchou, J. Brewer, H. Midtiby, J. Ipsen, L. Bagatolli and A. Simonsen, J. Am. Chem. Soc., 2009, 131, 14130–14131 CrossRef CAS PubMed.
- L. Athouel, G. Froyer and M. Riou, Synth. Met., 1993, 55–57, 4734–4739 CrossRef.
- L. Kankate, F. Balzer, H. Niehus and H.-G. Rubahn, J. Chem. Phys., 2008, 128, 084709 CrossRef PubMed.
- F. Balzer, M. Schiek, K. Al-Shamery, A. Lützen and H.-G. Rubahn, J. Vac. Sci. Technol., B: Microelectron. Nanometer Struct.–Process., Meas., Phenom., 2008, 26, 1619–1623 CrossRef CAS.
- F. Balzer and H.-G. Rubahn, Surf. Sci., 2004, 548, 170–182 CrossRef CAS.
- F. Balzer, M. Schiek, I. Wallmann, A. Schäfer, A. Lützen and H.-G. Rubahn, Proc. SPIE, 2011, 8094, 809409 CrossRef.
- Y. Tang, Y. Wang, X. Wang, S. Xun, C. Mei, L. Wang and D. Yan, J. Phys. Chem. B, 2005, 109, 8813–8819 CrossRef CAS PubMed.
- H. Sun, Z. Zhao, F. Spano, D. Beljonne, J. Cornil, Z. Shuai and J.-L. Brédas, Adv. Mater., 2003, 15, 818–822 CrossRef CAS.
- E. Fonck, G. Feigl, J. Fasel, D. Sage, M. Unser, D. Rüfenacht and N. Stergiopulos, Stroke, 2009, 40, 2552–2556 CrossRef CAS PubMed.
- R. Rezakhaniha, A. Agianniotis, J. Schrauwen, A. Griffa, D. Sage, C. Bouten, F. van de Vosse, M. Unser and N. Stergiopulos, Biomech. Model. Mechanobiol., 2012, 11, 461–473 CrossRef CAS PubMed.
- C. Frondel and G. Ashby, Am. Mineral., 1937, 22, 104–121 CAS.
- R. Jahns and F. Lancaster, Physical Characteristics of Commercial Sheet Muscovite in the Southeastern United States, United States Government Printing Office Geological Survey Professional Paper 225, 1950.
- D. Griffen, Silicate Crystal Chemistry, Oxford University Press, New York, 1992 Search PubMed.
- H. Plank, R. Resel, A. Andreev, N. Sariciftci and H. Sitter, J. Cryst. Growth, 2002, 237–239, 2076–2081 CrossRef CAS.
- L. Kankate, F. Balzer, H. Niehus and H.-G. Rubahn, Thin Solid Films, 2009, 518, 130–137 CrossRef CAS.
- J. Bernstein, J. Sarma and A. Gavezotti, Chem. Phys. Lett., 1990, 174, 361–368 CrossRef CAS.
- F. Balzer and H.-G. Rubahn, Appl. Phys. Lett., 2001, 79, 3860–3862 CrossRef CAS.
- C. Simbrunner, D. Nabok, G. Hernandez-Sosa, M. Oehzelt, T. Djuric, R. Resel, L. Romaner, P. Puschnig, C. Ambrosch-Draxl, I. Salzmann, G. Schwabegger, I. Watzinger and H. Sitter, J. Am. Chem. Soc., 2011, 133, 3056–3062 CrossRef CAS PubMed.
- R. Resel, T. Haber, O. Lengyel, H. Sitter, F. Balzer and H.-G. Rubahn, Surf. Interface Anal., 2009, 41, 764–770 CrossRef CAS.
- M. Moret, A. Borghesi, M. Campione, E. Fumagalli, L. Raimondo and A. Sassella, Cryst. Res. Technol., 2011, 46, 827–832 CrossRef CAS.
- R. Marks, R. Michel, W. Gebauer, R. Zamboni, C. Taliani, R. Mahrt and M. Hopmeier, J. Phys. Chem. B, 1998, 102, 7563–7567 CrossRef CAS.
- R. Marks, M. Muccini, E. Lunedi, R. Michel, M. Murgia, R. Zamboni, C. Taliani, G. Horowitz, F. Garnier, M. Hopmeier, M. Oestreich and R. Mahrt, Chem. Phys., 1998, 227, 49–56 CrossRef CAS.
- M. Cerminara, A. Borghesi, F. Meinardi, A. Sassella, R. Tubino and A. Papagni, Synth. Met., 2002, 128, 63–66 CrossRef CAS.
- A. Mani, J. Schoonman and A. Goossens, J. Phys. Chem. B, 2005, 109, 4829–4836 CrossRef CAS PubMed.
- F. Spano, Acc. Chem. Res., 2010, 43, 429–439 CrossRef CAS PubMed.
- A. Yang, M. Kuroda, Y. Shiraishi and T. Kobayashi, J. Chem. Phys., 1998, 109, 8442–8450 CrossRef CAS.
- W. Gebauer, C. Väterlein, A. Soukopp, M. Sokolowski, R. Hock, H. Port, P. Bäuerle and E. Umbach, Synth. Met., 1997, 87, 127–135 CrossRef CAS.
- T.-S. Ahn, A. Müller, R. Al-Kaysi, F. Spano, J. Norton, D. Beljonne, J.-L. Bredas and C. Bardeen, J. Chem. Phys., 2008, 128, 054505 CrossRef PubMed.
- S. Tanaka, Y. Katano, Y. Kimura, T. Yoshinari, S.-I. Nagasaka, H. Itoh and Y. Kuriyama, Phys. Status Solidi A, 2010, 207, 1474–1480 CrossRef CAS.
- M. Schneider, M. Brinkmann, M. Muccini, F. Biscarini, C. Taliani, W. Gebauer, M. Sokolowski and E. Umbach, Chem. Phys., 2002, 285, 345–353 CrossRef CAS.
- E. Da Como, M. Loi, M. Murgia, R. Zamboni and M. Muccini, J. Am. Chem. Soc., 2006, 128, 4277–4281 CrossRef CAS PubMed.
- S. Trabattoni, S. Laera, R. Mena, A. Papagni and A. Sassella, J. Mater. Chem., 2004, 14, 171–178 RSC.
- C. Teichert, G. Hlawacek, A. Andreev, H. Sitter, P. Frank, A. Winkler and N. Sariciftci, Appl. Phys. A: Mater. Sci. Process., 2006, 82, 665–669 CrossRef CAS.
- G. Hlawacek, C. Teichert, A. Andreev, H. Sitter, S. Berkebile, G. Koller, M. Ramsey and R. Resel, Phys. Status Solidi A, 2005, 202, 2376–2385 CrossRef CAS.
- L. Tumbek, C. Gleichweit, K. Zojer and A. Winkler, Phys. Rev. B: Condens. Matter Mater. Phys., 2012, 86, 085402 CrossRef.
- B. Scherwitzl, W. Lukesch, A. Hirzer, J. Albering, G. Leising, R. Resel and A. Winkler, J. Phys. Chem. C, 2013, 117, 4115–4123 CAS.
- S. Burke, J. Tropple and P. Grütter, J. Phys.: Condens. Matter, 2009, 21, 423101 CrossRef CAS PubMed.
Footnotes |
| † Electronic supplementary information (ESI) available: Orientation and polarization angles of nanofibers, thickness dependence of NaT3 growth, correlation plots of NaT3 on phlogopite mica, details of the fluorescence spectra, and synthesis schemes for NaT3/MONaT3. See DOI: 10.1039/c3cp53881h |
| ‡ Present address: Energy and Semiconductor Research Laboratory, Institute of Physics, University of Oldenburg, D-26111 Oldenburg, Germany. |
| This journal is © the Owner Societies 2014 |

