Stopped-flow kinetic studies of the formation and disintegration of polyion complex micelles in aqueous solution†
Jingyan
Zhang
*ab,
Sangui
Chen
a,
Zhiyuan
Zhu
b and
Shiyong
Liu
*b
aSchool of Materials and Chemical Engineering, Anhui Key Laboratory of Advanced Building Materials, Anhui Jianzhu University, Hefei, Anhui 230601, China. E-mail: zhangjy8@mail.ustc.edu.cn; Fax: +86 551 63528960; Tel: +86 551 63528960
bCAS Key Laboratory of Soft Matter Chemistry, Department of Polymer Science and Engineering, Hefei National Laboratory for Physical Sciences at the Microscale, University of Science and Technology of China, Hefei, Anhui 230026, China. E-mail: sliu@ustc.edu.cn; Fax: +86 551 63607348; Tel: +86 551 63607348
First published on 15th October 2013
Abstract
The formation of soluble polyion complexes (PICs) from anionic block copolymers, poly(ethylene oxide)-b-poly(sodium 4-styrene sulfonate) (PEO-b-PSSNa) and cationic block copolymers, poly(ethylene oxide)-b-poly(quaternized 2-(dimethyl amino)ethyl methacrylate) (PEO-b-PQDMA) was investigated by fluorescence spectroscopy, laser light scattering (LLS), and stopped-flow light scattering. Colloidally stabilized dispersions could be obtained upon direct mixing of the aqueous solutions of these two block copolymers, which indicated the formation of core–shell nanostructures with the core consisting of interpolymer electrostatic complexes between PSSNa and PQDMA blocks and the corona of PEO block. Both LLS and fluorescence results revealed that the most compact complex micelles formed at the equal molar ratio of oppositely charged SSNa and QDMA residues. The kinetics of the assembly process was studied via stopped-flow upon direct mixing of the two polymer solutions. The complexation process between PEO-b-PQDMA and PEO-b-PSSNa was fast and could finish within seconds. Moreover, the relaxation process can only be detected at near equal SSNa to QDMA molar ratios. The relaxation curves can be well fitted by a double-exponential function, leading to a fast relaxation process related to the initial quasi-equilibrium complex formation and a slow process related to the pre-complex structure rearrangements to the final equilibrium complexes. Both stages are determined as second-order reactions and processed through a micelle fusion–fission mechanism. Fluorescence kinetic studies revealed that the neutralization of an oppositely charged polyion was too fast to be detected and should be completed within the stopped-flow dead-time. Thermodynamic studies revealed that spontaneous complexation is entropy driven. Upon increasing the ionic strength of the solutions, the complexation processes became slower due to the decrease of entropy driving force. The PIC dissociation process was further studied and considered to consist of two competing processes: a second-order process depending on PIC concentration and a first-order process independent of the PIC concentration.
Introduction
Double hydrophilic block copolymers (DHBCs) can self-assemble into mesophases with a variety of morphologies, such as micelles, vesicles, tubules, and complex super-aggregates, depending on external stimuli such as pH, temperature, ionic strength, external additives, and light irradiation, etc.1–14 The electrostatic interaction between oppositely charged polyelectrolytes led to the formation of intermolecular polyion complexes (PICs), thus providing an alternate driving force for the micellization of neutral–polyelectrolyte block copolymers.15–25 Since Kataoka et al.18 and Kabanov et al.19 first reported the formation of PIC micelles from neutral–polyelectrolyte block copolymers, water soluble PIC micelles with a polyion complex core and nonionic hydrophilic polymer shell have been widely studied and have found applications in the delivery of DNA, therapeutic proteins, low molecular weight drugs, and imaging agents.19,22,26–30Although the formation and properties of PICs are extensively investigated, studies of the dynamic mechanism of intermolecular complexation are really scarce. To our knowledge, there are only a few literature reports related the complexation kinetics. Morawetz et al.31,32 studied the kinetics of complexation between dansyl-labeled poly(acrylic acid) (PAA) and poly-(ethylene oxide) (PEO) via hydrogen-bond interactions from the evolution of fluorescence intensity with time. The kinetic traces are fitted with double-exponential functions, leading to two rate constants. However the assignments of these two rate constants to specific physical processes have not been not stated. Morishima et al.33 reported the dynamic interactions between a pyrene-labeled polyelectrolyte, poly(sodium 2-(acrylamido)-2-methyl propanesulfonate) (Py-PAMPS), and an oppositely charged rodlike micelle, dimethyl-oleylamine oxide (DMOAO) mixed with hexadecyltrimethylammonium chloride (CTAC), by a fluorescence quenching technique with a hydrophobic quencher residing in the micelle core. The kinetic traces were fitted with double-exponential functions, but they did not ascribe any physical processes to the two resulted rate constants.
Stuart et al.34 reported the kinetics of micelle formation with polyelectrolyte complex cores from PAA and poly-((dimethylamino)ethyl methacrylate)-b-poly(glyceryl ethacrylate) (PDMA-b-PGMA) in aqueous solution at pH 7. Upon mixing, they unexpectedly observed the decrease of scattering intensities with time, while we know that the formation of micellar complexes will indeed increase the scattering intensities relative to those of initially molecularly dissolved solutions. They concluded that the formation of final stable micellar complexes is preceded by a macroscopic phase separation, followed by subsequent rearrangement. Lindhoud and Stuart et al.35 studied the relaxation times of the complex formation with light scattering titrations and size relaxation measurements. They found the difference in system relaxation time (τ) as compared to the experimental time (τexp) in terms of the structures and composition of polyelectrolyte complexes. For system A, it consisted of two weakly charged polyelectrolytes, such as PDMA and poly(acrylic acid)-b-poly(acryl amide) (PAA-b-PAAm), τ < τexp, while system B consisted of a strongly and a weakly charged polyelectrolyte, such as PAA and poly(2-methyl vinyl pyridinium iodide)-b-poly(ethylene oxide) (P2MVP-b-PEO), τ > τexp.
Eisenberg et al.36,37 reported the kinetics of the complexation between poly(methyl methacrylate-co-4-vinylpridine) (PMMA-co-P4VP) and partially sulfonated polystyrenes (PS-co-PSSA) in DMSO-d6 by 1H NMR. They concluded that the whole process was occurring through a complex mechanism. The fast stage of the process related to the formation of cationic–anionic pairs was a second-order reaction, while the slow stage at which a “ladder”-like complex was formed could be presented as containing two opposing first-order reactions. Bakeev and Kabanov et al.38 reported the complexation kinetic studies of mixing oppositely charged linear polyelectrolytes, pyrene-labeled poly(sodium methacrylate) (PMANaPy) and poly(N-ethyl-4-vinyl pyridinium bromide) (PEVPB), by luminescence quenching and laser light scattering techniques. They pointed out the complexation process consisted of a first rapid coupling of the oppositely charged polyions with the formation of a nonequilibrium interpolyelectrolyte network, followed by a slow relaxation process, finally leading to the formation of the individual PICs. On the basis of this, Kabanov et al.39 further studied the kinetics of the formation from anionic polyion shell micelles (PSM), PS-b-PEVPB in aqueous solution, and linear polycation PMANa. They found that the coupling reactions involving PSMs were much slower as compared to those of linear polyelectrolytes.
As stated above, the complexation process involves two stages. The first fast stage is the approaching of polyions which leads to nonequilibrium complex formation. This stage proceeds within milliseconds. The second slower stage is the formation of equilibrium complexes through polyion interchange reactions. But in the experiments described by Eisenberg and Kabanov et al.,36–39 they did not observe the first stage directly. Limited by the experimental apparatus, the fast process was completed before the first kinetic data were obtained. Second, the complexation for kinetic studies often occurred between a long polyelectrolyte and a short oppositely charged polymer. And the complexes always possessed an excess charge to ensure the assemblies were stable in solutions. As reported by Kataoka et al.40 at 1999, the core–shell type supramolecular assemblies can only be formed with the charged segments possessing matched chain lengths. The above reports may not reflect the actual kinetic process of the formation of water soluble core–shell complex micelles.
Stopped flow is a useful tool for kinetic studies of processes with relaxation times down to 1–2 ms. This technique has been widely used in biophysics, such as protein folding. Recently, we have successfully employed stopped-flow to study the kinetics of interpolymer complexes from poly(4-vinylphenol-g-styrene) (PVPh-g-PS) and poly(styrene-co-4-vinylpyridine) (STVPy) via hydrogen-bonding interactions in THF.41
Herein, we investigate the complexation formed by two double hydrophilic block copolymers, poly(ethylene oxide)-b-poly-(sodium 4-styrene sulfonate) (PEO-b-PSSNa) and poly(ethylene oxide)-b-poly(quaternized 2-(dimethylamino)ethyl methacrylate) (PEO-b-PQDMA), with comparable block length and charged repeats. With soluble PEO chain, polyanion and polycation can form soluble complex even at equal SSNa to QDMA molar ratio. The complexation kinetics is investigated by stopped-flow scattering intensity while varying the cationic to anionic molar ratio, polymer concentration, added salt concentration, and temperature. Stopped-flow fluorescence intensity has also been used employing pyrene as the fluorescence probe. The PIC dissociation has also been studied.
Experimental
Materials
2-(Dimethylamino)ethyl methacrylate (DMA, Aldrich) was vacuum distilled from CaH2 and stored in a refrigerator before use. Sodium 4-styrene sulfonate (SSNa, Aldrich), copper(I) bromide (CuBr, Aldrich), 2,2′-bipyridine (bpy, Aldrich), monohydroxy-capped poly(ethylene oxides) with mean degrees of polymerization of 113 (designated PEO113-OH, Fluka), and other reagents were purchased from commercial sources and were used without further purification. PEO macroinitiator (PEO113-Br) was synthesized as previously described.42 Aqueous solutions of PEO-b-PQDMA and PEO-b-PSSNa were prepared in deionized water and filtered through 0.45 mm nitrocellulose filters (Acrodisc) to remove dusts prior to use.Synthesis
The cationic polyelectrolyte, poly(ethylene oxide)-b-poly-(quaternized 2-(dimethylamino)ethyl methacrylate) (PEO113-b-PQDMA48) diblock copolymer, was synthesized as described by Armes et al.43,44 First, PEO-b-PDMA was prepared via atom transfer radical polymerization (ATRP) of DMA using PEO113-Br as the macroinitiator. The polydispersity index (Mw/Mn) of resulting block copolymer was 1.17 as measured by gel permeation chromatography (GPC) using a series of three linear Styragel columns and THF as eluent. The actual mean degree of polymerization of the DMA block was calculated to be 48 by 1H NMR studies. After that, PEO-b-PQDMA was obtained by quaternization of PDMA block by CH3I in THF. The anionic polyelectrolyte, poly(ethylene oxide)-b-poly(sodium 4-styrene sulfonate) (PEO113-b-PSSNa47) diblock copolymer, was prepared via ATRP of SSNa using PEO113-Br as the macroinitiator in mixed aqueous solutions media at 25 °C by the similar protocols described by Choi and Kim.45 The polydispersity index (Mw/Mn) of the resulting block copolymer was 1.24 as measured by GPC using water containing 0.02 wt% sodium sulfate as the eluent phase. The actual mean degree of polymerization of the SSNa block was calculated to be 47 by 1H NMR.Characterization
Results and discussion
Formation of polyion complex (PIC) micelles
Colloidally stabilized dispersions were obtained upon directly mixing aqueous solutions of PEO-b-PQDMA and PEO-b-PSSNa, which indicated the formation of a core–shell structure with a core consisting of interpolymer electrostatic complexes between PSSNa and PQDMA blocks and a corona consisting of a hydrophilic PEO block. To obtain stable PIC micelles, both polyelectrolytes employing hydrophilic PEO were necessary. In additional experiments, mixing block polyelectrolyte with oppositely charged homo-polyelectrolyte would lead to the formation of unstable aggregates, especially at the equal [QDMA]/[SSNa] mixing molar ratio, which would be precipitated out within hours.Laser light scattering was used to investigate the complexation between opposite polyelectrolytes. Fig. 1 shows the dynamic LLS results of PIC micelles prepared at varying [QDMA]/[SSNa] molar ratios. Apparently, aqueous solution of PIC micelles formed at [QDMA]/[SSNa] = 1.0 exhibits the strongest characteristic bluish scattering tinge. We can clearly see that in the [QDMA]/[SSNa] range of 0.5 to 1.6 the intensity-average hydrodynamic radii, 〈Rh〉, are ca. 15–44 nm, exhibiting a maximum value of 44 nm and a relatively narrow size polydispersity (μ2/Γ2) of 0.10 at [QDMA]/[SSNa] = 1![[thin space (1/6-em)]](https://www.rsc.org/images/entities/char_2009.gif) :1. Mean-while, scattered light intensity also exhibits a maximum at [QDMA]/[SSNa] = 1:1, indicating that polyelectrolyte complexation between oppositely charged PMAA and PQDMA backbones proceeds stoichiometrically. Stuart et al.46 had concluded that PIC micelles only exist in a small window with respect to the mixing ratios of the two components and the most compact PIC micelles with the highest aggregation number only form at the mixing ratio where the excess charge of the polyelectrolyte mixture is close to zero. This also proves to be true for the current case, in which PIC micellar solution exhibits the largest scattered light intensity and the biggest size at [QDMA]/[SSNa] = 1:1. Beyond the [QDMA]/[SSNa] range of 0.5 to 1.6, the mixed solutions are optically clear and exhibit very low scattered intensity, suggesting the formation of soluble complexes with quite loose structures. It may be due to the presence of electrostatic repulsion which prevents the formation of compact structures from excess charges. Thus, in subsequent studies, we mainly concentrate on PIC micelles prepared at a fixed stoichiometric mixing ratio of [QDMA]/[SSNa] = 1:1.
:1. Mean-while, scattered light intensity also exhibits a maximum at [QDMA]/[SSNa] = 1:1, indicating that polyelectrolyte complexation between oppositely charged PMAA and PQDMA backbones proceeds stoichiometrically. Stuart et al.46 had concluded that PIC micelles only exist in a small window with respect to the mixing ratios of the two components and the most compact PIC micelles with the highest aggregation number only form at the mixing ratio where the excess charge of the polyelectrolyte mixture is close to zero. This also proves to be true for the current case, in which PIC micellar solution exhibits the largest scattered light intensity and the biggest size at [QDMA]/[SSNa] = 1:1. Beyond the [QDMA]/[SSNa] range of 0.5 to 1.6, the mixed solutions are optically clear and exhibit very low scattered intensity, suggesting the formation of soluble complexes with quite loose structures. It may be due to the presence of electrostatic repulsion which prevents the formation of compact structures from excess charges. Thus, in subsequent studies, we mainly concentrate on PIC micelles prepared at a fixed stoichiometric mixing ratio of [QDMA]/[SSNa] = 1:1.
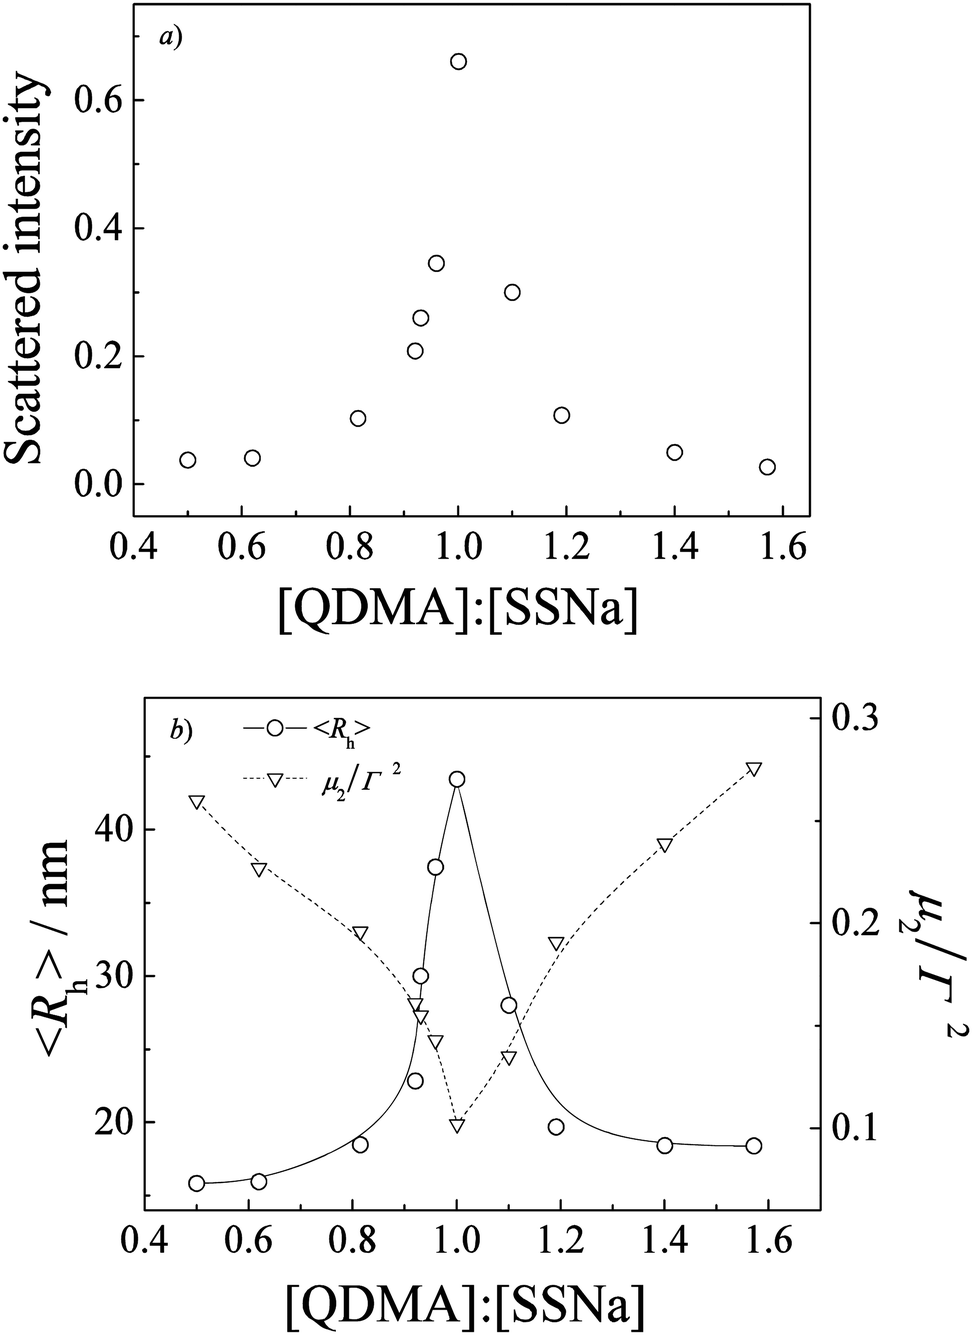 | ||
| Fig. 1 Variation of (a) scattered light intensity, (b) intensity-average hydrodynamic radius, 〈Rh〉, and μ2/Γ2 as a function of [QDMA]/[SSNa] molar ratios obtained for polyion complex (PIC) micelles prepared via stopped-flow mixing aqueous solutions of PEO-b-PQDMA and PEO-b-PSSNa at a total polymer concentration of 1.0 g L−1. | ||
It should be noted that the PIC micelles for LLS studies were all collected from stopped-flow conditions. Fig. S1 (ESI†) shows a comparison of the hydrodynamic radius distributions, f(Rh), of the PIC micelles via two different mixing methods, stopped-flow mixing and dropwise addition under stirring, respectively. We can see clearly there are apparent differences between them. The obtained PIC micelles are smaller with a broader distribution by fast mixing with stopped-flow than those obtained by drop addition under stirring. Mezei et al.47 recently investigated the effects of different mixing protocols on the charged nature and size distribution of hyperbranched poly(ethylene imine) (PEI)–sodium dodecyl sulfate (SDS) complexes formed in aqueous solution. It was found that colloidal dispersion of isolated PEI–SDS nanoparticles formed on a stopped-flow apparatus, while large clusters formed typically if a less efficient mixing protocol was chosen. We also presented recently that there is difference between stopped-flow mixing and less efficient mixing on pH-induced micellization. The formed micelles of PEO-b-PDEA block copolymers by stopped-flow mixing were smaller than those via usual methods.48
The formation of PIC micelles was also studied by fluorescence spectroscopy using pyrene as the fluorescence probe. It is well known that the fine structure of the emission spectrum of pyrene, especially the ratio between the intensities of the first and third vibrational bands, I1/I3, is rather sensitive to the polarity of its surrounding medium: this ratio was demonstrated to decrease if the environment of the fluorescent probe becomes less polar.49,50 Fig. S2a (ESI†) shows the fluorescence spectrum of pyrene in solutions of pure PEO-b-PQDMA, PEO-b-PSSNa and PIC micelles. It is clear that the fluorescence intensities of pyrene in PIC micelles are weaker than those in pure polyions. The calculated values of I1/I3 of the component at different QDMA to SSNa molar ratio are shown in Fig. S2b (ESI†). The evaluated value of I1/I3 of pyrene in PIC is lower than the value in pure polyelectrolyte solutions (I1/I3 ≈ 1.88) and reaches a minimum value at [QDMA]/[SSNa] = 1:1. This indicates that the formed PIC micelle core possesses less-polar microenvironment than aqueous solutions, which is similar to the literature reports.46 In addition, the I1/I3 value was relatively high beyond the equal QDMA to SSNa molar ratio, which most probably indicates that the complexes formed in this region possess a swollen micellar core with lower water insolubility.
Stopped-flow studies of complexation kinetics
Based on the above analysis about the structural information of PIC micelles, we then proceed to use stopped-flow employing light scattering and fluorescence detections to study the kinetics of the PIC micelles formation.Complexation kinetics at different [QDMA]/[SSNa] molar ratios
The principle of relaxation experiment using a basic stopped-flow is quite simple and has been described in previous reports in detail.41,51Fig. 2 shows the time dependence of scattered light intensities upon mixing aqueous solution of PEO-b-PQDMA and PEO-b-PSSNa at varying molar ratios of charged repeating units [QDMA]/[SSNa]. From the recorded dynamic curves, we can observe obvious increasing of light-scattering intensity only around the equal molar ratio of [QDMA]/[SSNa] (0.90–1.03), and the relaxation process is almost completed within 0.4 s. Beyond the equal molar ratio, the increasing amplitudes are relatively small. However, it can be concluded that polyelectrolyte complexes are still formed due to the enhanced light-scattering intensity as compared to the pure water (Fig. 2b). The recorded linear dynamic curves indicate that the formation process is too fast to be detected; the complexation process is completed within the stopped-flow dead time. | ||
| Fig. 2 Time dependence of scattered light intensity obtained after stopped-flow mixing aqueous solutions of PEO-b-PQDMA and PEO-b-PSSNa at varying [QDMA]/[SSNa] molar ratios. The total polymer concentration was fixed at 1.0 g L−1. From top to bottom, [QDMA]/[SSNa] mixing molar ratios were (a) 1.00, 0.94, 1.03, 0.90, 1.07, and 1.12, and (b) 0.80, 0.76, 1.24, 0.73, and 0.65. Dynamic traces in (a) and (b) can be well-fitted by double and single exponential functions, respectively. | ||
Compared to the reports by Eisenberg and Kabanov et al.,36–39 the complexation process observed here is much faster. It most probably is because the complexes formed from block polyions possess core–shell micellar structures with a small size, while the assemblies from oppositely charged polyions with unmatched chain lengths possess complicated structures. Bakeev and Kabanov et al.38 have also studied the complexation kinetics of mixing oppositely PMANaPy and PEVPB at [cation]/[anion] = 0.2 using stopped-flow technique. They failed to observe the kinetics process of the fast stage even within 5 ms. This can point out to the relaxation process being quite fast when one polyion is in excess. In the present case, beyond the [QDMA]/[SSNa] range of 0.65 to 1.25, the complexation processes of the formation of loose structural complexes induced by coupling of oppositely charged polyions are completed within 2.6 ms. The complexation process can only be detected from the formation of compact PIC micelles.
The observed temporal variations in light-scattering intensity, Is(t), are analyzed assuming a series of N first-order decays between structures spanning the initial and final states. The use of this elementary model to describe the complex changes occurring during the formation of PIC micelles is clearly an oversimplification. However, in the absence of direct structural information on the nature of the intermediate states, it provides a self-consistent way of analyzing the scattering data. Thus, dynamics data from these experiments are fit to a multi-exponential function of the following form
 | (1) |
 | (2) |
 | (3) |
 | ||
| Fig. 3 Overall kinetic coefficients (kf,obs) obtained during the formation of PIC micelles as a function of [QDMA]/[SSNa] mixing molar ratios. The experimental conditions were the same as those described in Fig. 2. | ||
Double-exponential function fittings lead to two characteristic kinetics coefficients, k1,obs and k2,obs, relating to two continuous processes. Compared the two pre-exponential constants A1 and A2, the first fast process related to k1,obs possesses scattered light intensity increasing with a large amplitude (ca. 0.7–0.8) reflecting most of the polyelectrolyte unimers coupling together accompanied by a great change in the aggregation size or the aggregation number densities, which mostly leads to quasi-equilibrium state formation. The second slower process related to k2,obs with a relatively small scattered light intensity increasing in amplitude is mostly related to the formation of final equilibrium complexes through arrangement of the aggregates in the first stage. The detailed investigation of these two processes will be discussed in upcoming studies. Since most of the relaxation process can be observed in the equal [QDMA]/[SSNa]molar ratio, thus, in subsequent studies, we fix the PIC micelles prepared at [QDMA]/[SSNa] = 1:1 for further detailed investigation.
Concentration dependence of the complexation kinetics
LLS studies reveal that the average hydrodynamic radius, 〈Rh〉, basically remains unchanged with increasing the total polymer concentration from 0.1 to 1.0 g L−1 and the scattered intensities increase almost linearly with the concentration (Fig. S4, ESI†). So it is clearly evident that increasing the concentration mainly increases the number density of PIC, while nearly unchanging the aggregation size.We then studied the copolymer concentration dependence of complexation kinetics. The dynamic curves of PIC formation at different total polymer concentrations are shown in Fig. 4, and the QDMA to PSSNa molar ratio is fixed at an equal ratio. Although the LLS and stopped-flow experiment detections have different time scales, the LLS experiments are carried out after the polyions have been mixed for hours while stopped-flow was recorded for the changes in the initial stage after the mixing, the final equilibrium scattering intensities obtained from the stopped-flow traces accord with the trend from LLS experiments, which increases almost linearly with concentration. It further indicates that the complexation process is fast, and the whole relaxation process reaches the final equilibrium state in 0.4 s. Thus, it is very suitable for investigating the complexation kinetics using a stopped-flow technique.
 | ||
| Fig. 4 Time dependence of the scattered light intensity obtained after stopped-flow mixing aqueous solutions of PEO-b-PQDMA and PEO-b-PSSNa at varying total polymer concentrations and a fixed [QDMA]/[SSNa] molar ratio of 1:1. | ||
All the dynamic curves in Fig. 4 can be well fitted with a double-exponential function (N = 2). Fig. S5 (ESI†) shows the burst phase scattering intensities as a function of total polymer concentration, which is obtained by reading the value after extrapolating the double exponential fitting curve to −2.6 ms, the dead time of the stopped flow. The burst phase scattered intensities increase linearly with the total polymer concentration. This implies that the first fast process is only associated with a very simple process, i.e., the formation of quasi-equilibrium mixed aggregates. The increase of the total concentration only increases the number density of these initially formed aggregates.
Double exponential-function fitting results versus the polymer concentration are shown in Fig. 5. Both characteristic kinetics coefficients, k1,obs and k2,obs, increase with polymer concentration. Bakeev and Kabanov et al.38 reported complexation kinetics studies of mixing oppositely charged linear PMANaPy and PEVPB, by luminescence quenching and laser light scattering techniques. They pointed out the complexation process consisting first of the rapid coupling of the oppositely charged polyions with the formation of a nonequilibrium interpolyelectrolyte network followed by a slow relaxation process, leading finally to the formation of the individual PICs. But they did not ascribe any relaxation mechanism to the two processes. Dormidontova et al.52–54 have theoretically studied the kinetics of micelle evolution of block copolymers from unimers toward the final equilibrium state; they proposed a micelle fusion–fission-unimer expulsion/entry joint mechanism for block copolymer micelle evolution.
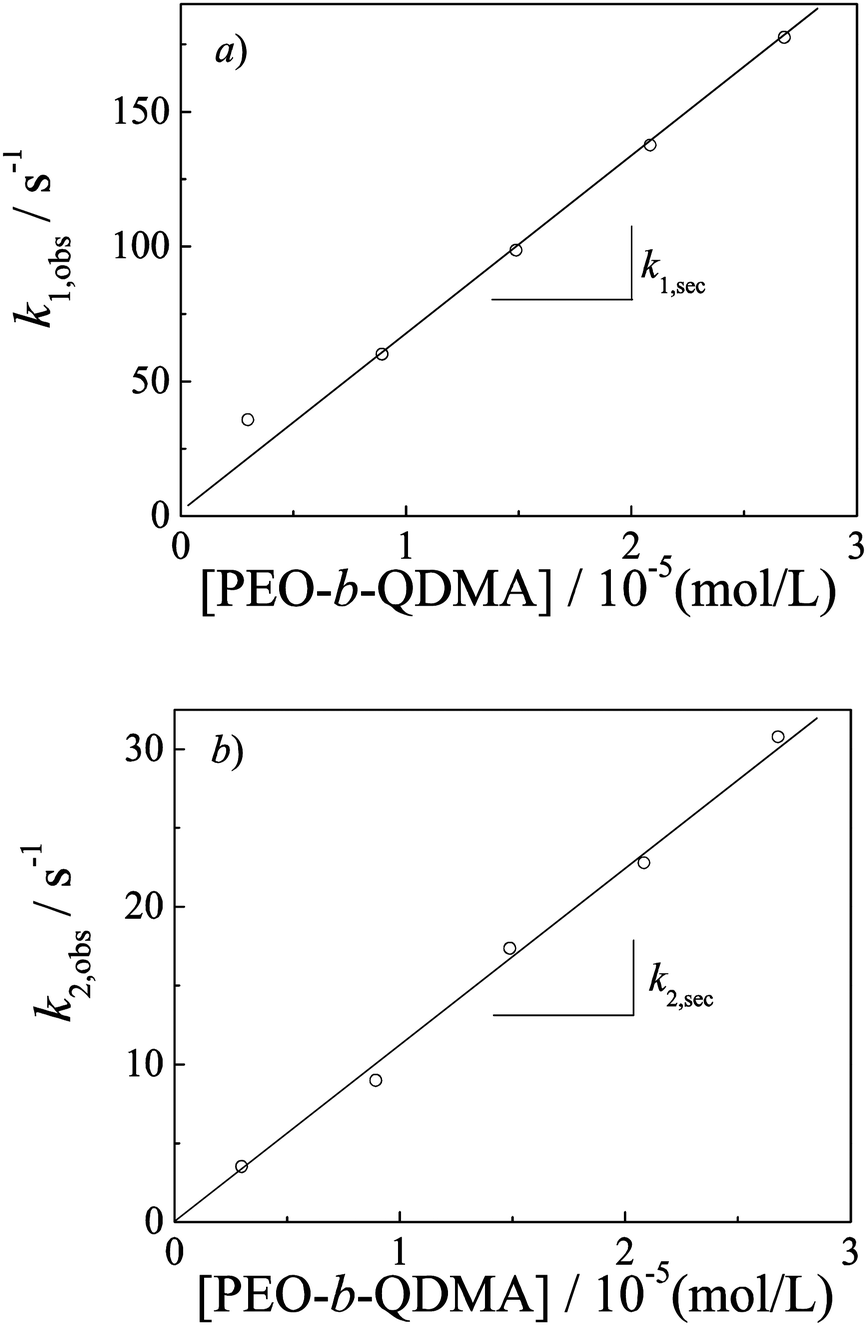 | ||
| Fig. 5 Double-exponential fitting results of kinetic traces obtained during the formation of PIC micelles as a function of PEO-b-QDMA concentrations. The experimental conditions were the same as those described in Fig. 4. | ||
The kinetics coefficient ki,obs can be translated to a time constant form via:
 | (4) |
 | (5) |
In the first process, polyion unimers quickly associate into large amounts of a small complex and then translate to quasi-equilibrium complexes. Unimer aggregating into small complexes is driven by electrostatic interactions and excess amounts of unimers; and the formation of small complexes with a low aggregation number practically does not involve any stretching of the soluble PEO blocks. Thus, association of unimers into small complexes is expected to be very quick, considering that the diffusion coefficient of unimer chains in aqueous solution is very high. The growth of small complexes into quasi-equilibrium complexes then proceeds via the micelle fusion–fission mechanism.54 The concentration dependence of k1,obs can then be easily understood as a second-order reaction.
After the formation of quasi-equilibrium complexes in the first fast process, unimer concentration is close to the cmc. The quasi-equilibrium complexes then translate to the final equilibrium complexes. Winnik and Tenhu et al.55 have reported the chain exchange kinetics between PIC micelles formed by mixing solutions of pyrene or naphthalene labeled PEO-b-PMANa block copolymers and PQDMA homo-polymer. The chain exchange was observed to occur via two mechanisms, unimer insertion–expulsion mechanism and PIC micelle fusion–fission mechanism. Based on the above analysis, the second slow process also proceed as a second-order reaction. We can conclude that rearrangement from quasi-equilibrium complexes to the final equilibrium complexes also proceeds through the micelle fusion–fission mechanism.
Winnik et al.56 reported the micellar exchange kinetics of aqueous micelles of Triton X-100 containing a pyrenebutyrate ester using stopped-flow fluorescence time-scan measurements. With a similar analysis approach, they found that kobs was linearly dependent on the concentration but did not pass through the origin, which led to a competitive first-order mechanism. In our cases, the nonzero intercept in the concentration dependent kobs cannot be found. Thus, the relaxation processes are purely controlled as second-order reactions and followed by a micelle fusion–fission mechanism.
Temperature dependence of complexation kinetics
We have also studied the influence of temperature on the PIC micellization process. Fig. 6 shows Arrhenius plots of the calculated second-order rate constant k2vs concentration dependence of ki,obs. This permits us to conclude that the activation energies were 10.6 and 4.6 kJ mol−1 for k1 and k2, respectively. Compared to the activation energies reported for the micellization of EnPmEn triblock copolymer57 and conventional surfactants,58 the relatively low activation energy is associated with a micelle formation–breakup process. It is further confirmed that the complexation kinetics proceed through a micelle fusion–fission mechanism. | ||
| Fig. 6 Arrhenius plots of k1,sec and k2,sec obtained from temperature-dependent kinetic studies of the formation of PIC micelles from PEO-b-PQDMA and PEO-b-PSSNa at [QDMA]/[SSNa] = 1:1. The total polymer concentration was fixed at 1.0 g L−1. | ||
The PIC micelles formation is explained as spontaneous, it is believed that the process is entropy drived. Schlenoff et al.59 have pointed out the idea that mixing polyelectrolyte complexes and multilayers is an entropy driven assembly. Before PIC micelles formation, polyelectrolyte unimer is solvated; and the formation of PIC micelles should destroy the ordered configuration of the solvent molecule. The reversion of a free water molecule causes entropy increase. On the other hand, unimer mobility is restricted by the water molecular network lattice in aqueous solution, and inside the PIC micelles core the polymer chain can move more freely, which should make a small contribution to the entropy change.
Salt effect on complexation kinetics
It is well known that the ionic strength greatly affects the complexation from oppositely charged polyions. We then further investigated the salt influence on the PIC micelles formation. Fig. S6 (ESI†) shows the variation of scattering intensity of PIC micelles as a function of added NaCl concentration. It can be seen that the scattered intensity changes slightly when the NaCl concentration is below 0.2 M. At low salt concentration, we can even observe a slight increase, this may be due to the salt out phenomenon or the changes of solvent properties which is caused by a small addition of molecular electrolyte. In general, the added salt will reduce the electrostatic interaction between polyions; and the reduction is not enough to cause PIC micelles to decompose when the salt concentration is below 0.2 M, while the PIC micelles disassemble gradually if the NaCl is higher than 0.2 M. Polyelectrolyte unimers diffuse out from the PIC micelles, with decreasing the aggregate number and hydrodynamic radius.The effects of ionic strength on the complexation kinetics were also studied. Fig. 7a shows the time dependence of the scattered intensity for the formation of PIC micelles in the presence of different NaCl concentrations. It reveals that the final equilibrium scattered intensities obtained decrease along with the added salt concentration. From the dynamic laser light scattering result (Fig. S6, ESI†), the PIC micelle size remains almost unchanged when NaCl concentration is below 0.2 M; the observed equilibrium scattered intensity decrease here can be explained in the following way. Detailedly examining the dynamic curves in Fig. 7a, it can be found that salt adding causes the relaxation process to slow down. When no small molecular electrolytes exist in the polymer aqueous solutions, the relaxation process quickly reaches its equilibrium within 0.4 s, while when adding salt to the polyelectrolyte aqueous solution, we can see a slightly increase trend even the dynamic curves have recorded for a 0.8 s time range. Once the salt concentration is higher than 0.2 M, the increased scattering intensity amplitudes are relatively smaller, indicating a loose and less aggregates PIC micelles formation. Moreover, we can hardly observe the amplitude increasing when the salt concentration reaches 1.0 M.
 | ||
| Fig. 7 (a) Time dependence of the scattered light intensity and (b) double-exponential fitting results of the kinetics traces obtained after stopped-flow mixing aqueous solutions of PEO-b-PQDMA and PEO-b-PSSNa at [QDMA]/[SSNa] = 1:1. Prior to mixing, all component polymer solutions contain varying concentrations of NaCl. From top to bottom, NaCl concentrations were 0, 0.02, 0.05, 0.08, 0.1, 0.15, 0.2, 0.3, 0.5, 0.7, and 1.0 M. | ||
The dynamic curves in Fig. 7a are fitted by double-exponential functions (N = 2). The resulted ki,obs are shown in Fig. 7b. The observed rate constants of the two processes both decrease in the presence of salt as compared to those without salt. This is probably due to the desolvation of the charged units. As mentioned above, the complexation is the entropy-driven process, thus, ΔS during the complexation would surely decrease if salination weakens. The driven force decreases, the relaxation processes should undoubtedly get slower. Interestingly, there is a transition of rate constants when the salt concentrations continue to increase. One can attribute the latter increasing trend mainly to the PIC micelles formed under high ionic strength possessing loose structures which would be formed much faster than the compact structures.
Stopped-flow fluorescence kinetics
During the first fast stage, polyion unimers quickly associate into large amounts of small complexes and then translate to quasi-equilibrium complexes. The small complexes possessing a low aggregation number are less sensitive to light scattering intensity, thus it is difficult to be confirmed via the light scattering technique. It is well-known that fluorescence spectroscopy is extremely sensitive as compared to LLS. So we further employed stopped-flow fluorescence to investigate the details of the relaxation process, especially for the first fast stage. Fig. 8 shows the time dependence of the fluorescence intensity ratios, I1/I3, of pyrene in polymer solutions for the formation of PIC micelles at equal [QDMA]/[PSSNa] molar ratio. It remains a straight line with time. Compared to pure polyelectrolyte solutions, the value was lower, which agrees with the results discussed in the steady-state fluorescence studies. As is well-known, the value of I1/I3 is sensitive to the polarity of its surrounding medium. The almost unchanged dynamic trace of I1/I3 most probably indicates that a hydrophobic micro-environment is formed very quickly, which is completed within the stopped-flow dead-time. This less polar region could result from the formation of small complexes. In the fast process, the formation of the small complexes is controlled by the diffusion coefficient of unimer chains in aqueous solution, which is very high. This may act as evidence of the presence of small complexes. | ||
| Fig. 8 Time dependence of pyrene fluorescence intensity ratios, I1/I3, (excited at 330 nm) obtained after stopped-flow mixing aqueous solutions of PEO-b-QDMA and PEO-b-PSSNa at [QDMA]/[SSNa] = 1:1. For comparison, reference kinetic traces upon stopped-flow mixing the aqueous solution of PEO-b-QDMA or PEO-b-PSSNa with a comparable amount of water (containing 1 × 10⁻⁶ mol L−1 pyrene) were also shown. All polymer solutions prior to mixing contain 1 × 10⁻⁶ mol L−1 pyrene. | ||
Polyelectrolyte complex dissociation kinetics
We have also studied the kinetics of PIC micelles to unimer transition. As discussed above, the PIC micelles gradually dissociate with the ionic strength increasing. Fig. S7 (ESI†) shows the dynamic traces upon mixing aqueous solutions of PIC micelles and NaCl with varying concentrations. Compared to complexation kinetics, the dissociation is much slower which would complete in a few seconds. Moreover, the dynamic traces all start from the same point, the whole processes can be clearly observed. It is reasonable that the polyion chain is desolved both in the complex core and high ionic strength. The kinetics curves in Fig. S7 (ESI†) can be well fitted by a single-exponential function (N = 1), the fitting results are shown in Fig. S8 (ESI†). Dissociation becomes speedier while the NaCl concentration increasing.To further comprehend the PIC micelles dissociation process, we also studied the concentration dependence. Fig. 9a shows the dissociation dynamic traces at varying PIC micelle concentrations. The kinetics curves were well fitted by a single-exponential function (N = 1) and the fitting results are shown in Fig. 9b. The kinetics coefficient kobs were linearly dependent to the concentrations, but did not pass through the origin. Thus, it is clear from these plots that the dissociation mechanism described by kobs consists of two competing processes: a second-order process (k2,d) with linear dependence on PIC micelle concentrations, and a first-order process (k1,d) with a rate independent of the PIC micelle concentrations. Different from the formation process of the PIC micelles which is followed by a second-order reaction, the dissociation process is followed by a joint mechanism consisting of both second-order and first-order reactions. Besides the micelle fusion–fission mechanism, the unimer insertion–expulsion mechanism plays an important role in the dissociation process.
 | ||
| Fig. 9 (a) Time dependence of the scattered light intensity and (b) single-exponential fitting results of the kinetics traces obtained after stopped-flow mixing equal volume of aqueous solutions of PIC micelles prepared at [QDMA]/[SSNa] = 1:1 and NaCl at a concentration of 2.0 M. The total polymer concentration of PIC micelles before mixing varied in the range of 0–0.16 g L−1. | ||
Conclusions
Soluble PIC micelles were formed from oppositely charged block polyions, PEO-b-PSSNa and PEO-b-PQDMA. Stopped-flow studies reveal that the complexation kinetic process consists of two continuous stages. The first fast relaxation process is related to the formation of small complexes and then the initial quasi-equilibrium complexes. And the second slow process is related to the quasi-equilibrium complexes rearranging to the final equilibrium PIC micelles. Both stages are determined to act as second-order reactions and proceeds through the micelle fusion–fission mechanism. Fluorescence kinetic studies provide evidence of the presence of small complexes with a low aggregation number which cannot be detected by a light scattering technique. Thermodynamics studies further confirm the micelle fusion–fission mechanism during the complexation process for its low active energy. Further discussion reveals that spontaneous complexation is an entropy driving process. In the presence of NaCl, the increasing solution ionic strength slows down the complexation process by decreasing ΔS. The PIC micelle dissociation process was further studied by addition of NaCl, and is considered to consist of two coexisting processes: a second-order process linearly depending on PIC micelle concentration followed by a micelle fusion–fission mechanism, and a first-order process independent of the PIC micelle concentration followed by a unimer insertion–expulsion mechanism.Acknowledgements
The financial support from National Natural Scientific Foundation of China (NNSFC) Project (21004001, 20674079, 51033005, 91027026, and 21274137), Foundation of Anhui Educational Committee Project (2011SQRL109ZD), Fundamental Research Funds for the Central Universities, and Specialized Research Fund for the Doctoral Program of Higher Education (SRFDP, 20123402130010) is gratefully acknowledged.References
- H. Colfen, Macromol. Rapid Commun., 2001, 22, 219–252 CrossRef CAS.
- J. Rodriguez-Hernandez and S. Lecommandoux, J. Am. Chem. Soc., 2005, 127, 2026–2027 CrossRef CAS PubMed.
- X. Andre, M. F. Zhang and A. H. E. Muller, Macromol. Rapid Commun., 2005, 26, 558–563 CrossRef CAS.
- S. Dai, P. Ravi, K. C. Tam, B. W. Mao and L. H. Gang, Langmuir, 2003, 19, 5175–5177 CrossRef CAS.
- V. Butun, S. Liu, J. V. M. Weaver, X. Bories-Azeau, Y. Cai and S. P. Armes, React. Funct. Polym., 2006, 66, 157–165 CrossRef PubMed.
- J. F. Gohy, Adv. Polym. Sci., 2005, 190, 65–136 CrossRef CAS.
- G. Riess, Prog. Polym. Sci., 2003, 28, 1107–1170 CrossRef CAS.
- C. Cheng, H. Wei, B. X. Shi, H. Cheng, C. Li, Z. W. Gu, S. X. Cheng, X. Z. Zhang and R. X. Zhuo, Biomaterials, 2008, 29, 497–505 CrossRef CAS PubMed.
- G. Pasparakis and C. Alexander, Angew. Chem., Int. Ed., 2008, 47, 4847–4850 CrossRef CAS PubMed.
- H. C. Shum, J.-W. Kim and D. A. Weitz, J. Am. Chem. Soc., 2008, 130, 9543–9549 CrossRef CAS PubMed.
- I. K. Voets, A. de Keizer and M. A. C. Stuart, Adv. Colloid Interface Sci., 2009, 147–148, 300–318 CrossRef CAS PubMed.
- R. J. Amir, S. Zhong, D. J. Pochan and C. J. Hawker, J. Am. Chem. Soc., 2009, 131, 13949–13951 CrossRef CAS PubMed.
- B. K. Sourkohi, A. Cunningham, Q. Zhang and J. K. Oh, Biomacromolecules, 2011, 12, 3819–3825 CrossRef PubMed.
- J. Stadermann, H. Komber, M. Erber, F. Daebritz, H. Ritter and B. Voit, Macromolecules, 2011, 44, 3250–3259 CrossRef CAS.
- L. M. Bronstein, S. N. Sidorov, V. Zhirov, D. Zhirov, Y. A. Kabachii, S. Y. Kochev, P. M. Valetsky, B. Stein, O. I. Kiseleva, S. N. Polyakov, E. V. Shtykova, E. V. Nikulina, D. I. Svergun and A. R. Khokhlov, J. Phys. Chem. B, 2005, 109, 18786–18798 CrossRef CAS PubMed.
- J. F. Gohy, S. K. Varshney, S. Antoun and R. Jerome, Macromolecules, 2000, 33, 9298–9305 CrossRef CAS.
- Z. J. Hu, A. M. Jonas, S. K. Varshney and J. F. Gohy, J. Am. Chem. Soc., 2005, 127, 6526–6527 CrossRef CAS PubMed.
- A. Harada and K. Kataoka, Macromolecules, 1995, 28, 5294–5299 CrossRef CAS.
- A. V. Kabanov, S. V. Vinogradov, Y. G. Suzdaltseva and V. Y. Alakhov, Bioconjugate Chem., 1995, 6, 639–643 CrossRef CAS.
- S. Vinogradov, E. Batrakova, S. Li and A. Kabanov, Bioconjugate Chem., 1999, 10, 851–860 CrossRef CAS PubMed.
- A. Harada and K. Kataoka, J. Controlled Release, 2001, 72, 85–91 CrossRef CAS.
- A. Harada and K. Kataoka, Macromolecules, 1998, 31, 288–294 CrossRef CAS.
- V. A. Kabanov, Russ. Chem. Rev., 2005, 74, 3–20 CrossRef CAS PubMed.
- S. Lindhoud and M. A. C. Stuart, Adv. Polym. Sci., Verlag Berlin, Heidelberg, Editon edn, 2012 Search PubMed.
- N. Nishiyama and K. Kataoka, Adv. Polym. Sci., 2006, 193, 67–101 CrossRef CAS.
- A. V. Kabanov, T. K. Bronich, V. A. Kabanov, K. Yu and A. Eisenberg, Macromolecules, 1996, 29, 6797–6802 CrossRef CAS.
- Y. Kakizawa and K. Kataoka, Adv. Drug Delivery Rev., 2002, 54, 203–222 CrossRef CAS.
- M. Jaturanpinyo, A. Harada, X. F. Yuan and K. Kataoka, Bioconjugate Chem., 2004, 15, 344–348 CrossRef CAS PubMed.
- A. Harada and K. Kataoka, J. Am. Chem. Soc., 2003, 125, 15306–15307 CrossRef CAS PubMed.
- A. Harada and K. Kataoka, J. Am. Chem. Soc., 1999, 121, 9241–9242 CrossRef CAS.
- B. Bednar, H. Morawetz and J. A. Shafer, Macromolecules, 1984, 17, 1634–1636 CrossRef CAS.
- H. L. Chen and H. Morawetz, Macromolecules, 1982, 15, 1445–1447 CrossRef CAS.
- Y. Morishima, Chin. J. Polym. Sci., 2000, 18, 323–336 CAS.
- M. A. C. Stuart, N. A. M. Besseling and R. G. Fokkink, Langmuir, 1998, 14, 6846–6849 CrossRef CAS.
- S. Lindhoud, W. Norde and M. A. C. Stuart, J. Phys. Chem. B, 2009, 113, 5431–5439 CrossRef CAS PubMed.
- F. Bosse and A. Eisenberg, Macromolecules, 1994, 27, 2846–2852 CrossRef CAS.
- F. Bosse and A. Eisenberg, Macromolecules, 1994, 27, 2853–2863 CrossRef CAS.
- K. N. Bakeev, V. A. Izumrudov, S. I. Kuchanov, A. B. Zezin and V. A. Kabanov, Macromolecules, 1992, 25, 4249–4254 CrossRef CAS.
- P. S. Chelushkin, E. A. Lysenko, T. K. Bronich, A. Eisenberg, V. A. Kabanov and A. V. Kabanov, J. Phys. Chem. B, 2008, 112, 7732–7738 CrossRef CAS PubMed.
- M. Iijima, Y. Nagasaki, T. Okada, M. Kato and K. Kataoka, Macromolecules, 1999, 32, 1140–1146 CrossRef CAS.
- S. Z. Luo, S. Y. Liu, J. Xu, H. Liu, Z. Y. Zhu, M. Jiang and C. Wu, Macromolecules, 2006, 39, 4517–4525 CrossRef CAS.
- X. Jiang, S. Luo, S. P. Armes, W. Shi and S. Liu, Macromolecules, 2006, 39, 5987–5994 CrossRef CAS.
- S. Y. Liu, J. V. M. Weaver, Y. Q. Tang, N. C. Billingham, S. P. Armes and K. Tribe, Macromolecules, 2002, 35, 6121–6131 CrossRef CAS.
- V. Butun, S. P. Armes and N. C. Billingham, Macromolecules, 2001, 34, 1148–1159 CrossRef.
- C. K. Choi and Y. B. Kim, Polym. Bull., 2003, 49, 433–439 CrossRef CAS PubMed.
- S. van der Burgh, A. de Keizer and M. A. C. Stuart, Langmuir, 2004, 20, 1073–1084 CrossRef CAS.
- A. Mezei, R. Meszaros, I. Varga and T. Gilanyi, Langmuir, 2007, 23, 4237–4247 CrossRef CAS PubMed.
- J. Zhang, J. Xu and S. Liu, J. Phys. Chem. B, 2008, 112, 11284–11291 CrossRef CAS PubMed.
- K. Kalyanasundaram and J. K. Thomas, J. Am. Chem. Soc., 1977, 99, 2039–2044 CrossRef CAS.
- W. Chen, C. J. Durning and N. J. Turro, Macromolecules, 1999, 32, 4151–4153 CrossRef CAS.
- Z. Y. Zhu, S. P. Armes and S. Y. Liu, Macromolecules, 2005, 38, 9803–9812 CrossRef CAS.
- F. J. Esselink, E. E. Dormidontova and G. Hadziioannou, Macromolecules, 1998, 31, 4873–4878 CrossRef CAS PubMed.
- F. J. Esselink, E. Dormidontova and G. Hadziioannou, Macromolecules, 1998, 31, 2925–2932 CrossRef CAS.
- E. E. Dormidontova, Macromolecules, 1999, 32, 7630–7644 CrossRef CAS.
- S. Holappa, L. Kantonen, T. Andersson, F. Winnik and H. Tenhu, Langmuir, 2005, 21, 11431–11438 CrossRef CAS PubMed.
- Y. Rharbi, M. Li, M. A. Winnik and K. G. Hahn, J. Am. Chem. Soc., 2000, 122, 6242–6251 CrossRef CAS.
- B. Michels, G. Waton and R. Zana, Langmuir, 1997, 13, 3111–3118 CrossRef CAS.
- C. Tondre and R. Zana, J. Colloid Interface Sci., 1978, 66, 544–558 CrossRef CAS.
- C. B. Bucur, Z. Sui and J. B. Schlenoff, J. Am. Chem. Soc., 2006, 128, 13690–13691 CrossRef CAS PubMed.
Footnote |
| † Electronic supplementary information (ESI) available: Additional figures as described in the text. See DOI: 10.1039/c3cp53608d |
| This journal is © the Owner Societies 2014 |