Structure stability and high-temperature distortion resistance of trilayer complexes formed from graphenes and boron nitride nanosheets
Jianhui
Yuan
ab and
K. M.
Liew
*b
aSchool of Physics and Electronic Science, Changsha University of Science and Technology, Changsha 410114, China
bDepartment of Civil and Architectural Engineering, City University of Hong Kong, Tat Chee Avenue, Kowloon, Hong Kong SAR. E-mail: kmliew@cityu.edu.hk; Tel: +852 3442 7601
First published on 29th October 2013
Abstract
The molecular dynamics was employed to study the structure stability and high-temperature distortion resistance of a trilayer complex formed by a monolayer graphene sandwiched in bilayer boron nitride nanosheets (BN–G–BN) and graphenes (G–G–G). The investigation shows that the optimal interlayer distances are about 0.347 nm for BN–G–BN and 0.341 nm for G–G–G. Analysis and comparison of the binding energy, van der Waals interactions between layers and radial distribution function (RDF) revealed that the BN–G–BN achieves a more stable combined structure than G–G–G. The interlayer graphene in the trilayer complex nanosheets, especially the graphene in BN–G–BN, is more integrated than monolayer graphenes in a crystal structure. The structures at high temperature of 1500 K show that the BN–G–BN exhibits less distortion than G–G–G; especially, fixing the atomic positions on up–down layers can obviously further reduce structural deformation of interlayer graphene. The result further indicates that the high-temperature distortion resistance of interlayer graphene in the trilayer complex is related to both material type and conditions of constraints at the up–down layers.
1. Introduction
Two-dimensional (2D) nanosheets, which possess atomic or molecular thickness and infinite planar dimensions, are regarded as the thinnest functional nanomaterials. Recent advances in various delamination techniques have produced 2D nanosheets of various materials, including graphene,1,2 boron nitride3,4 and metal oxides,5etc. Graphene, with sheets consisting of fewer than 10 stacked layers of sp2-hybridised carbon lattices,2 has been a subject of extensive experimental and theoretical investigations due to its remarkable properties and novel potential applications.2,6,7 Moreover, graphene has obvious advantages compared with carbon nanotubes when used in polymeric composites.8,9 These interesting studies have triggered interest in the 2D-ordered crystals of elements other than carbon, such as transition metal dichalcogenides and perovskites, among others.10–13 However, graphene is a conductor and electronic technology always requires insulators, which are essential for several devices, such as memories, capacitors and gate dielectrics.Similar to graphene, a hexagonal boron nitride (h-BN) monolayer composed of alternate boron and nitrogen atoms in a honeycomb arrangement has also attracted enormous attention14,15 as a potential material for nanoscale electronics applications16 because of its enhanced chemical, thermal and mechanical stability. BN has comprehensive applications because of its many unmatched properties. For example, h-BN is frequently used as a solid lubricant in rigorous environments as an ultraviolet-light emitter14,17 or as an insulating thermoconductive filler in composites.18 A 2D-ordered BN crystal structure with an exposed (002) crystal surface is valuable in exploiting the many unique properties of a graphitic-like (002) plane, such as superb high thermal conductivity, mechanical strength and others. In addition, a BN nanosheet (BNNS) is a unique insulating 2D system that has been seldom explored. BNNSs have recently come under the spotlight because of potential for use in a range of applications.19 Pacile et al.20 first reported the synthesis of 2D BN nanostructures and Han et al.21 fabricated double and monolayer BN sheets. Compared with graphene, BNNSs have remained much less explored.22 However, this does not imply that BNNSs have been ignored and/or underestimated relative to graphene. BNNSs have distinct properties and advantages compared with graphene. For example, BNNSs are electrical insulators (a band gap of ∼5 eV to 6 eV),23,24 have profound chemical and thermal stability25,26 and at the same time, are as thermally conductive and mechanically robust as graphene.
Recently, several experimental studies have reported deposition of graphene–BN hybrid systems. Dean et al.27 have studied fabrication and characterisation of high-quality exfoliated mono- and bilayer graphene devices on single-crystal h-BN substrates, by using a mechanical transfer process. Liu et al.28 have reported on chemical vapor deposition (CVD) of h-BN on graphene. The fabricated graphene–BN films have thickness of about two to a few monolayers. Tang et al.29 have found the direct graphene growth on exfoliated h-BN single crystal flakes by low pressure CVD. Very recently, Britnell et al.30 reported fabrication of a graphene-based device in which up to 30 layers of h-BN were sandwiched between two graphene monolayers. Such vertical graphene heterostructures were shown to act as effective field-effect tunneling transistors with a room temperature switching ratio of about 50 (ref. 30). Theoretical calculations have shown the dependence of the band gap on the number of h-BN layers in a bilayer-graphene/several-layers BN system.31 Gorbachev et al.32 have found strong coulomb drag in bilayer graphenes and constructed a nanoscale electric transformer by assembling the graphene and BN into a multilayer cake in a desired sequence.
To date, many theoretical and experimental studies on bilayer graphenes and BNNSs have been done and some of the conclusions have been useful in engineering applications.33–35 However, studies on trilayer systems seem to have been quite sparse. Because of their possible applications in nano-electronic devices, trilayer systems have been the subject of several recent studies. The trilayer graphene system exhibits stacking-dependent electronic properties under the influence of a perpendicular electric field, with the semiconducting ABC stacked trilayer showing a large tunable gap relative to the metallic ABA stacked trilayer.36–38 While monolayer graphene keeps its gapless feature in the presence of a perpendicular electric field, a BN–graphene–BN trilayer system shows stacking-dependent energy gap tenability.39,40 However, there are no research materials about structural stability, especially at high-temperature, of the trilayer graphene and BN–graphene–BN systems in open field.
To take full advantage of structural performance of the multilayer architecture in any environment, we have reported the structural stability and elastic properties of monolayer and bilayer carbon nanotubes, graphene and BN nanotubes (nanosheets).41–45 In this study, we further investigate the trilayer architecture based on these studies. This paper mainly studies the trilayer complex formed by a monolayer graphene sandwiched in bilayer graphenes and boron nitride nanosheets (G–G–G and BN–G–BN). The optimal interlayer distances, differences in structural stability and high-temperature distortion resistance of trilayer G–G–G and BN–G–BN nanosheets are investigated by analysing their system energies and radial distribution function (RDF), etc. The results demonstrate that the BN–G–BN can achieve a more stable combined structure than G–G–G; the high temperature deformation resistance of BN–G–BN is inferior to G–G–G and constraints on up–down layers can bring better protective effects of interlayer graphene.
2. Calculation model and method
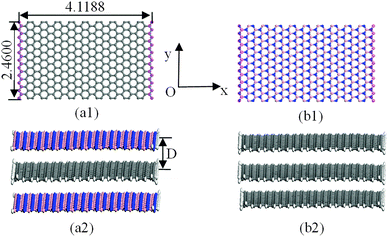
The structural models for graphenes and BNNSs were set up according to atomic space coordinates. The nanosheets in this study can be achieved using 20 and 10 repeat basic units in length and width using Materials Studio software. The corresponding sizes were 4.1188 nm and 2.4600 nm, as shown in Fig. 1(a1) and (b1). The trilayer BN–G–BN and G–G–G complex nanosheets were constructed through the parallel setting of a monolayer graphene sandwiched in bilayer BNNSs and graphenes with different interlayer distances. Dangling bonds existed at atoms around the borders of nanosheets considered more active. Some hydrogen atoms were used as auto-update links of the boundary of the nanosheets to achieve electron saturation, as shown in Fig. 1(a2) and (b2). To minimize the size effect of the structures on the structural stability, periodic structural units are then built by setting the obtained trilayer BN–G–BN and G–G–G in a cuboid crystal lattice. One end of the complex nanosheets is located on plane xy and the other end is located on the opposite planes, the layered planes of the interlayer graphene are parallel to the crystal lattice axis z and pass the two centers of the planes that are face to face. To minimize the impact between trilayer complex nanosheets, the lattice parameters, which are much larger than the interlayer distances of the nanosheets, are set to a = b = 100 × 10−10 m.46 Finally, the structures were optimised and the related structural properties were calculated using the universal force field (UFF)47 in Materials Studio software.The UFF, a molecular mechanics force field, is where the force field parameters are estimated using general rules based only on the element, its hybridisation and its connectivity. The potential energy of the UFF is expressed as the sum of bonded and non-bonded interactions.
| ET = ER + Eθ + Eτ + Eω + Ev + Eel. | (1) |
The bonded interactions include the bond stretching Eb, the angle bending Eθ, the dihedral angle torsion Eτ, and the inversion terms Eω, whereas non-bonded interactions include the van der Waals interaction Ev and the electrostatic interaction Eel. The UFF includes a parameter generator that calculates force field parameters by combining atomic parameters. Thus parameters for any combination of force field types can be generated as required. For further details, including the generator equations, see ref. 47–50.
3. Results and discussion
3.1. Structural stability of trilayer nanosheets
The stability of trilayer nanosheets is determined primarily by the interaction between the layers. Fig. 2 shows the calculated total potential energy (ET) and van der Waals energy (Ev) of trilayer nanosheets BN–G–BN and G–G–G with different interlayer distances. The two types of energy decrease rapidly to a minimum value and then increase slowly with increasing interlayer distance. This result indicates that the repulsion interaction force between nanosheets increases very steeply as two nanosheets approach each other closely. At slightly greater distances, any two nanosheets will experience a weak attractive force, known as a van der Waals attraction. As a result, there is a distance at which repulsive and attractive forces precisely balance to produce an energy minimum. Structures of the interlayer distances corresponding to the minimum energy are more stable. During this state, forces of attraction between layers balance the repulsive forces. The optimal space between the layers for the BN–G–BN and G–G–G is about 0.347 and 0.341 nm, respectively, as shown in Fig. 2 and Table 1. These values are within the distance of 0.33 nm to 0.36 nm between the graphite and h-BN layers.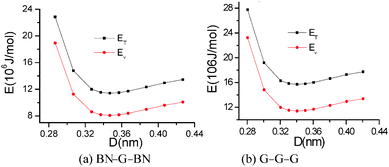 | ||
| Fig. 2 Total potential energy and van der Waals energy of trilayer nanosheets as a function of interlayer distance. | ||
| Complex | D (nm) | E T | E v | E R | E θ | E τ |
|---|---|---|---|---|---|---|
| BN–G–BN | 0.346962 | 11.42095 | 8.08154 | 2.47257 | 0.79079 | 0.0747 |
| G–G–G | 0.34048375 | 15.71153 | 11.40182 | 3.56959 | 0.41499 | 0.32171 |
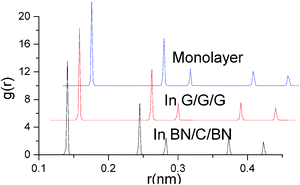
Structural properties of monolayer graphene and interlayer graphenes in BN–G–BN and G–G–G are precisely analysed using the radial distribution functions (RDF) (Fig. 3 and Table 2).51 RDF is a useful tool for describing the structure of a system. A number of sharp peaks, separations and heights, all of which are characteristics of a lattice structure, are exhibited by a solid. In the RDF of nanosheets, the peak locations (abscissa values) correspond to the first neighbor, second neighbor, and other neighbor distances between the atoms of the hexagonal atomic ring on the plane sheet. In general, the full width at half maximum (FWHM) of an RDF is closely related to the integrity of the crystal structure. The more integrated the structure is, the sharper the RDF peaks are, and the smaller the FWHM is, and vice versa. Table 2 shows that the first three main peak positions are about 0.141, 0.245 and 0.283 nm, and the values do not change with the environment of graphenes, while their peak distribution may be something different. Compared with monolayer graphene under free conditions, FWHMs for interlayer graphenes in BN–G–BN and in G–G–G slightly narrow down. The FWHMs of the first three main peaks are 0.00231, 0.00201 and 0.00255 nm, narrowing by 0.00027, 0.0002 and 0.00002 nm, respectively, for graphenes in G–G–G and 0.00221, 0.00184 and 0.00255 nm, narrowing by 0.00037, 0.00037 and 0.00002 nm, respectively, for graphenes in BN–G–BN. These data can be attributed to the original differences between bond lengths of B–N and C–C in the hexagonal atomic ring of nanosheets. The results for main peak positions indicate that the neighbouring atomic distances at all levels in the hexagonal atomic ring on nanosheets are little different, and the configuration displays less deviation between the interlayer graphenes in trilayer complex nanosheets and monolayer graphenes. However, the FWHMs are somewhat different; FWHMs of interlayer graphenes in the trilayer system are always less than monolayer graphenes, suggesting that the neighbouring atomic distances for the same level grow more concentrated. The result indicates that the interlayer graphene in trilayer complex nanosheets may be more integrated in crystal structure than monolayer graphenes, especially the graphene in BN–G–BN.
| Graphene | First peak | Second peak | Third peak | |||
|---|---|---|---|---|---|---|
| Location | FWHM | Location | FWHM | Location | FWHM | |
| Monolayer | 0.141 | 0.00258 | 0.245 | 0.00221 | 0.283 | 0.00257 |
| In G–G–G | 0.141 | 0.00231 | 0.245 | 0.00201 | 0.283 | 0.00255 |
| In BN–G–BN | 0.141 | 0.00221 | 0.245 | 0.00184 | 0.283 | 0.00255 |
To further compare the structural stability of trilayer complex BN–G–BN and G–G–G, binding energies EB, interaction energy Ei and the van der Waals energies Eiv between nanosheets are calculated according to the following formula:
 | (2) |
 | (3) |
 | (4) |
 represents the sum of all nanosheets in complex structures. The calculation results are shown in Tables 3 and 4.
| Complex | BN–G–BN | G–G–G | ||
|---|---|---|---|---|
| Location | Up (down) layer | Middle layer | Up (down) layer | Middle layer |
| E n | 5.20149 | 7.26364 | 7.26019 | 7.26178 |
| E nv | 4.24088 | 5.84545 | 5.80947 | 5.85349 |
E B is the energy change when three free-individual, monolayer graphenes or BNNSs are bound together as trilayer nanosheets. The positive energy results in endothermic processes, and the negative energy results in exothermic processes. As shown in Table 4, EB, Ei and Eiv are all negative and the absolute values for BN–G–BN are all higher than G–G–G. Therefore, the heat of the exothermic process for BN–G–BN is larger, suggesting that its integrating force is strong. Thus, BN–G–BN may be more stable than G–G–G. In addition, the difference between Ei and EB reflects the energy loss caused by deformation of the graphene and BNNT when the free graphenes and free BNNTs are bound together as a BN–G–BN or G–G–G.43 It is easy to see (Table 4) that the differences are −0.00599 × 10⁶ J mol−1 for BN–G–BN and 0.00345 × 10⁶ J mol−1 for G–G–G. This can be interpreted as part of the energy released during the formation of G–G–G is transformed into bonded energy, which results in augmentation of Ei, so the deformation of BN–G–BN may be smaller than that of G–G–G. In the formation of the BN–G–BN and G–G–G systems, the energy change derives mainly from the interaction force between molecules, and the effect of deformation on the energy change is slight. A comparison of Ei and Eiv (Table 4) shows that the difference is very small. The Ei and Eiv for BN–G–BN are exactly the same, while those for G–G–G are a little different, suggesting that the effect of combining three nanosheets into BN–G–BN on the electronic structures or chemical bonding should at least be not over G–G–G. Furthermore, it can thus be concluded that the interaction between the layers for the trilayer sandwich complex is a typical van der Waals interaction.
3.2. High-temperature distortion resistance of trilayer nanosheets
High temperature deformation is an important aspect of structural stability. In addition, graphene and its composite structures are also likely find applications in high-temperature environments. In order to know the high-temperature structural stability of graphenes in trilayer nanosheets, structural performances of the BN–G–BN and G–G–G, when subjected to high temperature, are simulated and analysed through molecular dynamics simulations. Fig. 4 shows the overall appearance of the BN–G–BN and G–G–G for two different conditions (fixed and no fixed atomic positions on the up–down layers) at temperature of 1500 K. Among them, Fig. 4(a1) and (b1) represent BN–G–BN and G–G–G after fixing the atomic positions on up–down layers, respectively. Fig. 4(a2) and (b2) represent BN–G–BN and G–G–G with no constraint, respectively. Because the difference at lower temperature is not large enough to clearly describe, a higher temperature (1500 K) is selected in this paper. It is evident that the structural deformation in Fig. 4(b1) and (b2) is obviously greater than that in Fig. 4(a1) and (a2). In the former, some areas of the structures exhibit some chaos in bond orders and obvious distortions, even the plane torsion relative to the up–down layer position, whereas those in the latter display only slight chaos in bond orders and no obvious distortions. The interlayer is in basic alignment with up–down layers. This illustrates that the BN–G–BN always exhibits less distortion than G–G–G. At the same time, through comparisons in Fig. 4(a1) and (a2) or Fig. 4(b1) and (b2), it can be found that structural deformation of the interlayer graphenes in trilayer nanosheets is less when they have fixed atomic positions on up–down layers. The result demonstrates that the high temperature deformation resistance of BN–G–BN is inferior to G–G–G and fixing the atomic positions on up–down layers has better protective effects that improve the distortion-resistance of the interlayer graphene at high temperature. The result also shows that the degree of the interlayer graphene distortion is related to both the material type of the up–down layers and the conditions of constraints at the up–down layers.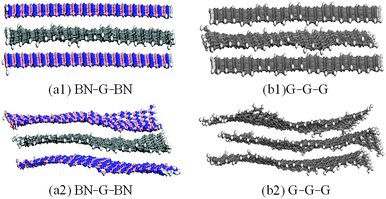 | ||
| Fig. 4 Configuration of BN–G–BN and G–G–G with constraint (a1 and b1) and no constraint (a2 and b2) at a temperature of 1500 K. | ||
To quantitatively analyse thermostability, RDF parameters of the interlayer graphene in G–G–G and BN–G–BN at temperature of 1500 K are calculated, as shown in Fig. 5 (Table 5). The results show that the first three main peak positions are about 0.141, 0.243 and 0.281 nm when there is a constraint applied on the up–down layers, and 0.143, 0.247 and 0.281 nm when there is no constraint. It can be seen that the positions of first and second peaks grew larger while the position of the third peak basically remained unchanged as the constraints were removed. It is found that the main peak positions have no clear dependent relationship to the material types of the up–down layers and are mainly dependent on the constraint of the up–down layers. The results indicate that the distance between the first and second neighbouring atoms in the hexagonal atomic ring on the graphene grows greater, whereas there is little change in that between the third neighbouring atoms, with removal of the constraints. Further, by comparing their FWHMs from Fig. 5 (Table 5), it is discovered that the RDF peak distributions of the graphene are more sensitive to surroundings. In the free-boundary case, FWHMs of the highest peaks for BN–G–BN and G–G–G are 0.01134 and 0.01331 nm, respectively. Obviously, the former's FWHM is smaller than the latter's, indicating that the interlayer graphene in BN–G–BN has better crystal structure resulting in better resistance to deformation at high temperature. In particular, when the atomic coordinates on the up–down layers are fixed, distributions further narrow. FWHM of the highest peak for BN–G–BN decreases from 0.01134 to 0.00981 nm and that for G–G–G decreases from 0.01331 to 0.01041 nm. FWHMs of second and third peaks have also a similar trend. According to the crystal structure theory, the smaller FWHM means smaller deviation in the distance and better crystallinity. In terms of the graphene, the smaller FWHM means that the neighbouring atomic distances grow more concentrated for the same level in the hexagonal atomic ring on nanosheets. By comparing and analysing the results, it is easy to see that at a high temperature, structural integrity of interlayer graphene is affected by both the material type and boundary constraints of the up–down layers. Consequently, synthesis of results suggests that the four trilayer nanosheets in which the interlayer graphene has suffered different magnitudes of deformation, in a descending order, are free G–G–G, free BN–G–BN, restrained G–G–G and restrained BN–G–BN, and the interlayer graphene in BN–G–BN with restrained boundary has the highest resistance to distortion upon exposure to high heat and remains relatively stable. The RDF quantitative analysis result is basically consistent with the above-mentioned geometric shapes.
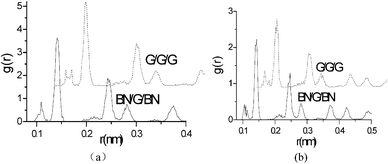 | ||
| Fig. 5 RDF of the interlayer graphene in G–G–G and BN–G–BN at a temperature of 1500 K: (a) fixing the atomic coordinates on the up–down layers; (b) no constraint. | ||
| Up–down layers | Materials | First peak | Second peak | Third peak | |||
|---|---|---|---|---|---|---|---|
| Location | FWHM | Location | FWHM | Location | FWHM | ||
| Restrained | BN–G–BN | 0.141 | 0.00981 | 0.243 | 0.01382 | 0.281 | 0.01276 |
| G–G–G | 0.141 | 0.01041 | 0.243 | 0.01392 | 0.281 | 0.01523 | |
| No constraint | BN–G–BN | 0.143 | 0.01134 | 0.247 | 0.01331 | 0.281 | 0.0138 |
| G–G–G | 0.143 | 0.01331 | 0.247 | 0.01627 | 0.281 | 0.01677 | |
To understand the differences between G–G–G and BN–G–BN, the deformation electron density and its isoline structure are further calculated and analyzed by DFT. Fig. 6 shows the deformation electron density and its isoline structure by simulating the G–G–G and BN–G–BN model. The electron density is the same as the online equivalent and it gradually becomes smaller on the vertical isolines from the inside outward. The isoline intervals reflect the local electronic conditions in that the greater the interval, the weaker is the localization and the more are the free electrons, and vice versa. As shown in Fig. 6(a1) and (b1), the outer-layer electrons for BNNSs are obviously partial to the N atom in the B–N bond. However, for graphenes, the electrons are more concentrated at the center of the C–C bond. The outer-layer electrons are the main cause of the covalent bond. If the outer-layer electrons spend most of their time within the nuclei of the two atoms, then the covalent bond is placed in the bonding orbital, in which case the distribution of the electron density is small at either end and large in the middle. In contrast, if the electrons spend most of their time outside the nuclei of the two atoms, then the covalent bond is placed in the antibonding orbital, in which case the distribution of the electron density is large at both ends and small in the middle. This is because in the bonding orbital electron density between the nuclei increases whereas in the antibonding orbital it decreases. Placing an electron in the bonding orbital stabilizes the molecule because it remains in between the two nuclei. Conversely, placing electrons in the antibonding orbital causes a decrease in stability.52 The deformation electron density plot in Fig. 6 shows that each layer of graphenes in G–G–G has a good bonding electronic distribution that is small at each end and large in the middle. The electrons are mainly uniformly distributed along the atoms in rings on the plane and there are fewer electrons in the out-plane (see Fig. 6(a2)), resulting in weak interaction between up–down neighboring nanosheets for G–G–G. However, the situation for BN–G–BN is somewhat different. Because the different kinds of atoms exist between up–down nanosheets and the polar covalent bond exists in the B–N bond, electronegativity becomes a dominant factor. The electronic localization of the inner layer may be weakened, some s electrons become p electrons due to excitation and partial electronic delocalization of the outer shell occurs, which results in an increase in electron mobility. Consequently, there are more electrons between up–down neighboring nanosheets (see Fig. 6(b2)), showing a long range attraction between up–down neighboring nanosheets. Obviously, the stronger atomistic interaction between BN/G should be greater than that between G/G, naturally resulting in the high temperature deformation resistance of BN–G–BN is inferior to G–G–G. In the meantime, this also explains, more intuitively, that the structural stability of the trilayer BN–G–BN is higher than that of the G–G–G from another angle.
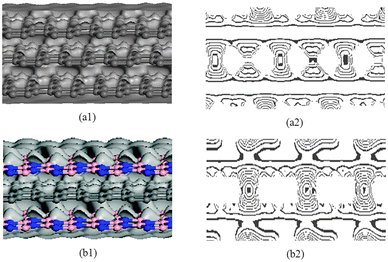 | ||
| Fig. 6 Deformation electron density (left) and isoline structure (right) on cross section of G–G–G (a1 and a2) and BN–G–BN (b1 and b2). | ||
4. Conclusions
By calculating the total potential energy and van der Waals energy of the trilayer coupled structures with different interlayer spacings, the optimal interlayer distances of trilayer BN–G–BN and G–G–G were determined to be about 0.347 and 0.341 nm, respectively. Comparison of the binding energy, van der Waals interaction between nanosheets for stable structure shows that structural stability of the trilayer BN–G–BN is higher than that of the G–G–G. Further analysis of RDF indicates that the interlayer graphene in trilayer complex nanosheets may be more integrated in crystal structure than monolayer graphenes, especially the graphene in BN–G–BN. Geometric structures of the trilayer BN–G–BN and G–G–G at a high temperature of 1500 K show that the interlayer graphene always exhibit less distortion in BN–G–BN than in G–G–G, especially in the case of fixing the atomic positions on up–down layers. The result demonstrates that the high temperature deformation resistance of BN–G–BN is inferior to G–G–G and fixed atomic positions on up–down layers have better protective effects that improve the distortion-resistance of the graphene at high temperature. The result also indicates that the high-temperature distortion resistance of interlayer graphene distortion is related to both the material type of the up–down layers and the conditions of constraints at the up–down layers. The results can provide reference for theoretical research and practical applications of the trilayer coupled complex with graphenes and BNNSs.Acknowledgements
The work described in this paper was fully supported by grants from the Research Grants Council of the Hong Kong Special Administrative Region, China (Project No. 9041674, CityU 118411) and the China National Natural Science Foundation (Grant No. 11172253). The work was also supported by Scientific Research Fund of Hunan Provincial Education Department, China (Project No. 12A001), Hunan Provincial Natural Science Foundation of China (Project No. 14JJ2076), the Construct Program of the Key Discipline in Hunan Province and Aid Program for Science and the Technology Innovative Research Team in Higher Educational Institutions of Hunan Province, China.References
- K. S. Novoselov, A. K. Geim, S. V. Morozov, D. Jiang, Y. Zhang, S. V. Dubonos, I. V. Grigorieva and A. A. Firsov, Science, 2004, 306, 666–669 CrossRef CAS PubMed.
- A. K. Geim and K. S. Novoselov, Nat. Mater., 2007, 6, 183–191 CrossRef CAS PubMed.
- C. Zhi, Y. Bando, C. Tang, H. Kuwahara and D. Golberg, Adv. Mater., 2009, 21, 2889–2893 CrossRef CAS.
- J. N. Coleman, M. Lotya, A. O'Neill, S. D. Bergin, P. J. King, U. Khan, K. Young, A. Gaucher, S. De, R. J. Smith, I. V. Shvets, S. K. Arora, G. Stanton, H.-Y. Kim, K. Lee, G. T. Kim, G. S. Duesberg, T. Hallam, J. J. Boland, J. J. Wang, J. F. Donegan, J. C. Grunlan, G. Moriarty, A. Shmeliov, R. J. Nicholls, J. M. Perkins, E. M. Grieveson, K. Theuwissen, D. W. McComb, P. D. Nellist and V. Nicolosi, Science, 2011, 331, 568–571 CrossRef CAS PubMed.
- R. E. Schaak and T. E. Mallouk, Chem. Mater., 2002, 14, 1455–1471 CrossRef CAS.
- E. S. Reich, Nature, 2013, 497, 421–422 CrossRef PubMed.
- Y. Wang, D. Wong, A. V. Shytov, V. W. Brar, S. Choi, Q. Wu, H.-Z. Tsai, W. Regan, A. Zettl, R. K. Kawakami, S. G. Louie, L. S. Levitov and M. F. Crommie, Science, 2013, 340, 734–737 CrossRef CAS PubMed.
- H. L. Fan, L. L. Wang, K. K. Zhao, N. Li, Z. J. Shi, Z. G. Ge and Z. X. Jin, Biomacromolecules, 2010, 11, 2345–2351 CrossRef CAS PubMed.
- T. Ramanathan, A. A. Abdala, S. Stankovich, D. A. Dikin, M. Herrera-Alonso, R. D. Piner, D. H. Adamson, H. C. Schniepp, X. Chen, R. S. Ruoff, S. T. Nguyen, I. A. Aksay, R. K. Prud'homme and L. C. Brinson, Nat. Nanotechnol., 2008, 3, 327–331 CrossRef CAS PubMed.
- J. C. Meyer, A. K. Geim, M. I. Katsnelson, K. S. Novoselov, T. J. Booth and S. Roth, Nature, 2007, 446, 60–63 CrossRef CAS PubMed.
- J. S. Bunch, A. M. van der Zande, S. S. Verbridge, I. W. Frank, D. M. Tanenbaum, J. M. Parpia, H. G. Craighead and P. L. McEuen, Science, 2007, 315, 490–493 CrossRef CAS PubMed.
- Z. Zhang, C. Guo, D. J. Kwong, J. Li, X. Deng and Z. Fan, Adv. Funct. Mater., 2013, 23, 2765–2774 CrossRef CAS.
- Z. H. Zhang, X. Q. Deng, X. Q. Tan, M. Qiu and J. B. Pan, Appl. Phys. Lett., 2010, 97, 183105 CrossRef.
- K. Watanabe, T. Taniguchi and H. Kanda, Nat. Mater., 2004, 3, 404–409 CrossRef CAS PubMed.
- C. Zhi, N. Hanagata, Y. Bando and D. Golberg, Chem.–Asian J., 2011, 6, 2530–2535 CrossRef CAS PubMed.
- X. L. Zhong, Y. K. Yap, R. Pandey and S. P. Karna, Phys. Rev. B: Condens. Matter Mater. Phys., 2011, 83, 193403 CrossRef.
- P. Kim, L. Shi, A. Majumdar and P. L. McEuen, Phys. Rev. Lett., 2001, 87, 215502 CrossRef CAS.
- G. W. Lee, M. Park, J. Kim, J. I. Lee and H. G. Yoon, Composites, Part A, 2006, 37, 727–734 CrossRef PubMed.
- C. Y. Zhi, Y. Bando, C. C. Tang, H. Kuwahara and D. Golberg, Adv. Mater., 2009, 21, 2889–2893 CrossRef CAS.
- D. Pacile, J. C. Meyer, C. O. Girit and A. Zettl, Appl. Phys. Lett., 2008, 92, 133107 CrossRef.
- W. Q. Han, L. J. Wu, Y. M. Zhu, K. Watanabe and T. Taniguchi, Appl. Phys. Lett., 2008, 93, 223103 CrossRef.
- D. Golberg, Y. Bando, Y. Huang, T. Terao, M. Mitome, C. C. Tang and C. Y. Zhi, ACS Nano, 2010, 4, 2979–2993 CrossRef CAS PubMed.
- A. Rubio, J. L. Corkill and M. L. Cohen, Phys. Rev. B: Condens. Matter Mater. Phys., 1994, 49, 5081–5084 CrossRef CAS.
- X. Blase, A. Rubio, S. G. Louie and M. L. Cohen, Europhys. Lett., 1994, 28, 335–340 CrossRef CAS.
- D. Golberg, Y. Bando, K. Kurashima and T. Sato, Scr. Mater., 2001, 44, 1561–1565 CrossRef CAS.
- Y. Chen, J. Zou, S. J. Campbell and G. Le Caer, Appl. Phys. Lett., 2004, 84, 2430–2432 CrossRef CAS.
- C. R. Dean, A. F. Young, I. Meric, C. Lee, L. Wang, S. Sorgenfrei, K. Watanabe, T. Taniguchi, P. Kim, K. L. Shepard and J. Hone, Nat. Nanotechnol., 2010, 5, 722–726 CrossRef CAS PubMed.
- Z. Liu, L. Song, S. Z. Zhao, J. Q. Huang, L. L. Ma, J. N. Zhang, J. Lou and P. M. Ajayan, Nano Lett., 2011, 11, 2032–2037 CrossRef CAS PubMed.
- S. J. Tang, G. Q. Ding, X. M. Xie, J. Chen, C. Wang, X. L. Ding, F. Q. Huang, W. Lu and M. H. Jiang, Carbon, 2012, 50, 329–331 CrossRef CAS PubMed.
- L. Britnell, R. V. Gorbachev, R. Jalil, B. D. Belle, F. Schedin, A. Mishchenko, T. Georgiou, M. I. Katsnelson, L. Eaves, S. V. Morozov, N. M. R. Peres, J. Leist, A. K. Geim, K. S. Novoselov and L. A. Ponomarenko, Science, 2012, 335, 947–950 CrossRef CAS PubMed.
- J. E. Padilha, R. B. Pontes and A. Fazzio, J. Phys.: Condens. Matter, 2012, 24, 075301 CrossRef PubMed.
- R. V. Gorbachev, A. K. Geim, M. I. Katsnelson, K. S. Novoselov, T. Tudorovskiy, I. V. Grigorieva, A. H. MacDonald, S. V. Morozov, K. Watanabe, T. Taniguchi and L. A. Ponomarenko, Nat. Phys., 2012, 8, 896–901 CrossRef CAS.
- F. Scarpa, S. Adhikari and R. Chowdhury, Phys. Lett. A, 2010, 374, 2053–2057 CrossRef CAS PubMed.
- Y. M. Shi, C. Hamsen, X. T. Jia, K. K. Kim, A. Reina, M. Hofmann, A. L. Hsu, K. Zhang, H. N. Li, Z. Y. Juang, M. S. Dresselhaus, L. J. Li and J. Kong, Nano Lett., 2010, 10, 4134–4139 CrossRef CAS PubMed.
- L. Song, L. J. Ci, H. Lu, P. B. Sorokin, C. H. Jin, J. Ni, A. G. Kvashnin, D. G. Kvashnin, J. Lou, B. I. Yakobson and P. M. Ajayan, Nano Lett., 2010, 10, 3209–3215 CrossRef CAS PubMed.
- C. H. Lui, Z. Q. Li, K. F. Mak, E. Cappelluti and T. F. Heinz, Nat. Phys., 2011, 7, 944–947 CrossRef CAS.
- W. Bao, L. Jing, J. Velasco, Y. Lee, G. Liu, D. Tran, B. Standley, M. Aykol, S. B. Cronin, D. Smirnov, M. Koshino, E. McCann, M. Bockrath and C. N. Lau, Nat. Phys., 2011, 7, 948–952 CrossRef CAS.
- F. Zhang, B. Sahu, H. K. Min and A. H. MacDonald, Phys. Rev. B: Condens. Matter Mater. Phys., 2010, 82, 035409 CrossRef.
- R. G. Quhe, J. X. Zheng, G. F. Luo, Q. H. Liu, R. Qin, J. Zhou, D. P. Yu, S. Nagase, W. N. Mei, Z. X. Gao and J. Lu, NPG Asia Mater., 2012, 4, E6 CrossRef.
- J. Slawinska, I. Zasada, P. Kosinski and Z. Klusek, Phys. Rev. B: Condens. Matter Mater. Phys., 2010, 82, 085431 CrossRef.
- J. H. Yuan, J. X. Liao, C. H. Yang and X. H. Shi, Curr. Nanosci., 2013, 9, 324–329 CrossRef CAS.
- J. H. Yuan and K. M. Liew, J. Nanosci. Nanotechnol., 2012, 12, 2617–2624 CrossRef CAS PubMed.
- J. H. Yuan and K. M. Liew, Carbon, 2011, 49, 677–683 CrossRef CAS PubMed.
- K. M. Liew and J. H. Yuan, Nanotechnology, 2011, 22, 085701 CrossRef CAS PubMed.
- J. H. Yuan and K. M. Liew, J. Phys. Chem. C, 2011, 115, 431–435 CAS.
- J. Yuan and K. M. Liew, Carbon, 2009, 47, 713–721 CrossRef CAS PubMed.
- A. K. Rappe, C. J. Casewit, K. S. Colwell, W. A. Goddard and W. M. Skiff, J. Am. Chem. Soc., 1992, 114, 10024–10035 CrossRef CAS.
- N. Yao and V. Lordi, J. Appl. Phys., 1998, 84, 1939–1943 CrossRef CAS.
- C. J. Casewit, K. S. Colwell and A. K. Rappe, J. Am. Chem. Soc., 1992, 114, 10035–10046 CrossRef CAS.
- L. Boldrin, F. Scarpa, R. Chowdhury and S. Adhikari, Nanotechnology, 2011, 22, 505702 CrossRef CAS PubMed.
- D. Srivastava, M. Menon and K. J. Cho, Phys. Rev. Lett., 1999, 83, 2973–2976 CrossRef CAS.
- D. W. Smith, J. Chem. Educ., 2000, 77, 780–784 CrossRef CAS.
| This journal is © the Owner Societies 2014 |

