Theoretical investigations on fluorinated and cyano copolymers for improvements of photovoltaic performances†
Received
1st August 2013
, Accepted 14th October 2013
First published on 17th October 2013
Abstract
An effective way to improve the efficiency of organic solar cells is to adjust the electron-withdrawing strength in donor–acceptor (D–A) copolymers. To achieve this goal, starting from previously reported polymers (PCPDT-BT and PDTPr-FBT) which are based on benzothiadiazole (BT) electron-deficient unit connected to each of two electron-rich units (cyclopentadithiophene (CPDT) and dithienopyrrole (DTPr)), we introduced two strong electron-withdrawing fluorine atoms or a cyano group on the BT unit to replace BT with fluorinated BT (FBT) and cyano BT (CNBT) in PCPDT-BT and PDTPr-FBT, respectively, and designed two types of D–A copolymers with different electron-withdrawing strengths. From the calculated results, the introduction of strong electron-withdrawing groups onto the copolymer can not only obviously reduce the HOMO and LUMO level of molecules, which results in increasing the open circuit voltage (Voc) in solar cells, but can also enhance light-absorbing efficiency and charge transport ability of polymers. In the meantime, the cyano copolymers of PCPDT-1CNBT and PDTPr-1CNBT show the best performances with the smallest band gaps, lowest HOMO energy levels, the highest Voc, and the largest hole mobility (3.67 × 10⁻³ cm2 V−1 s−1 and 8.05 × 10⁻⁴ cm2 V−1 s−1, respectively) among all the considered systems. The power conversion efficiencies (PCEs) of ∼7.2% and ∼6.8% for organic solar cell made of designed polymers (PCPDT-1CNBT and PDTPr-1CNBT) are predicted by Scharber models. We presented several polymer donors for comparison of how the strong electron-withdrawing group influences the electronic properties and optical absorption of the polymers and the performances of organic solar cells made of the polymers, thereby obtaining promising organic solar cells with high power conversion efficiencies.
1. Introduction
Conjugated polymers are developing rapidly in terms of their application to bulk heterojunction solar cells (BHJSCs) as they have a lot of advantages, such as low cost and ease of fabrication, light weight, and the possibility to fabricate flexible large-area devices.1–4 Bulk-heterojunctions (BHJs) typically consist of an active layer with a phase-separated blend of an electron donor polymer and an electron acceptor placed between the anode and the cathode.1–5 Fullerene and its derivates are usually used as acceptor materials.6–9 In the active layer of BHJSCs, the conjugated polymer donor is the most critical part for the absorption of photons, which directly determines the efficiency of the device terminals. The process of energy conversion has four fundamental steps in the BHJSC:7,10–12 (1) absorption of light by the active layer, which results in the generation of excitons, (2) diffusion of the excitons, (3) dissociation of the excitons with a generation of charge, and (4) charge transport and charge collection by the electrodes.
The power conversion efficiency (PCE) of an organic solar cell device is proportional to its open circuit voltage (Voc), the short-circuit current (Jsc) and the fill factor (FF). The Jsc depends on the efficiencies of the light absorption of the active layer, exciton diffusion and dissociation at the donor/acceptor interface, charge transportation in the active layer, and charge collection on the electrodes.13–15 The Voc is mainly proportional to the energy level difference between the lowest unoccupied molecular orbital (LUMO) of the acceptor and the highest occupied molecular orbital (HOMO) of the donor.16 The FF is related to the active layer morphology and charge transport.13 It is important to simultaneously optimize the above-mentioned parameters in order to maximize the PCE of the organic solar cell. Consequently, the aim of designing and synthesizing a new donor material is that it must possess suitable frontier molecular orbital energy, a broad absorption region, high charge transport properties and high air-stability. Obviously, during the fabrication procedure of the BHJSC device, the solubility and morphology of photovoltaic material also influences the efficiency of the organic solar cell device significantly.14
Improvements in the efficiency of the organic solar cell devices cannot be separated from the development of new materials. Quantum-chemical techniques play an important role in reducing the cost of developing new materials and shortening the development cycle of the material. Both Seki’s team17 and Song’s team18 explored the influence of an external electric field on the photoinduced charge transfer at the donor/acceptor interface in donor–acceptor systems. Shuai and co-workers19 studied the effect of the charge carrier mobility on the PCE of polymer solar cells theoretically. They concluded that there is a positive correlation between the PCE of polymer solar cells and the charge carrier mobility of donors to some extent. This proved that charge carrier mobility of copolymer donors was a key parameter for polymer solar cells. For the energy levels and band gaps of organic conductor materials, there were some differences between theoretical calculations and experimentally measured values. To correct the difference, Beaupré and co-workers20 proposed a reliable model that can be used to estimate the electronic properties (i.e., the HOMO, LUMO and band gap energies) of conjugated polymers, which would be a great tool for applying to organic electronics such as light-emitting diodes, field-effect transistors and photovoltaic cells. A similar model used to predict the energy levels of new polymers was proposed by Blouin and co-workers.21 Scharber et al.16 proposed a model that describes how to estimate the PCEs of BHJSCs. However, in order to use the Scharber model to predict the PCEs of BHJSCs made of new polymer donors, we first have to accurately predict the performance of polymer or unknown polymer donors, such as the electronic properties, optical properties and transport properties of polymer donors, etc. These works performed by predecessors provide some important information on how to design and judge a highly efficient copolymer donor of an organic solar cell.
The low-band gap polymers were achieved by combining electron-rich units (with high HOMO/LUMO levels) and electron-deficient units (with low HOMO/LUMO levels) in a copolymer unit.22–25 Usually, the electron-rich units are fused-ring derivatives such as cyclopentadithiophene (CPDT)9,26–37 and dithienopyrrole (DTPr).25,27,36,38,39 The rigid structure of the planar fused-ring derivatives extends the π conjugation and facilitates the interchain π stacking.22,25,26 You and co-workers40,41 reported that the copolymer donors based on the benzo[1,2-b:4,5-b′]dithiophene (BnDT) as an electron-rich unit to combine with the electron-deficient fluorinated benzothiadiazole (FBT) or fluorinated benzotriazole showed a high PCE of 7.0% in BHJSCs when blended with PC61BM. Thus it could be seen that the introduction of an unsaturated nitrogen atom or fluorine atom into the electron-deficient unit of copolymers can significantly improve its power conversion efficiency.
In this article, starting from the reported low band gap polymers PCPDT-BT, we introduced two strong electron-withdrawing fluorine atoms and a cyano onto the benzothiadiazole (BT) unit to form the fluorinated and cyano benzothiadiazole (FBT and CNBT) unit to build two new polymers PCPDT-FBT and PCPDT-1CNBT, respectively. Analogously, on the basis of the reported polymer containing BT electron-deficient unit and DTPr electron-rich units (PDTPr-BT), another two polymers PDTPr-FBT and PDTPr-1CNBT were constructed. The chemical structures and polymeric manner of the copolymers are displayed in Scheme 1. PCPDT-BT and PDTPr-BT or their analogues have been almost exclusively used in the best BHJSC reported so far.25,29,34,36,38,42 In view of the experimental research,40,41 fluorinated copolymer donors could significantly improve the efficiency of BHJSC devices compared with no fluorinated copolymer donors. The purpose of this design was first to consider the effects of the electron-withdrawing capability in a polymer on its electronic properties, photophysical properties and the performance of BHJSC device. Second, we attempted to design potential polymer donors to improve photovoltaic performances.
 |
| | Scheme 1 Chemical structure of polymer donors and PC60BM acceptor. | |
2. Computational details
In the present work, the geometry of the copolymers (monomer and dimer) in the ground state was fully optimized by employing density functional theory (DFT) with B3LYP functional at the 6-31G(d) and 6-311G(d,p) basis set levels.43–45 There are no imaginary frequencies at this level for all the structures of optimization, which indicates that all the optimized structures are the minima on the potential energy surfaces and are stable structures. In the calculations, the side chain alkyl of the copolymers was repacked by hydrogen atoms, because they merely aid in improving solubility without affecting electronic properties.8,46 The electronic absorption spectra of polymers were calculated using time-dependent density functional theory (TD-DFT) at B3LYP/6-311G(d,p) levels in the gap phase.47–49 In the computation of the reorganization energy, the cation geometry of copolymer donors were also optimized at levels of DFT/B3LYP/6-31G(d), and the energy of the neutral geometry. Based on the optimized cation geometry, the single point energy is computed using the same method.50–52 The correlative computations of the transfer integral are performed at the B97-D/6-31g(d) level.53,54 All DFT, TD-DFT and B97-D calculations are carried out using the Gaussian 09 software.55
In addition, the electron transfer distance and the fraction of electron exchange for all dimer models were calculated.56,57 The total electron density difference (∑∂m→n) after photoexcitation between the initial and final states could be expressed as the sum of all molecular orbital transitions involving each participating excitation m → n (m and n denote the initial and final molecular orbital, respectively):58
| | 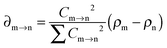 | (1) |
Cm→n represents the orthogonal coefficient in the TD-DFT equation, and then

is the contribution of the electron transition model to this absorption peak,
ρm and
ρn are the electron densities of the participating molecular orbital relative to the transitions.
| | 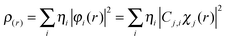 | (2) |
where
ηi and
χ represent occupation number of orbital
i and its basis function, respectively.
C is coefficient matrix, the element of
ith row
jth column corresponding to the expansion coefficient of orbital
j respects to basis function
χ. The electron density difference between the initial and final states is the linear combination of various electron transition models. All these calculated results could be obtained using the
cubman utility provided by the Gaussian 09 and
Multiwfn programs.
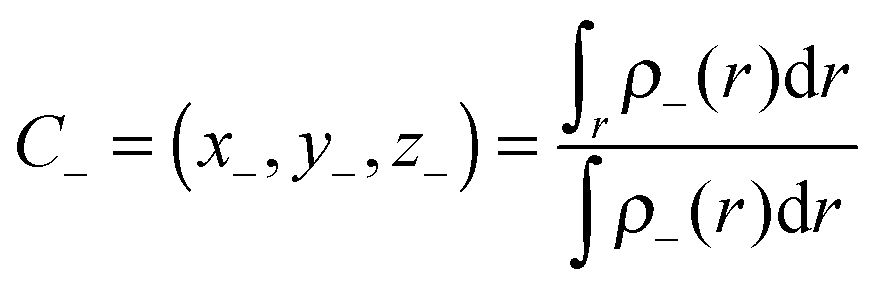
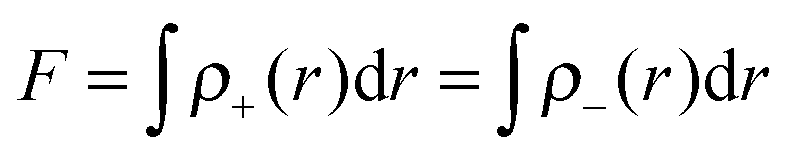
59 Moreover, two functions
ρ+(
r) and
ρ−(
r) can be used for defining the increase and decrease of the density because of electronic transitions. The centroids of the spatial regions defined by
ρ+(
r) and
ρ−(
r), can be expressed as:
56| | 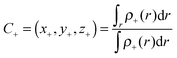 | (3) |
and
| | 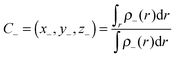 | (4) |
The distance (
D) of charge transfer can be expressed as:
The fraction (
F) of electron exchange can be defined as:
| |  | (6) |
In this work, the monomer and dimer are used as given by the computational models. The monomer and dimer models can well show various chemical and theoretical properties of polymers.13,25 All the monomer and dimer models showed good planarity (with dihedral angles <1°). We selected the typical PC60BM as an acceptor.
3. Results and discussion
3.1 Frontier molecular orbital energies and band gaps
The frontier molecular orbital energies and energy gap (Eg) values have a close relationship to the solar cell efficiencies.16,25 In order to accurately predict the performance of a copolymer solar cell, it is vital to validate theoretically predicted energy levels and band gap values to determine their agreement with experimentally measured values. Herein, a class of donor–acceptor (D–A) copolymers without a bridge thiophene ring was selected and theoretically investigated using B3LYP/6-31G(d) methods (detailed information is presented in the ESI,† Section S1). The syntheses and full characterization of all selected polymers discussed in this paper are reported in literature.38,42,60–62 An excellent correlation can be established between the theoretical HOMO/LUMO energy levels of the repetitive units and the experimental HOMO/LUMO energy levels of the polymers (in the ESI,† Section S1). The empirical correlations between theoretical HOMOth/LUMOth and experimental HOMO/LUMO for the selected D–A copolymers are expressed in following equations:| | | HOMO = 0.65 × HOMOth − 1.97 (R = 0.97) | (7) |
| | | LUMO = 0.83 × LUMOth − 0.94 (R = 0.93) | (8) |
From the eqn (7) and (8), one can see that these values have relatively good correlation coefficients (R > 0.93). According to the eqn (7), for the dimer models the calculated results of the HOMO energy levels (−5.02 and −4.99 eV for PCPDT-BT and PDTPr-BT, respectively) agree well with the experimental values of the polymers (−4.9 to −5.3 eV15,27,29,33,60,63 and −4.81 to −4.94 eV36,38 for PCPDT-BT and PDTPr-BT, respectively), which have been measured electrochemically using cyclic voltammetry (CV). According to the eqn (8), the LUMO values of PCPDT-BT and PDTPr-BT are −3.21 and −3.16 eV, respectively. These are in agreement with the claim of Ku and co-workers that predicted LUMOs of PCPDT-BT and PDTPr-BT are −3.21 and −3.14 eV,25 respectively. The experimental band gaps of PCPDT-BT and PDTPr-BT which have been measured by CV are 1.4–1.75 eV29,31,33–35 for PCPDT-BT and 1.52–1.87 eV25,27,36,38 for PDTPr-BT. The energy gap (−1.81 and −1.85 eV for PCPDT-BT and PDTPr-BT, respectively) was estimated by the equation, Eg = LUMO − HOMO. From the results obtained above, one can find that the empirical correlations offer a reliable model to estimate the HOMO and LUMO energies of copolymers, especially on unknown conjugated polymers. Hence, the energy levels of the following molecules are calculated by eqn (7) and (8). Similar models and methods have been found previously.20,21
3.2 Molecular design and ground-state properties
Obviously, a highly efficient organic solar cell needs a copolymer donor possessing a low-band gap, a relatively low HOMO energy level and good transport properties. It is reported that a strong electron-withdrawing group generally results in decreasing of the HOMO and LUMO energies.50,64 In order to obtain polymers with lower band gaps, deeper LUMO energy levels and better transport properties, we hence use fluorinated benzothiadiazole (FBT) and cyano benzothiadiazole (1CNBT), stronger electron-deficient units, to replace benzothiadiazole and construct four new polymers of PCPDT-FBT, PDTPr-FBT, PCPDT-1CNBT and PDTPr-1CNBT (see Scheme 1).
We calculated out the HOMO and LUMO energy levels of designed polymers from eqn (7) and (8). The predicted energy levels (HOMO and LUMO) and band gap (Eg) of all copolymers are listed in Table 1. The stronger electron-deficient group (FBT or 1CNBT) in the copolymers results in lower LUMO levels which promotes the increase of electron densities localized on the electron-deficient group. To investigate the influence of electron-deficient fragments of copolymers on the energy levels and electron density distribution, we calculated the energy levels of electron-deficient fragments and the data are presented in Fig. 1. For the three electron-deficient fragments, the HOMO values are in the order BT > FBT > 1CNBT, and the LUMO values are in the sequence BT > FBT > 1CNBT. These results reveal that the electron-withdrawing capability of the three electron-deficient units are in the order BT > FBT > 1CNBT. This could be due to the electron withdrawing effect of the fluorine or cyano group in electron-deficient units.65 As shown in Table 1, one can see that the HOMO energy levels are in the order PCPDT-BT (−5.02 eV) > PCPDT-FBT (−5.14 eV) > PCPDT-1CNBT (−5.27 eV), and LUMO energy levels are in the sequence PCPDT-BT (−3.21 eV) > PCPDT-FBT (−3.32 eV) > PCPDT-1CNBT (−3.66 eV). There is a similar tendency for PDTPr-BT, PDTPr-FBT and PDTPr-1CNBT. It clearly suggested that the introduction of a stronger electron-withdrawing group onto the copolymer has a significant influence on reducing the HOMO and LUMO energy levels of the copolymer. This result is consistent with previous reports.50,64 The energy gap was calculated from the equation Eg = LUMO − HOMO. The Eg of PCPDT-BT, PCPDT-FBT and PCPDT-1CNBT are 1.81, 1.82 and 1.61 eV, respectively. The Eg of PDTPr-BT, PDTPr-FBT and PDTPr-1CNBT are 1.85, 1.83 and 1.62 eV, respectively. The results obtained above show that those fluorinated and cyano polymers (PCPDT-FBT, PCPDT-1CNBT, PDTPr-FBT and PDTPr-1CNBT) have narrow band gaps and low HOMO energy levels and as a result may possess larger Jsc and higher Voc when applied to BHJSCs.
Table 1 Predicted the energy levels HOMO (eV), LUMO (eV), Eg (eV) and calculated open circuit voltage Voc (V)
| |
PCPDT-BT |
PCPDT-FBT |
PCPDT-1CNBT |
PDTPr-BT |
PDTPr-FBT |
PDTPr-1CNBT |
| HOMO |
−5.02 |
−5.14 |
−5.27 |
−4.99 |
−5.12 |
−5.22 |
| LUMO |
−3.21 |
−3.32 |
−3.66 |
−3.16 |
−3.29 |
−3.60 |
|
E
g
|
1.81 |
1.82 |
1.61 |
1.85 |
1.83 |
1.62 |
|
V
oc
|
0.42 |
0.54 |
0.67 |
0.39 |
0.52 |
0.62 |
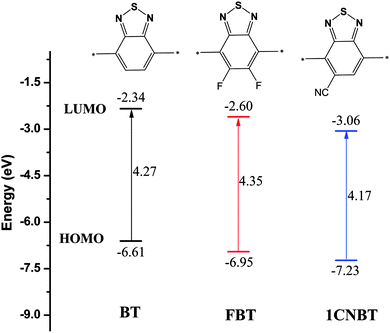 |
| | Fig. 1 Schematic energy levels of electron-deficient BT, FBT and 1CNBT. | |
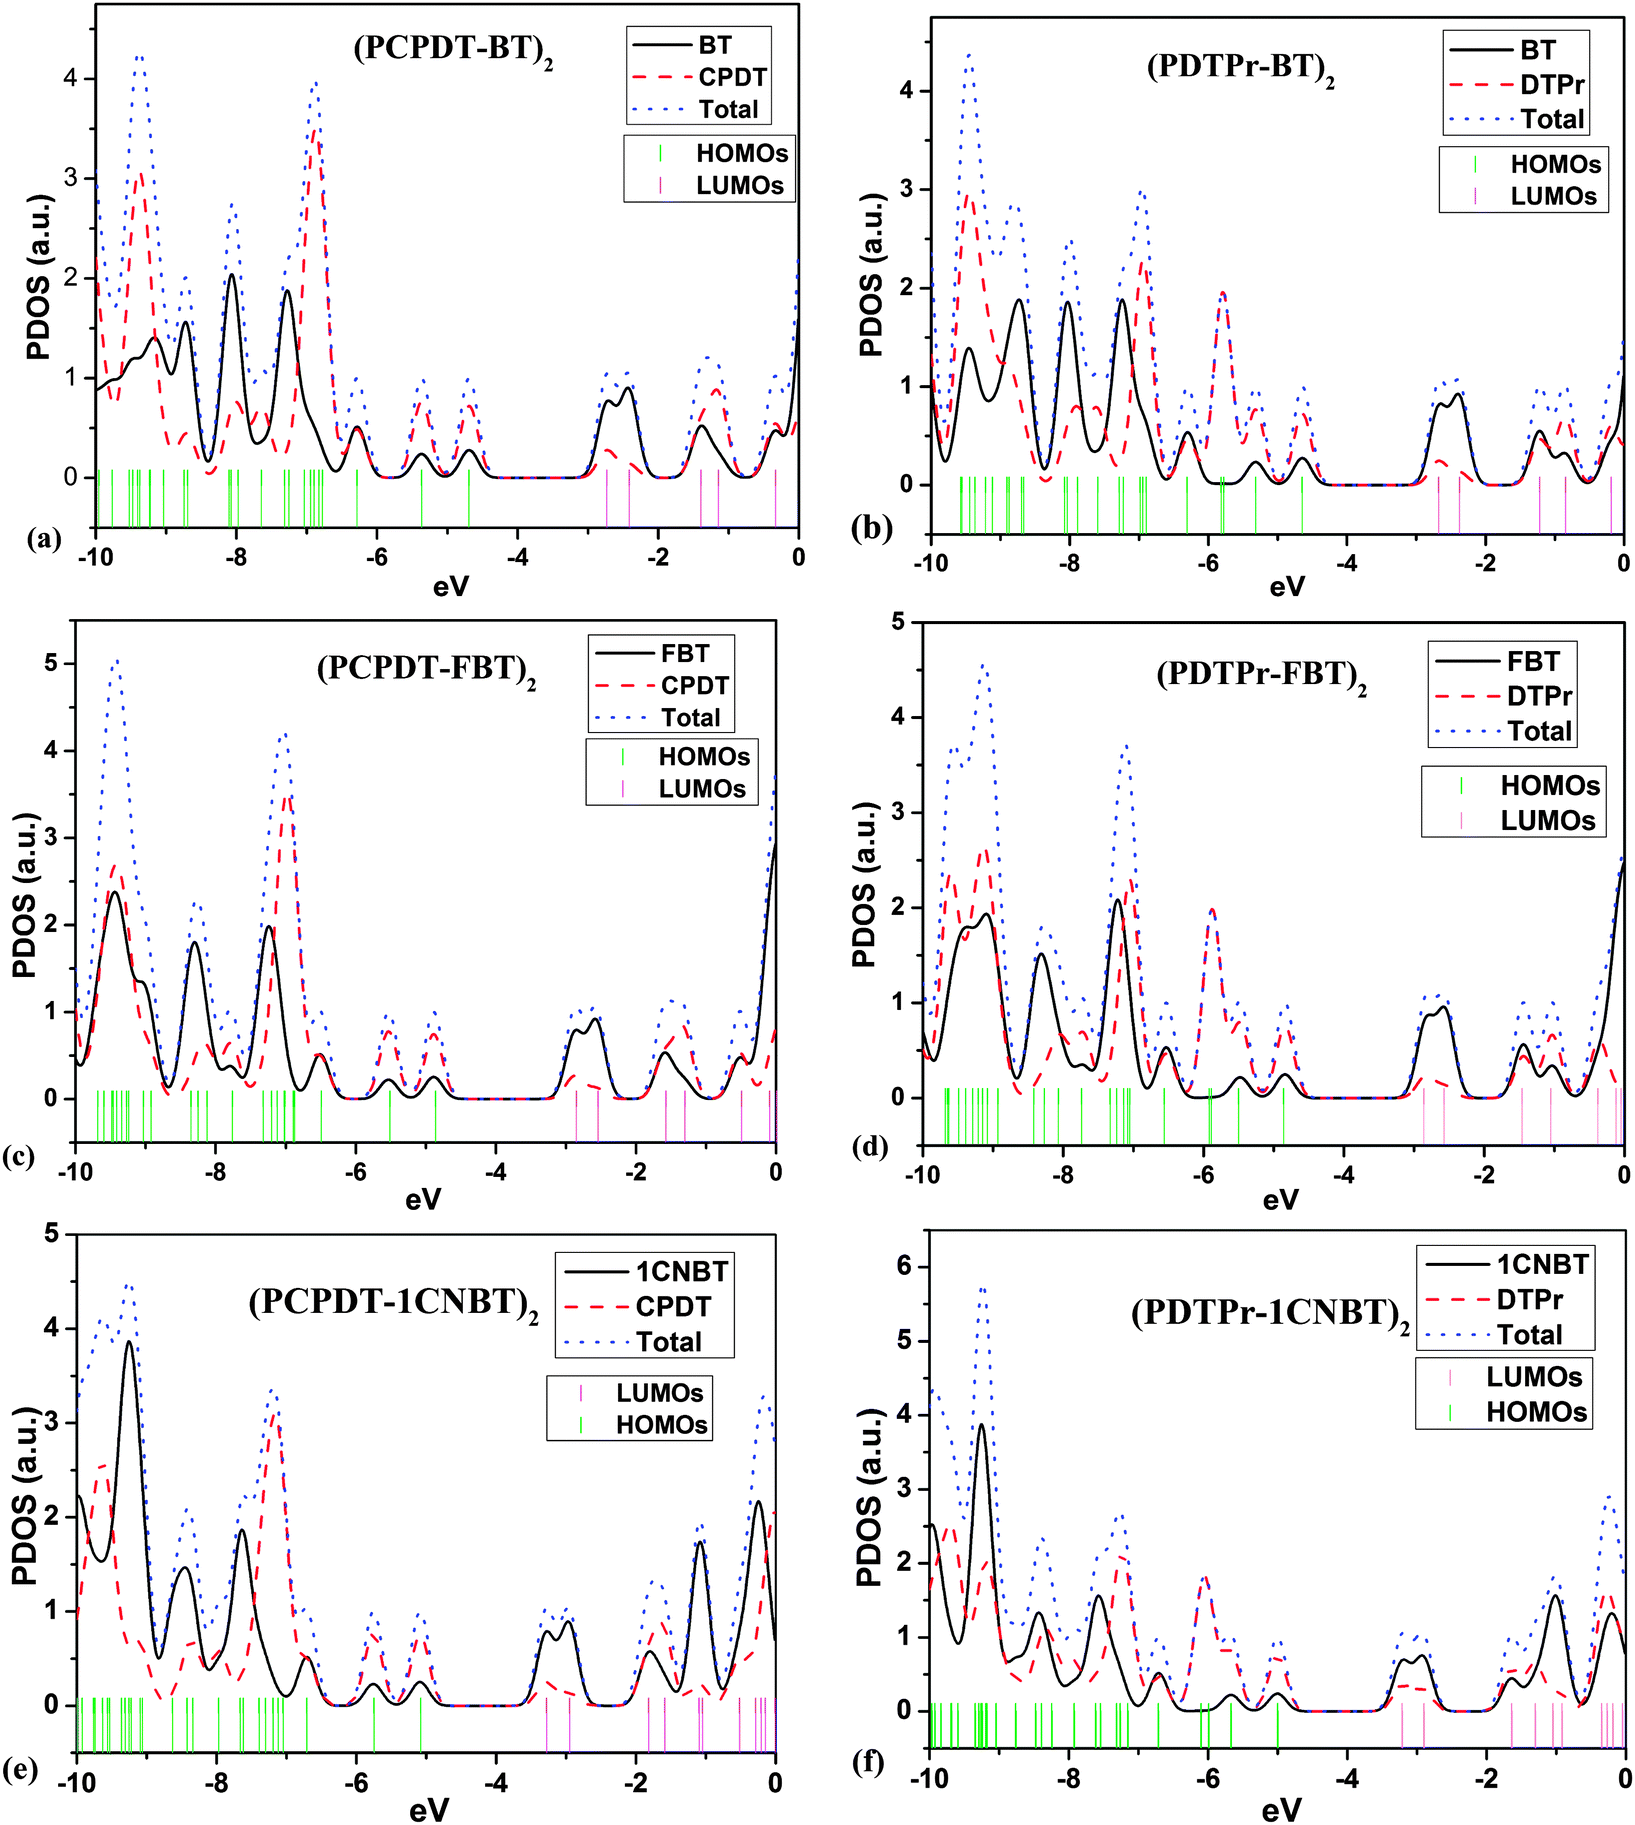
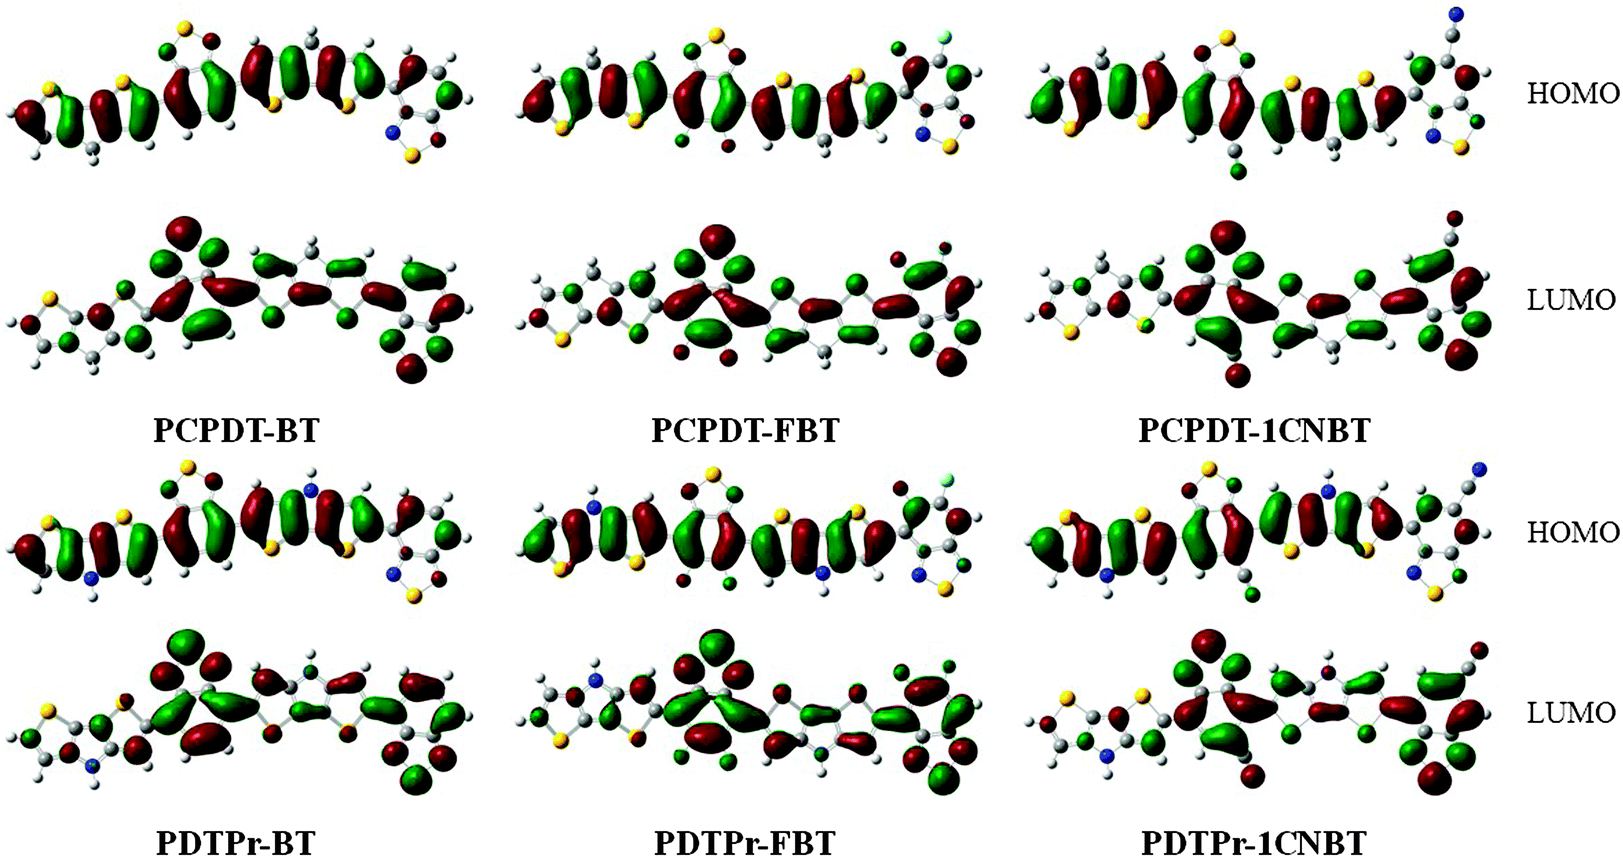
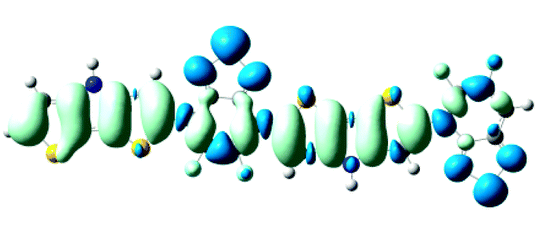
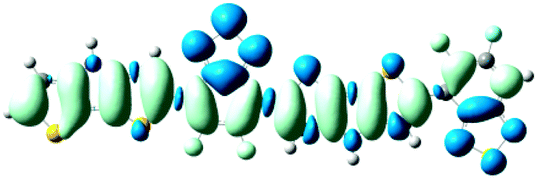
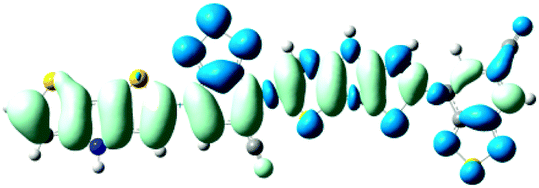
Based on the optimized ground-state geometries of all the dimer models, the total densities of states (TDOS) and projected DOS (PDOS) were calculated and are presented in Fig. 2. The TDOS along with the PDOS is able to clarify what groups or molecular orbitals are involved with the HOMO and LUMO states of the molecule. From Fig. 2, one can see that there are analogous characterizations for PCPDT-BT, PCPDT-FBT and PCPDT-1CNBT. For the (PCPDT-BT)2, (PCPDT-FBT)2 and (PCPDT-1CNBT)2 (Fig. 2a, c and e), the densities of HOMO and HOMO − 1 are almost localized on the electron-rich CPDT, and the densities of LUMO and LUMO + 1 are mainly localized on electron-deficient groups (BT, FBT or 1CNBT). For the (PDTPr-BT)2, (PDTPr-FBT)2 and (PDTPr-1CNBT)2 (Fig. 2b, d and f), the densities of HOMO, HOMO − 1, and HOMO − 3 are nearly localized on electron-rich DTPr, and the densities of LUMO and LUMO + 1 are mainly localized on electron-deficient groups (BT, FBT or 1CNBT). Moreover, from the molecular orbital spatial distributions (Fig. 3) of six dimer models, the HOMO is mainly centralized on electron-rich CPDT (DTPr) and the benzene ring of the inner electron-deficient unit, while the LUMO is mainly localized on the electron-deficient unit. Comparison among LUMOs of PCPDT-BT, PCPDT-FBT and PCPDT-1CNBT indicated that the FBT and 1CNBT unit has a little more electron density than the BT group, especially on the fluorine atom and cyano group. A more obvious difference of these LUMOs can be seen from Fig. 1S (ESI†). This difference should be ascribed to the different strengths of the electron-withdraw groups. The intramolecular charge transfer orientation is also associated with the electron density distribution of the HOMOs and the LUMOs of the molecules. The electronic transitions involving these orbitals are intramolecular charge transfer excited states, where electrons should be moved from the electron-rich unit to electron-deficient unit. In order to further prove the electronic and molecular orbitals characteristics, the orbital spatial distribution and PDOS of all monomer models were presented in Fig. 1S and 2S in the ESI,† respectively. The monomers models exhibit similar electronic and molecular orbital characteristics to that of the dimer models.
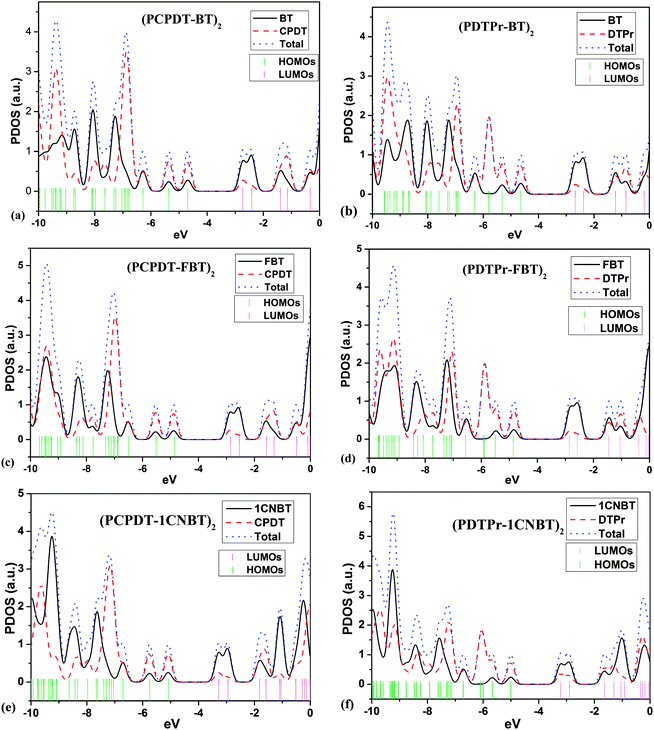 |
| | Fig. 2 Total densities of states (TDOS) and projected DOS (PDOS) for all dimer models. | |
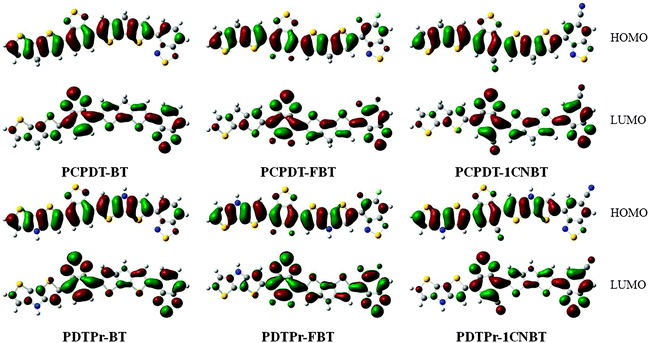 |
| | Fig. 3 Molecular orbital spatial distribution. | |
3.3 Theoretical characterization of the copolymers and organic solar cells
A measurement of the performance of organic solar cells system is called the power conversion efficiency (PCE) and it can be expressed as PCE = (Voc × Jsc × FF)/Pin, where Pin is the input power in the form of solar radiation. Open circuit voltage (Voc) is influenced by the difference of energy between the HOMO of the donor and the LUMO of the acceptor.16 Short-circuit current (Jsc) is affected by the efficiencies of the light absorption of the active layer, exciton diffusion and dissociation in the donor/acceptor interface, charge transportation in the active layer and charge collection on the electrodes.13–15 The value of fill factor (FF) on the other hand can be largely attributed to the active layer morphology and charge transport.13
3.3.1 Open circuit voltage.
Open circuit voltage (Voc) is a key parameter of the organic solar cell. It is well known that the HOMO energy levels of the donor are heavily related to Voc.16 Scharber and co-workers16 proposed a relationship between Voc and the difference of energy between the HOMO of the donor and the LUMO of the acceptor, and this formula can be expressed as| | | Voc = (1/e)(|EHOMO(D)| − |ELUMO(A)|) − 0.3 V | (9) |
where e represents the elementary charge, and the value of 0.3 V is an empirical factor. Scharber and co-workers16 proposed eqn (9) using −4.3 eV as LUMO energy for the PC60BM. The Voc based on a (PDTPr-BT)–PC60BM solar cell has been reported as 0.38–0.5536 and 0.46 V.38 The calculated results of the Voc from eqn (9) (PDTPr-BT: 0.39 V) agree well with the experimental data of polymers in BHJSCs. As shown in Table 1, one can see that the predicted Voc are in the order PCPDT-BT (0.42 V) < PCPDT-FBT (0.54 V) < PCPDT-1CNBT (0.67 V). There is a similar tendency for the predicted Voc of PDTPr-BT, PDTPr-FBT and PDTPr-1CNBT.
3.3.2 Optical absorption.
A copolymer donor is a key component to absorb sunlight in a solar cell device. The absorption coverage of polymer donors within the solar spectrum exerts a crucial influence on the Jsc. Simply, it is a function of the light-absorbing efficiency of the photosensitive layers (η(λ)), internal quantum efficiency (IQE), and the spectral irradiance of the incident light (S(λ)) and can be expressed as19| | 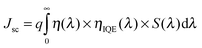 | (10) |
The light-absorbing efficiency can be expressed as58,66where f is the oscillator strength of the molecular donors associated with a certain wavelength (λ). We have collected the η(λ) at the absorbing band of maximum absorption peaks and the second absorption peaks. From the eqn (10) and (11), it is clearly found that wide and strong optical absorption can increase Jsc.
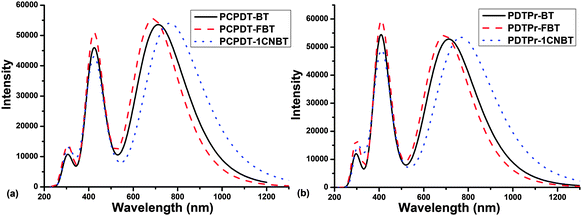
The simulated absorption spectra of the investigated copolymers are presented in Fig. 4 (considering the first 30 excited states). The absorption wavelength (λ), oscillator strength (f) (only oscillation strengths larger than 0.90 were taken into account), main configuration and light-absorbing efficiency (η(λ)) of polymers for dimer models of them were listed in Table 2.
 |
| | Fig. 4 Simulated spectral absorption of all dimer models. | |
Table 2 Calculated absorption wavelength (λ), oscillator strength (f), main configuration, and light-absorbing efficiency (η(λ)) of the molecules for the dimer models
| |
Transition energy |
|
|
|
|
|
|
E (eV) |
λ (nm) |
f
|
Main configuration |
(η(λ)) |
Exp. λa (nm) |
|
See the text (Section 3.3.2) for the references.
|
| PCPDT-BT |
S0 → S1 |
1.74 |
714 |
1.21 |
H → L (98%) |
0.938 |
718–775 |
|
|
S0 → S5 |
2.93 |
424 |
1.02 |
H → L + 2 (97%) |
0.905 |
418–426 |
| PDTPr-BT |
S0 → S1 |
1.73 |
715 |
1.19 |
H → L (98%) |
0.935 |
684–777 |
|
|
S0 → S8 |
3.04 |
408 |
1.23 |
H → L + 2 (96%) |
0.941 |
∼410 |
| PCPDT-FBT |
S0 → S1 |
1.80 |
691 |
1.26 |
H → L (97%) |
0.945 |
|
|
|
S0 → S5 |
2.93 |
423 |
1.15 |
H → L + 2 (97%) |
0.929 |
|
| PDTPr-FBT |
S0 → S1 |
1.79 |
694 |
1.23 |
H → L (97%) |
0.941 |
|
|
|
S0 → S8 |
3.03 |
409 |
1.35 |
H → L + 2 (96%) |
0.955 |
|
| PCPDT-1CNBT |
S0 → S1 |
1.62 |
765 |
1.24 |
H → L (99%) |
0.942 |
|
|
|
S0 → S5 |
2.91 |
427 |
0.90 |
H → L + 3 (94%) |
0.874 |
|
| PDTPr-1CNBT |
S0 → S1 |
1.61 |
769 |
1.22 |
H → L (98%) |
0.940 |
|
|
|
S0 → S9 |
3.00 |
414 |
1.03 |
H → L + 2 (94%) |
0.907 |
|
In Fig. 4, one can see that there are two obvious absorption peaks in the whole visible and near-infrared regions. As shown in Table 2, the calculated absorption peaks (PCPDT-BT: 424, 714 nm and PDTPr-BT: 408, 715 nm) are approximately consistent with the experiments (418–426, 718–775 nm29,31,33–35,67 for PCPDT-BT and ∼410, 684–777 nm25,27,36,38 for PDTPr-BT). In Fig. 4a, compared with PCPDT-BT, the maximum absorption spectrum of the new polymer PCPDT-FBT shows a blue shift of around 23 nm and the maximum absorption spectrum of another new polymer PCPDT-1CNBT is 51 nm red-shifted. For the range of maximum absorption peaks, the calculated light-absorbing efficiencies are 0.938 (PCPDT-BT), 0.945 (PCPDT-FBT) and 0.942 (PCPDT-1CNBT). For the range of second absorption peaks, the calculated light-absorbing efficiencies of PCPDT-BT, PCPDT-FBT and PCPDT-1CNBT are 0.905, 0.929 and 0.874, respectively. Obviously, PCPDT-1CNBT obtained a stronger and more red-shifted absorption of the maximum absorption peaks relative to the PCPDT-BT donor. The introduction of a cyano group on PCPDT-1CNBT sharply decreased the band gap (see Table 1), which is also responsible for the significant red shift of the absorption spectrum. Comparing the light-absorbing efficiencies of PCPDT-BT with those of PCPDT-FBT and PCPDT-1CNBT, this revealed that the two absorption peaks of those designed polymers yielded a stronger absorption; this especially obvious for PCPDT-FBT. There is an analogous phenomenon for the polymers of PDTPr-BT, PDTPr-FBT and PDTPr-1CNBT (see Fig. 4b and Table 2). In a word, the introduction of strong electron-withdrawing groups on the polymers either enhances the significant red shift of the absorption spectrum, or improves the light-absorbing efficiencies.
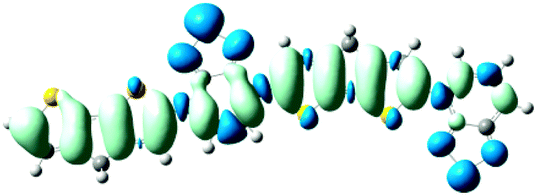
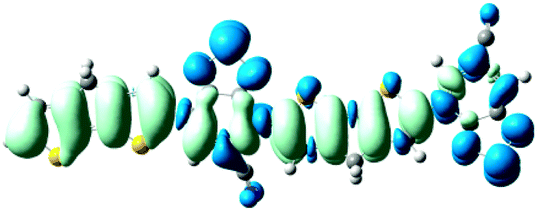
As shown in Table 2, the main transitions of all donors in the visible and near-infrared ranges correspond to the transitions from HOMO to LUMO, and HOMO to LUMO + 2. The maximum absorption transitions of all dimer models essentially originates from HOMO → LUMO, which is assigned to π → π* type transitions. The second absorption transitions of all the dimer models correspond to HOMO → LUMO + 2 showing π → π* transitions. To visually illustrate the electron transition, the electron density difference plots of the electron transitions were mapped. In order to inspect on how electron-withdrawing strength influences the intramolecular charge transfer characteristics, we here calculate the electron transfer distance (D) and the fraction of electron exchange (Δq). Based on the eqn (1)–(6) above, the electron density difference plots of the electron transitions and corresponding parameters were presented in Table 3. It is found that the electron transition characteristics of the maximum absorption transitions (S0 → S1) of all copolymers are very similar. From the molecular orbital spatial distribution (displayed in Fig. 3), the electron distribution of the LUMOs was localized mainly on the electron-deficient groups. It is evident that the electron density transfer from the electron-rich group to the electron-deficient moiety stems from the transition of HOMO → LUMO. The efficiency of electron density movement is related to both the optical absorption intensity and the available electron transition and could be estimated from the light-absorbing efficiency and the coefficient of effectual electron transition. For the maximum absorption transitions (S0 → S1) of PCPDT-BT, PCPDT-FBT and PCPDT-1CNBT (in Table 3), the calculated data in first row show that the electron transfer distance (D) and fraction of electron exchange (Δq) is increased with the strength of electron-withdrawing groups, the tendency (D/Δq) is PCPDT-BT (2.575 Å/0.921 e−) < PCPDT-FBT (3.867 Å/0.926 e−) < PCPDT-1CNBT (6.520 Å/1.002 e−). The increase of the electron-withdrawing strength in copolymers has a direct influence on increasing the possibility of electron transfer from HOMO to LUMO, which would contribute to an enhancement of the fraction of electron exchange and increase of electron transfer distance. For the second absorption transitions (S0 → S5) of PCPDT-BT, PCPDT-FBT and PCPDT-1CNBT, the electron transfer distances (D) are in the order PCPDT-BT (2.516 Å) < PCPDT-FBT (2.843 Å) < PCPDT-1CNBT (6.024 Å). There is a similar tendency for the properties of PDTPr-BT, PDTPr-FBT and PDTPr-1CNBT. As shown Table 3, it is found that the electron densities move from the white areas (electron-rich units) to blue areas (electron-withdrawing units). It is evident that the efficient electron density movement could ensure the efficient optical absorption. Obviously, from the above analysis, the enhancement of the fraction of electron exchange and the increase of electron transfer distance for copolymers contributes to enhancing the light-absorbing efficiency of copolymer donors to further improve the short-circuit current (Jsc).
Table 3 Electron density difference plots of electronic transition for each dimer model of the copolymers. D is the electron transfer distance (Å); Δq is the fraction of electron exchange (|e−|)
|
S0 → S1
D = 2.575, Δq = 0.921
|
S0 → S1
D = 3.867, Δq = 0.926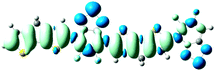
|
S0 → S1
D = 6.520, Δq = 1.002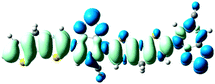
|
|
S0 → S5
D = 2.516, Δq = 0.984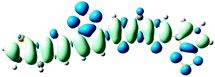
|
S0 → S5
D = 2.843, Δq = 1.006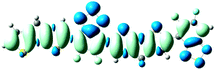
|
S0 → S5
D = 6.024, Δq = 0.971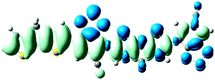
|
|
PCPDT-BT
|
PCPDT-FBT |
PCPDT-1CNBT |
|
|
|
S0 → S1
D = 2.446, Δq = 0.934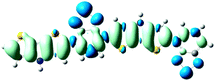
|
S0 → S1
D = 4.582, Δq = 0.948
|
S0 → S1D = 6.981, Δq = 1.001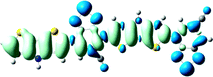 |
|
S0 → S8
D = 2.025, Δq = 0.990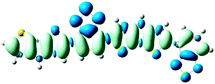
|
S0 → S8
D = 3.052, Δq = 1.015
|
S0 → S9
D = 5.663, Δq = 0.994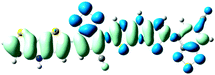
|
|
PDTPr-BT
|
PDTPr-FBT |
PDTPr-1CNBT |
Through the above analysis of the absorption spectra, the calculated results reveal that PCPDT-BT and PDTPr-BT exhibit a wide and strong absorption of visible light in agreement with the experimental findings. Compared with PCPDT-BT and PDTPr-BT, we predict that the fluorinated copolymers PCPDT-FBT and PDTPr-FBT have better light-absorbing efficiencies. However, we predict that the cyano copolymers PCPDT-1CNBT and PDTPr-1CNBT have better light-absorbing efficiency and more red-shifted absorption of the maximum absorption peaks in comparison with corresponding PCPDT-BT and PDTPr-BT donors.
3.3.3 Exciton binding energy.
The exciton binding energy (Eb) is another important fundamental parameter that determines the optoelectronic properties in organic materials and devices.68,69 It is directly related to the charge separation in organic solar cells.8 An exciton can be modeled as a two-electron system: one electron is excited into a higher-energy orbital while leaving a hole in a partially filled lower-energy orbital.69,70 Since the exciton binding energy mainly originates from the coulomb interactions between the electron and hole,68,69 the spatial distribution of the density of electrons in the LUMO and that of holes in HOMO should be decisive. Proper alignment of the energy levels between the donor and acceptor layers allows for very efficient dissociation of excitons at the donor/acceptor interface into a coulombically-bound hole polaron in the donor material.71,72 For a charge transfer reaction of a donor exciton, the condition of exciton dissociation to be energetically favorable is Eb,D < EAA − EAD.72 The EAA and EAD are the electron affinities of the acceptor and donor, which are approximated to the negative LUMO of the acceptor and donor. The experimentally derived LUMO values of acceptor PC60BM are −4.3 eV.16,21 The estimated EA of the donors are calculated by eqn (8). Here, Eb can be taken as the difference between the electronic and optical band gap energies.69,72,73 The electronic band gap is approximated as the energy difference between the HOMO and LUMO, while the optical gap is taken as the lowest excitation energy.72 The computations of the excitation energy are performed employing TDDFT/B3LYP//6-311G(d,p) at the same level which was used for the molecular structure optimizations. The exciton binding energy (Eb) and the difference of electron affinities between the acceptor and donor are listed in Table 4. As shown in Table 4, all copolymers have small Eb of about 0.2 eV, which is less than corresponding difference between the electron affinities of the acceptor and donor. This reveals that all copolymers can guarantee highly efficient dissociation of donor excitons at the donor/acceptor interface.
Table 4 The exciton binding energy (Eb) and the difference of electron affinities between acceptor and donor
| |
PCPDT-BT |
PDTPr-BT |
PCPDT-FBT |
PDTPr-FBT |
PCPDT-1CNBT |
PDTPr-1CNBT |
|
E
b (eV) |
0.22 |
0.23 |
0.23 |
0.22 |
0.20 |
0.19 |
| EAA − EAD(eV) |
1.09 |
1.16 |
0.98 |
1.01 |
0.64 |
0.70 |
3.3.4 Hole mobility.
In the polymer BHJSC with a donor as a hole transport layer, a high hole mobility for the donors contributes to enhancing the charge transport efficiency (to increase the Jsc) and to increase the FF of the devices.13 Moreover, the Scharber models16 have usually been used to predict the PCEs of the solar cells made of unknown D–A copolymer donors. In the design rules of Scharber models, one of the prerequisites is to assume a charge carrier mobility of 10−3 cm2 V−1 s−1.16 Therefore, in order to accurately predict the performances of solar cells made of the designed polymers and PCBM, it is required to compare the transport properties of polymers in this system. The supramolecular arrangement of the polymer (PCPDT-BT) has been observed using two-dimensional wide-angle X-ray scattering (2D-WAXS).74 In this work, based on π-stacking formations of the polymer in the experiment, we extract a monomer from the polymer to further predict the transport properties of the polymers. It is reported that the face-to-face π-stacking has a major contribution to the pronounced charge mobility for materials, as the face-to-face π-stacking with larger orbital overlaps can contribute to higher electronic coupling.74–76 Consequently, only the charge mobility in the face-to-face π-stacking direction was considered in this system. The detailed molecular packing of dimers are in Table 1S (ESI†).
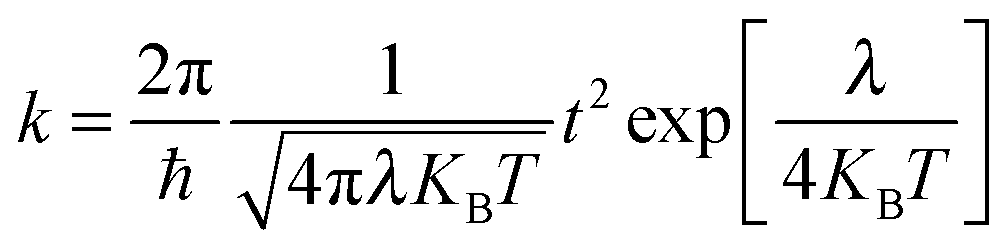
The Marcus theory is a widely used method to estimate charge transfer rates:77,78
| | 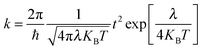 | (12) |
Where
ħ,
t,
KB,
T and
λ are the Planck's constant, charge transfer integral, Boltzmann constant, temperature and total reorganization energy, respectively. Hence,
k is governed by the two important parameters: the total reorganization energy
λ and intermolecular charge transfer integral.
In eqn (12), for an optimal transport system, the transfer integral should be maximized and λ should be minimized. The total reorganization energy which reflects the ability of the vibration structure to change due to the electron gaining/losing processes of the segment consists of two components:78,79 (i) the inner reorganization energy λin that accounts for the changes in the geometry of the two molecules upon electron transfer and (ii) the outer reorganization energy λout of the surrounding medium. When the medium contribution to the relaxation energy by virtue of the polarization in the medium is neglected (such as in a thin film), the inner reorganization energy should dominate. In this paper, inner reorganization is the studied object, and can be obtained by calculating the individual relaxation process energies for the neighboring segments. According to the theory, we obtained the total hole reorganization energy λ by calculating the optimized geometries in neutral and cationic states, the total energy of the cation state in the optimized neutral geometry, and the total energy of neutral state in the optimized geometry of the cation. The inner reorganization energy λi for holes could be calculated as follows:
| | | λhole = λ1 + λ2 = E+ − E+* + E* − E | (13) |
here we use
E and
E+* to represent the energies of the neutral segment and the cation segment, respectively. Both of them lie in the lowest energy geometries, while
E+ and
E* denote the energies of the neutral segment and the cation segment within the geometries of the cation segment and the neutral segment, respectively.
51 The other important parameter, the transfer integral, is generally calculated by employing the isolated method (direct approach),
80–82 which can be written as:
| | t = 〈φ0,site1HOMO|![[F with combining circumflex]](https://www.rsc.org/images/entities/i_char_0046_0302.gif) |φ0,site2HOMO〉 |φ0,site2HOMO〉 | (14) |
where
φsite1HOMO and
φsite2HOMO represent HOMOs of the two adjacent molecules 1 and 2 when no intermolecular interaction exists, and
is the Kohn–Sham–Fock matrix for the dimer; its density matrix is constructed from non-interacting molecular orbitals. In practice, the Fock matrix is
=
SCεC−1, where
S is the intermolecular overlap
C and
ε are the molecular orbital coefficients and energies from one-step diagonalization without any self-consistent field iteration, respectively. This approach is very simple and has been widely employed for organic molecular systems.
76,78–83 Other methods such as the minimal energy splitting method and site-energy correction method have been proved by Shuai and co-workers.
79,80,82,84 The computations are performed at the B97-D/6-31g(d) level. In order to obtain the hole mobility, we adopt an Einstein relation in the low field limit as follows:
| |  | (15) |
where
e is the electron charge and
D is the charge diffusion coefficient. For a
d-dimensional system,
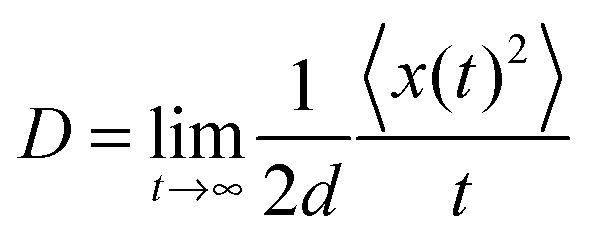
D is defined as the ratio between the mean-square displacement and the diffusion time:
85| | 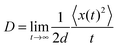 | (16) |
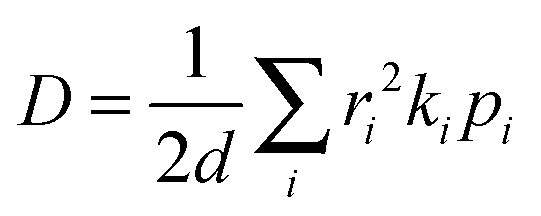
For a spatially isotropic system, the homogeneous diffusion constant
D can be approximately evaluated by:
86| | 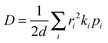 | (17) |
where
d is the spatial dimensionality,
i runs over all nearest adjacent molecules and
ri,
ki, and
pi are the corresponding centre-to-center hopping distance, charge transfer rate (
k), and hopping probability

, respectively. Furthermore, when considering only one neighbor, the diffusion constant along with a single molecular dimer is simply defined as:
78,87where
k and
r are the charge transfer rate and intermolecular distance for dimer. Herein, the hole mobility is expressed as:
86,88| |  | (19) |
The calculated transfer integral, inner reorganization energy, hole transport rates (
k), center-of-mass distances (
r), and hole mobilities (
μ) of all systems are listed in
Table 5. As shown in
Table 5, for the PCPDT-BT, PCPDT-FBT and PCPDT-CNBT, the values of the inner reorganization energy and transfer integral are in the order of PCPDT-BT = PCPDT-FBT > PCPDT-CNBT and PCPDT-BT < PCPDT-FBT < PCPDT-CNBT, respectively. The increase of transfer integral is associated with the electron-withdrawing effect of the fluorine atoms and cyano group in the copolymers which facilitate the interchain π stacking and electronic coupling. According to
eqn (12), a large transfer integral and a lower reorganization energy result in a relatively large transport rate. For this reason, the values of the hole transport rates are in the sequence PCPDT-BT < PCPDT-FBT < PCPDT-CNBT. The values of the hole mobilities are in the order PCPDT-BT (8.73 × 10
−4 cm
2 V
−1 s
−1) < PCPDT-FBT (2.32 × 10
−3 cm
2 V
−1 s
−1) < PCPDT-CNBT (3.67 × 10
−3 cm
2 V
−1 s
−1). The results showed that the introduction of a strong electron-withdrawing group to the copolymer can improve the hole transport ability of a polymer. There is a similar tendency for PDTPr-BT, PDTPr-FBT and PDTPr-1CNBT. The hole mobilities of PDTPr-BT, PDTPr-FBT and PDTPr-CNBT are 5.62 × 10
−5, 1.03 × 10
−4 and 8.05 × 10
−4 cm
2 V
−1 s
−1, respectively. Moreover, the calculated hole mobility of PCPDT-BT (8.73 × 10
−4 cm
2 V
−1 s
−1) and PDTPr-BT (5.62 × 10
−5 cm
2 V
−1 s
−1) agrees well with the experimental data of 1.0 × 10
−3 cm
2 V
−1 s
−1 and 6.41 × 10
−5 cm
2 V
−1 s
−1, respectively.
33,38 From the results obtained above, we deduced that the new designed polymers have a better hole mobility in comparison with PCPDT-BT and PDTPr-BT. Therefore, considering the abilities of hole transport, the newly designed polymers may provide a large
Jsc and FF, when applied to the BHJSCs.
Table 5 Computed transfer integrals t (meV), inner reorganization energies λ (eV), hole transport rates k, center-of-mass distances r (Å) and hole mobilities μ of all monomer models
| |
t
|
λ
|
k/s−1 |
r
|
μ
h/cm−2 V−1 s−1 |
| PCPDT-BT |
3.102 |
0.255 |
2.71 × 10¹⁰ |
4.073 |
8.73 × 10⁻⁴ |
| PCPDT-FBT |
5.176 |
0.255 |
7.54 × 10¹⁰ |
3.982 |
2.32 × 10⁻³ |
| PCPDT-1CNBT |
5.771 |
0.235 |
1.18 × 10¹¹ |
3.990 |
3.67 × 10⁻³ |
| PDTPr-BT |
0.706 |
0.239 |
1.69 × 10⁹ |
4.134 |
5.62 × 10⁻⁵ |
| PDTPr-FBT |
0.957 |
0.237 |
3.18 × 10⁹ |
4.078 |
1.03 × 10⁻⁴ |
| PDTPr-1CNBT |
2.537 |
0.220 |
2.73 × 10¹⁰ |
3.890 |
8.05 × 10⁻⁴ |
3.4 Predicted PCEs using the Scharber models
Generally, the polymer solar cells are based on the BHJ structure of a blend of conjugated polymer donors and fullerene derivative acceptors.1–3,71,89 The power conversion efficiencies reported for solar cell devices based on PCPDT-BT as the donor and the PC60BM as the acceptor are about 2.67–3.5%.29,31,33 The PCEs based on PCPDT-BT as the donor and the PC70BM as the acceptor have been in the range of 3.16–5.5%.29,63,90 The published PCEs of PDTPr-BT–PC60BM BHJSCs are 1.02–2.80%.36 As far as we know, there is no PCE data reported for BHJ solar cells made of PCPDT-FBT, PDTPr-FBT, PCPDT-1CNBT and PDTPr-1CNBT.
Recently, Ku25 has employed the Scharber diagrams16 to predict the PCEs of solar cells with D–A copolymer donors. They concluded that to a certain extent using Scharber diagrams to predict the PCE of the solar cell can give an accurate result consistent with the experimental data. In this work, for evaluating the newly designed polymers, we used the Scharber diagrams16 to predict PCEs (%) of the solar cells by combining each polymer and PC60BM. Scharber and coworkers16,25 presented a relationship between the PCE of the copolymer–PC60BM BHJSC and the electronic structure of the constituent donor polymer such as the band gap and energy levels (LUMO or HOMO level). As shown in Fig. 5, referring to the design rules proposed by Scharber and co-workers, one can estimate the PCE from the band gap and the LUMO values of the copolymers. This so-called Scharber diagram is based on the insight that efficient solar cell performance can be obtained by having a high open-circuit voltage (Voc, in Section 3.3.1) and high short-circuit current (Jsc, which is given by the integration of the solar spectrum for photon energies equal to or larger than the band gap of the donor) as well as a high fill factor (FF, which is assumed to be a constant value of 0.65).16,25 Other prerequisites are to assume a charge carrier mobility of 10−3 cm2 V−1 s−1 for the polymer donors.16 According to our calculation of transport properties (in Section 3.3.4), the hole mobilities of the newly designed polymers can reach these orders of magnitude (except for PDTPr-FBT). Therefore, it is reasonable to estimate the PCE% of solar cells made of the designed polymers using the Scharber diagrams in this system. We utilized these values in the Scharber design rules to estimate the PCE of the BHJSCs made of the copolymers (Fig. 5). The diagram indicates that the copolymer PCPDT-BT exhibits a higher efficiency (∼3.1%) than the copolymer PDTPr-BT (∼2.8%). The predicted PCEs (∼3.1% and ∼2.8%) of PCPDT-BT and PDTPr-BT are in good agreement with the experimental data (2.67–3.5%29,31,33 and 1.02–2.80%36). According to the Scharber diagram (Fig. 5), the PCEs of the four solar cell devices made by PCPDT-FBT, PDTPr-FBT, PCPDT-1CNBT, PDTPr-1CNBT and PC60BM are ∼4.5%, ∼4.2%, ∼7.2% and ∼6.8, respectively.
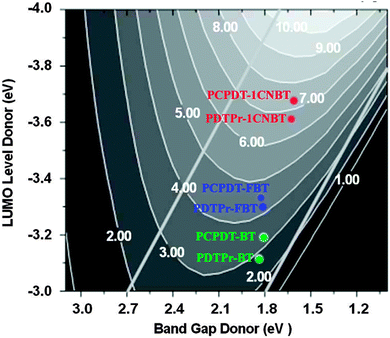 |
| | Fig. 5 Scharber diagrams to estimate power conversion efficiencies of the BHJSCs made of the copolymers (PCPDT-BT, PDTPr-BT) and the new designed copolymers. Adapted with permission from Copyright 2006 Wiley-VCH Verlag GmbH & Co. KGaA from the work of Scharber and coworkers (in ref. 16). | |
4. Conclusions
In this work, the electronic, optical and transport properties of the copolymers PCPDT-BT, PDTPr-BT and fluorine (cyano) substituted copolymers have been investigated using density functional theory (DFT) and time-dependent DFT. We proposed a reliable model of empirical correlations between theoretical and experimental HOMO and LUMO for a class of D–A copolymers can be used to accurately estimate the HOMO and LUMO energy levels of unknown conjugated polymers. The results show the empirical correlations we used in this paper reproduced the experimental HOMO and LUMO energy levels of PCPDT-BT and PDTPr-BT very well. The calculated results reveal that PCPDT-BT and PDTPr-BT exhibit a strong absorption of visible light in agreement with experimental findings. Predicted power conversion efficiencies (PCEs) of PCPDT-BT and PDTPr-BT are 3.1% and 2.8%, in agreement with the experimental data. The calculated results also reveal that adding two fluorine atoms or a –CN onto the copolymer can not only obviously reduce the HOMO and LUMO level of molecules which results in increasing the Voc in solar cells, but can also enhance the light-absorbing efficiency and charge transport ability of polymers. The fluorinated polymers PCPDT-FBT and PDTPr-FBT exhibit higher Voc, better hole mobility, and higher solar cell efficiency (∼4.5% and ∼4.2%, respectively) than corresponding copolymers PCPDT-BT and PDTPr-BT. Moreover, the cyano substituted copolymers PCPDT-1CNBT and PDTPr-1CNBT exhibit the highest Voc, the largest hole mobility (3.67 × 10⁻³ cm2 V−1 s−1 and 8.05 × 10⁻⁴ cm2 V−1 s−1, respectively) and the highest solar cell efficiency (∼7.2% and ∼6.8%, respectively) among all the corresponding systems. We presented several polymer donors for comparison of how the strong electron-withdrawing group can influence the electronic properties and optical absorption of polymers, and the performances of organic solar cells made of these polymers. Increasing the electron-withdrawing strength in D–A copolymers is an effective way to improve the electronic, optical and transport properties of the copolymers, thereby enhancing the performances of organic solar cells based on these polymers. Our conclusions are an attempt to provide a theoretical model for the introduction of an electron-withdrawing group into the copolymers. These results may provide structural guidelines for selecting a suitable electron-withdrawing group and optimizing the geometry of copolymer donors to be used for further improving the performance of donors in BHJSC applications.
Acknowledgements
This work was supported by National Natural Science Foundation of China (Grant No. 21073144), and by Fundamental Research Funds for the Central Universities (Grant No. XDJK2010B009).
References
- C. J. Brabec, S. Gowrisanker, J. J. M. Halls, D. Laird, S. Jia and S. P. Williams, Adv. Mater., 2010, 22, 3839–3856 CrossRef CAS PubMed.
- R. Fitzner, E. Mena-Osteritz, A. Mishra, G. Schulz, E. Reinold, M. Weil, C. Körner, H. Ziehlke, C. Elschner and K. Leo, J. Am. Chem. Soc., 2012, 134, 11064–11067 CrossRef CAS PubMed.
- H. H. Cho, T. E. Kang, K. H. Kim, H. Kang, H. J. Kim and B. J. Kim, Macromolecules, 2012, 45, 6415–6423 CrossRef CAS.
- R. Shahid Ashraf, J. Andrew and P. Shakya Tuladhar, Chem. Commun., 2012, 48, 7699–7701 RSC.
- Y. Yi, V. Coropceanu and J. L. Brédas, J. Am. Chem. Soc., 2009, 131, 15777–15783 CrossRef CAS PubMed.
- N. S. Sariciftci, L. Smilowitz, A. J. Heeger and F. Wudl, Science, 1992, 258, 1474–1476 CAS.
- D. M. Guldi and M. Prato, Acc. Chem. Res., 2000, 33, 695–703 CrossRef CAS PubMed.
- Y. Li, T. Pullerits, M. Zhao and M. Sun, J. Phys. Chem. C, 2011, 115, 21865–21873 CAS.
- H. Imahori, H. Yamada, D. M. Guldi, Y. Endo, A. Shimomura, S. Kundu, K. Yamada, T. Okada, Y. Sakata and S. Fukuzumi, Angew. Chem., Int. Ed., 2002, 41, 2344–2347 CrossRef CAS.
- K. M. Coakley and M. D. McGehee, Chem. Mater., 2004, 16, 4533–4542 CrossRef CAS.
- Y. Yi, V. Coropceanu and J. L. Brédas, J. Mater. Chem., 2011, 21, 1479–1486 RSC.
- V. Lemaur, M. Steel, D. Beljonne, J. L. Brédas and J. Cornil, J. Am. Chem. Soc., 2005, 127, 6077–6086 CrossRef CAS PubMed.
- Y. Li, Acc. Chem. Res., 2012, 45, 723–733 CrossRef CAS PubMed.
- S. Xiao, H. Zhou and W. You, Macromolecules, 2008, 41, 5688–5696 CrossRef CAS.
- Y. Zhang, J. Zou, C.-C. Cheuh, H.-L. Yip and A. K.-Y. Jen, Macromolecules, 2012, 45, 5427–5435 CrossRef CAS.
- M. C. Scharber, D. Mühlbacher, M. Koppe, P. Denk, C. Waldauf, A. J. Heeger and C. J. Brabec, Adv. Mater., 2006, 18, 789–794 CrossRef CAS.
- K. Seki, S. Traytak and M. Tachiya, J. Chem. Phys., 2003, 118, 669–679 CrossRef CAS.
- P. Song, Y. Li, F. Ma, T. N. Pullerits and M. Sun, J. Phys. Chem. C, 2013, 117, 15879–15889 CAS.
- Y. Shang, Q. Li, L. Meng, D. Wang and Z. Shuai, Theor. Chem. Acc., 2011, 129, 291–301 CrossRef CAS.
- S. Beaupré, M. Belletête, G. Durocher and M. Leclerc, Macromol. Theory Simul., 2011, 20, 13–18 CrossRef.
- N. Blouin, A. Michaud, D. Gendron, S. Wakim, E. Blair, R. Neagu-Plesu, M. Belletête, G. Durocher, Y. Tao and M. Leclerc, J. Am. Chem. Soc., 2008, 130, 732–742 CrossRef CAS PubMed.
- Y. J. Cheng, S. H. Yang and C. S. Hsu, Chem. Res., 2009, 109, 5868–5923 CAS.
- B. C. Thompson and J. M. J. Fréchet, Angew. Chem., Int. Ed., 2008, 47, 58–77 CrossRef CAS PubMed.
- H. Van Mullekom, J. Vekemans, E. Havinga and E. Meijer, Mater. Sci. Eng., R, 2001, 32, 1–40 CrossRef.
- J. Ku, Y. Lansac and Y. H. Jang, J. Phys. Chem. C, 2011, 115, 21508–21516 CAS.
- P. Coppo and M. L. Turner, J. Mater. Chem., 2005, 15, 1123–1133 RSC.
- S. Zhang, Y. Guo, H. Fan, Y. Liu, H. Y. Chen, G. Yang, X. Zhan, Y. Li and Y. Yang, J. Polym. Sci., Polym. Chem. Ed., 2009, 47, 5498–5508 CrossRef CAS.
- J. Peet, J. Kim, N. E. Coates, W. L. Ma, D. Moses, A. J. Heeger and G. C. Bazan, Nat. Mater., 2007, 6, 497–500 CrossRef CAS PubMed.
- D. Mühlbacher, M. Scharber, M. Morana, Z. Zhu, D. Waller, R. Gaudiana and C. Brabec, Adv. Mater., 2006, 18, 2884–2889 CrossRef.
- C. Soci, I.-W. Hwang, D. Moses, Z. Zhu, D. Waller, R. Gaudiana, C. J. Brabec and A. J. Heeger, Adv. Funct. Mater., 2007, 17, 632–636 CrossRef CAS.
- J. Y. Kim, K. Lee, N. E. Coates, D. Moses, T. Q. Nguyen, M. Dante and A. J. Heeger, Science, 2007, 317, 222–225 CrossRef CAS PubMed.
- H. Ebata, T. Izawa, E. Miyazaki, K. Takimiya, M. Ikeda, H. Kuwabara and T. Yui, J. Am. Chem. Soc., 2007, 129, 15732–15733 CrossRef CAS PubMed.
- Z. Zhu, D. Waller, R. Gaudiana, M. Morana, D. Mühlbacher, M. Scharber and C. Brabec, Macromolecules, 2007, 40, 1981–1986 CrossRef CAS.
- I. W. Hwang, C. Soci, D. Moses, Z. Zhu, D. Waller, R. Gaudiana, C. J. Brabec and A. J. Heeger, Adv. Mater., 2007, 19, 2307–2312 CrossRef CAS.
- M. Koppe, H. J. Egelhaaf, G. Dennler, M. C. Scharber, C. J. Brabec, P. Schilinsky and C. N. Hoth, Adv. Funct. Mater., 2010, 20, 338–346 CrossRef CAS.
- W. Yue, Y. Zhao, S. Shao, H. Tian, Z. Xie, Y. Geng and F. Wang, J. Mater. Chem., 2009, 19, 2199–2206 RSC.
- G. Gibson, T. McCormick and D. Seferos, J. Am. Chem. Soc., 2011, 134, 539–547 CrossRef PubMed.
- S. C. Price, A. C. Stuart and W. You, Macromolecules, 2010, 43, 797–804 CrossRef CAS.
- J. Z. Yong Zhang, C.-C. Cheuh, H.-L. Yip and A. K.-Y. Jen, Macromolecules, 2012, 45, 5427–5435 CrossRef.
- H. Zhou, L. Yang, A. C. Stuart, S. C. Price, S. Liu and W. You, Angew. Chem., Int. Ed., 2011, 123, 3051–3054 CrossRef.
- S. C. Price, A. C. Stuart, Y. Liqiang, Z. Huaxing and W. You, J. Am. Chem. Soc., 2011, 133, 4625–4631 CrossRef CAS PubMed.
- J. Hou, M. H. Park, S. Zhang, Y. Yao, L. M. Chen, J. H. Li and Y. Yang, Macromolecules, 2008, 41, 6012–6018 CrossRef CAS.
- A. D. Becke, J. Chem. Phys., 1993, 98, 5648–5652 CrossRef CAS.
- C. Lee, W. Yang and R. G. Parr, Phys. Rev. B: Condens. Matter Mater. Phys., 1988, 37, 785–789 CrossRef CAS.
- A. J. Cohen, P. Mori-Sánchez and W. Yang, Chem. Res., 2012, 112, 289–320 CAS.
- L. M. Tolbert, Acc. Chem. Res., 1992, 25, 561–568 CrossRef CAS.
- R. E. Stratmann, G. E. Scuseria and M. J. Frisch, J. Chem. Phys., 1998, 109, 8218–8224 CrossRef CAS.
- R. Bauernschmitt and R. Ahlrichs, Chem. Phys. Lett., 1996, 256, 454–464 CrossRef CAS.
- M. E. Casida, C. Jamorski, K. C. Casida and D. R. Salahub, J. Chem. Phys., 1998, 108, 4439–4449 CrossRef CAS.
- S. Tang and J. Zhang, J. Phys. Chem. A, 2011, 115, 5184–5191 CrossRef CAS PubMed.
- B. C. Lin, C. P. Cheng and Z. P. M. Lao, J. Phys. Chem. A, 2003, 107, 5241–5251 CrossRef CAS.
- Y. K. Lan, C. H. Yang and H. C. Yang, Polym. Int., 2010, 59, 16–21 CrossRef CAS.
- S. Grimme, J. Comput. Chem., 2006, 27, 1787–1799 CrossRef CAS PubMed.
- S. Grimme, J. Chem. Phys., 2006, 124, 034108 CrossRef PubMed.
-
M. J. Frisch, G. W. Trucks, H. B. Schlegel, G. E. Scuseria, M. A. Robb, J. R. Cheeseman, G. Scalmani, V. Barone, B. Mennucci, G. A. Petersson and H. Nakatsuji, et al., Gaussian 09, Revision A.01., Gaussian, Inc., Wallingford, CT, 2009 Search PubMed.
- T. Le Bahers, C. Adamo and I. Ciofini, J. Chem. Theory Comput., 2011, 7, 2498–2506 CrossRef CAS.
- I. Ciofini, T. Le Bahers, C. Adamo, F. Odobel and D. Jacquemin, J. Phys. Chem. C, 2012, 116, 11946–11955 CAS.
- M. Guo, R. He, Y. Dai, W. Shen, M. Li, C. Zhu and S. H. Lin, J. Phys. Chem. C, 2012, 116, 9166–9179 CAS.
-
T. Lu, Multiwfn 2.1, http://multiwfn.codeplex.com/.
- J. Hou, T. L. Chen, S. Zhang and Y. Yang, J. Phys. Chem. C, 2009, 113, 1601–1605 CAS.
- J. Min, Z.-G. Zhang, S. Zhang, M. Zhang, J. Zhang and Y. Li, Macromolecules, 2011, 44, 7632–7638 CrossRef CAS.
- J. Hou, H. Y. Chen, S. Zhang, G. Li and Y. Yang, J. Am. Chem. Soc., 2008, 130, 16144–16145 CrossRef CAS PubMed.
- S. Albrecht, S. Schäfer, I. Lange, S. Yilmaz, I. Dumsch, S. Allard, U. Scherf, A. Hertwig and D. Neher, Org. Electron., 2012, 13, 615–622 CrossRef CAS PubMed.
- Y. Zou, A. Najari, P. Berrouard, S. Beaupré, B. Réda Aîch, Y. Tao and M. Leclerc, J. Am. Chem. Soc., 2010, 132, 5330–5331 CrossRef CAS PubMed.
- M. E. Köse, J. Phys. Chem. A, 2012, 116, 12503–12509 CrossRef PubMed.
- J. Zhang, H.-B. Li, S.-L. Sun, Y. Geng, Y. Wu and Z.-M. Su, J. Mater. Chem., 2012, 22, 568–576 RSC.
- S. Kowalski, S. Allard and U. Scherf, ACS Macro Lett., 2012, 1, 465–468 CrossRef CAS.
- A. Franceschetti and A. Zunger, Phys. Rev. Lett., 1997, 78, 915–918 CrossRef CAS.
- C. G. Zhen, U. Becker and J. Kieffer, J. Phys. Chem. A, 2009, 113, 9707–9714 CrossRef CAS PubMed.
- M. Baldo and M. Segal, Phys. Status Solidi A, 2004, 201, 1205–1214 CrossRef CAS.
- V. I. Arkhipov, P. Heremans and H. Bassler, Appl. Phys. Lett., 2003, 82, 4605–4607 CrossRef CAS.
- B. P. Rand, J. Genoe, P. Heremans and J. Poortmans, Prog. Photovoltaics, 2007, 15, 659–676 CAS.
- G. D. Scholes and G. Rumbles, Nat. Mater., 2006, 5, 683–696 CrossRef CAS PubMed.
- M. Zhang, H. Tsao, W. Pisula, C. Yang, A. Mishra and K. Mullen, J. Am. Chem. Soc., 2007, 129, 3472 CrossRef CAS PubMed.
- M. E. Köse, J. Phys. Chem. C, 2011, 115, 13076–13082 Search PubMed.
- X.-Y. Zhang and G.-J. Zhao, J. Phys. Chem. C, 2012, 116, 13858–13864 CAS.
- R. A. Marcus, Angew. Chem., Int. Ed., 1993, 32, 1111–1121 CrossRef.
- L. Wang, G. Nan, X. Yang, Q. Peng, Q. Li and Z. Shuai, Chem. Soc. Rev., 2010, 39, 423–434 RSC.
- C. Wang, F. Wang, X. Yang, Q. Li and Z. Shuai, Org. Electron., 2008, 9, 635–640 CrossRef CAS PubMed.
- S. Yin, Y. Yi, Q. Li, G. Yu, Y. Liu and Z. Shuai, J. Phys. Chem. A, 2006, 110, 7138–7143 CrossRef CAS PubMed.
- S. Yin and Y. Lv, Org. Electron., 2008, 9, 852–858 CrossRef CAS PubMed.
- X. Yang, L. Wang, C. Wang, W. Long and Z. Shuai, Chem. Mater., 2008, 20, 3205–3211 CrossRef CAS.
- L. Wang and H. Zhang, J. Phys. Chem. C, 2011, 115, 20674–20681 CAS.
- X. Yang, Q. Li and Z. Shuai, Nanotechnology, 2007, 18, 424029 CrossRef PubMed.
- J. Bisquert, Phys. Chem. Chem. Phys., 2008, 10, 3175–3194 RSC.
- W. Q. Deng and W. A. Goddard III, J. Phys. Chem. B, 2004, 108, 8614–8621 CrossRef CAS.
- M. Y. Kuo, H. Y. Chen and I. Chao, Chem.–Eur. J., 2007, 13, 4750–4758 CrossRef CAS PubMed.
- V. Coropceanu, J. Cornil, D. da Silva, Y. Olivier, R. Silbey and J. Bredas, Chem. Res., 2007, 107, 926–952 CAS.
- E. Bundgaard and F. C. Krebs, Sol. Energy Mater. Sol. Cells, 2007, 91, 954–985 CrossRef CAS PubMed.
- J. K. Lee, W. L. Ma, C. J. Brabec, J. Yuen, J. S. Moon, J. Y. Kim, K. Lee, G. C. Bazan and A. J. Heeger, J. Am. Chem. Soc., 2008, 130, 3619–3623 CrossRef CAS PubMed.
Footnote |
| † Electronic supplementary information (ESI) available: Calculations of the orbital energy levels (HOMO and LUMO) and band gap (Eg) of monomer and dimer models at the B3LYP/6-31G(d) level, the empirical correlations between the theoretical energy levels and experimental energy levels, and some important parameters including total densities of states (TDOS) and projected DOS (PDOS) for monomer models, molecular orbital spatial distribution, the π-stacking of the monomers, etc. See DOI: 10.1039/c3cp53268b |
|
| This journal is © the Owner Societies 2014 |
Click here to see how this site uses Cookies. View our privacy policy here. 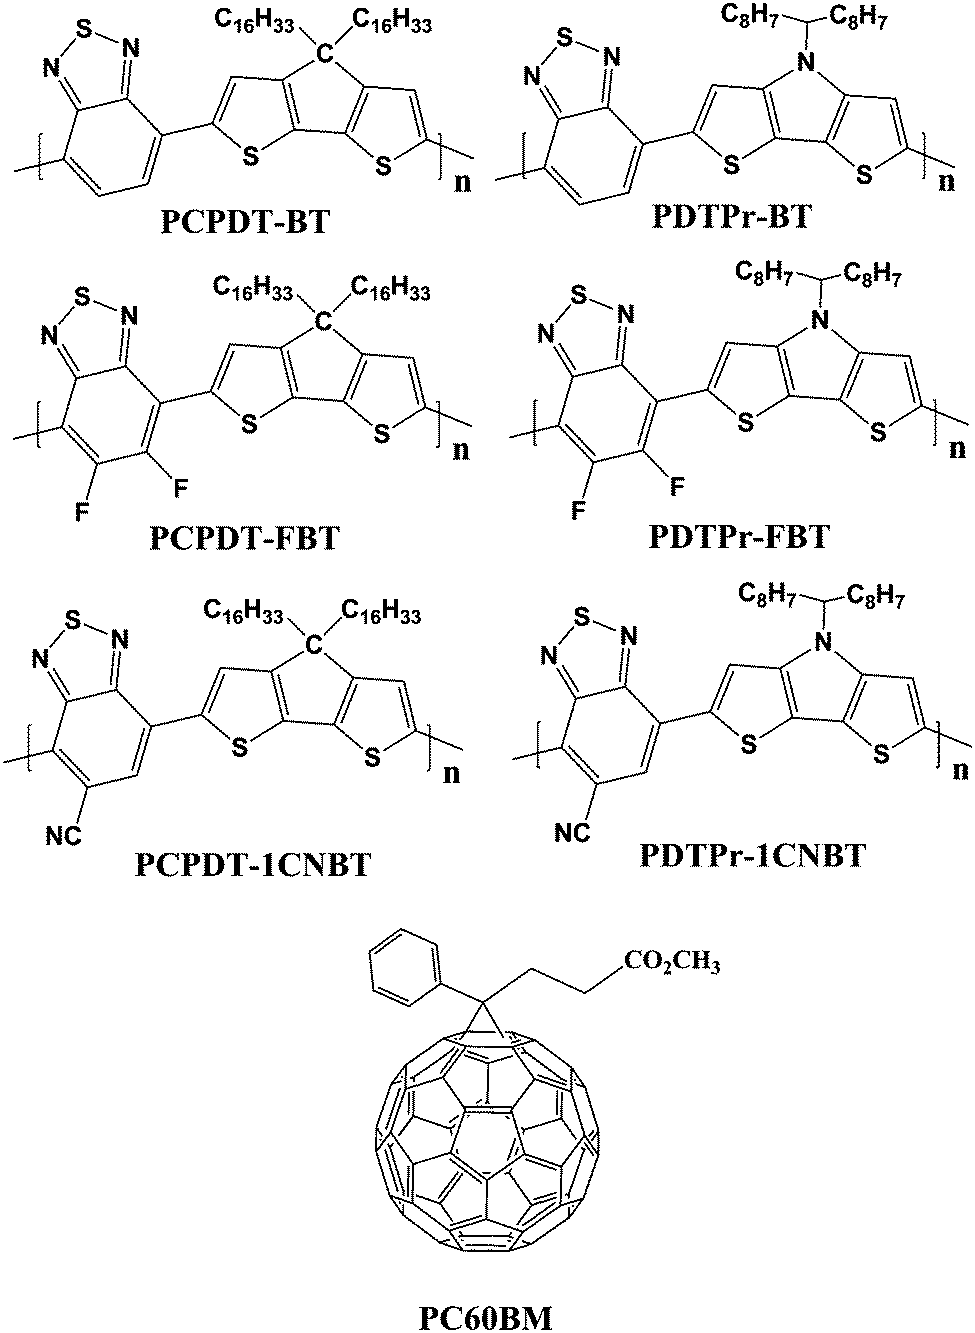

 is the contribution of the electron transition model to this absorption peak, ρm and ρn are the electron densities of the participating molecular orbital relative to the transitions.
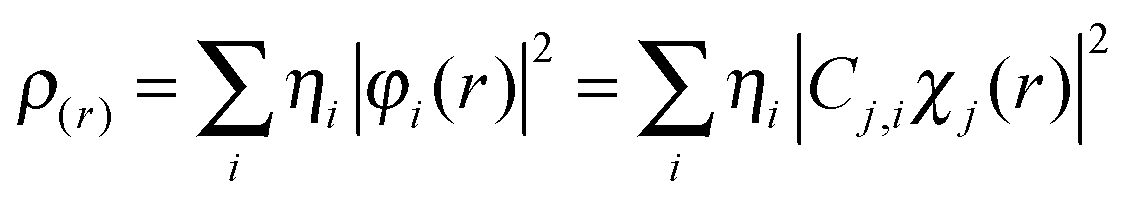


 , respectively. Furthermore, when considering only one neighbor, the diffusion constant along with a single molecular dimer is simply defined as:78,87
