Selective epichlorohydrin-sensing performance of Ag nanoparticles decorated porous SnO2 architectures†
Zhenglin
Zhang
ab,
Haiyan
Song
b,
Shishu
Zhang
b,
Junyan
Zhang
b,
Wenya
Bao
b,
Quanqin
Zhao
*b and
Xiang
Wu
*ab
aKey Laboratory for Photonic and Electronic Bandgap Materials, Ministry of Education and College of Chemistry and Chemical Engineering, Harbin Normal University, Harbin 150025, PR China. E-mail: wuxiang05@gmail.com
bKey Laboratory for Colloid & Interface Chemistry of Education Ministry, Department of Chemistry, Shandong University, Shandong, Jinan, 250100, PR China. E-mail: zhaoqq@sdu.edu.cn
First published on 8th October 2013
Abstract
Epichlorohydrin (ECH) is mainly an industrial raw material, while it is toxic and dangerous for human health, so finding a simple and effective method for detecting ECH gas is challenging work. Porous SnO2 structures are successfully obtained through a hydrothermal method using SnCl4·5H2O as the tin source and water as the solvent. Ag nanoparticle (NPs) decorated porous SnO2 structures have also been prepared by the impregnation method. The morphology and structure of the as-prepared products were characterized by X-ray diffraction (XRD), scanning electron microscopy (SEM), transmission electron microscopy (TEM) and the nitrogen adsorption–desorption technique. The as-synthesized nanostructures, with diameters ranging from 4–5 μm, are composed of porous nanosheets with an average thickness of 60 nm. The gas sensing properties of the Ag NPs decorated porous SnO2 structures for ECH gas were investigated in detail, and the results showed that the 10% Ag NPs decorated porous SnO2 structures gas sensor was the optimum sensor, demonstrating a response (S = 50) for 100 ppm of ECH gas, while the working temperature was decreased by about 180 °C. In addition, it showed a low detection level (0.5 ppm) for ECH gas, good reproducibility and repeatability, and long-term stability, implying a promising application in detecting ECH gas.
Introduction
Semiconductor gas sensors have been applied in the detection of volatile organic compounds (VOCs) due to their fast, high sensitivity and low cost characteristics.1–4 Tin dioxide, as a well-known wide band gap semiconductor (Eg = 3.6 eV at 300 K), is considered the most promising functional material due to its highly sensitive gas-sensing.5–8 However, SnO2 can react with several gases simultaneously, so the poor selectivity hinders its practical application.9 Doping with noble metal nanomaterials is an important and effective approach to improve the gas-sensing selectivity and high response of semiconductors.10–13 Kim et al. reported Pd nanoparticle-loaded SnO2 nanofibers showing excellent sensitivity and selectivity to H2 gas, which can be attributed to the catalytic effect of the PdO nanocrystallites in promoting the oxidation of H2 to H2O and enhancing electron depletion at the surface of the SnO2 crystallites.14 Ju's group investigated 0.08 wt% Pt doped SnO2 nanofiber sensors on micro heater platforms and exhibited superior H2S gas sensing characteristics, which are explained by the catalytic promotion effect of Pt.15Epichlorohydrin (1-chloro-2,3-epoxypropane, ECH, the structural formulae of epichlorohydrin can be observed in Fig. S1 in the ESI†) is mainly used in the production of epoxy resins, synthetic glycerol, and elastomers.16,17 However, ECH is toxic by inhalation and dermal and oral absorption and can be dangerous for the central nervous system.18,19 Exposure to ECH in the workplace can rapidly irritate the eyes, skin and respiratory tract of workers. At high levels of exposure, nausea, vomiting, labored breathing, inflammation of the lungs, pulmonary edema, and renal lesions may emerge.20 In particular, people who drink water containing high levels of ECH over a long period of time could engender stomach problems and may have an increased risk of getting cancer.21,22 The Occupational Safety and Health Administration (OSHA) recommend that the exposure limit is 19 mg m−3 (5 ppm) for 8-hour time weighted average (TWA) standard.23 The National Institute of Occupational Safety and Health's (NIOSH) recommended exposure limit is to ensure that a worker can escape from an exposure condition that is likely to cause death or immediate or delayed permanent adverse health effects or prevent escape to the environment.24 As a result, the requirement for the fast detection of low concentrations of ECH is becoming more and more urgent. Gas chromatography, gas chromatography–mass spectrometry, solid phase microextraction and headspace gas chromatography methods have been developed and validated for the determination for ECH.25–30 Metal oxide based chemiresistive gas sensors are easy to incorporate into portable real-time detectors of ECH gas because of their miniaturized size, low cost, simplicity of fabrication, and fast operation.31–33
In the present study, Ag NPs decorated porous SnO2 structures as low concentration ECH gas sensing detectors were studied. The phase structures and morphologies of the as-prepared product were analyzed by X-ray diffraction, SEM, TEM and nitrogen adsorption–desorption isotherms. The effects of the Ag content and working temperature on the ECH gas sensing properties were investigated in detail. The results indicated that the 10% Ag NPs catalyst on porous SnO2 structures sensor can be applied in an ECH detector and public safety investigation.
Experimental section
Materials
All the reagents were of analytical grade and used without further purification: L-cysteine (C3H7NO2S, Aladdin), stannic chloride, pentahydrate (SnCl4·5H2O, Sinopharm Chemical Reagent Co., Ltd. Shanghai, China), silver nitrate (AgNO3, Sinopharm Chemical Reagent Co., Ltd. Shanghai, China).Synthesis of the porous SnO2 structures
Here, we used a one-step hydrothermal route by simply controlling the temperature and dosage to get porous SnO2 structures.34 In a typical experiment, L-cysteine (0.4840 g, 2 mmol) was dispersed in deionized water (25 mL) to form a clear solution, then SnCl4·5H2O (0.7010 g, 2 mmol) was added into the above solution under vigorous stirring. After being stirred for 15 min, the solutions were transferred to a 50 mL Teflon-sealed autoclave and maintained at 180 °C for 10 h. The black products were isolated by centrifugation, washed with deionized water and ethanol three times and finally dried at 80 °C for 8 h. Finally, porous SnO2 structures were obtained by annealing the precursor at 700 °C for 2 h in an air atmosphere.Synthesis of the Ag nanoparticle decorated porous SnO2 structures
Ag-doped porous SnO2 structures were prepared as reported by the impregnation method.35 A mixture of SnO2 (0.2220 g) and AgNO3 (0.0175, 0.0350, 0.0525 g, w–w 5%, 10%, 15%) in 5 mL of deionized water was stirred magnetically for 24 h at room temperature, and the resulting precipitated solid was dried at 100 °C.Characterization
The as-synthesized products were characterized by an X-ray diffraction instrument (Rigaku Dmax-rB, Cu–Kα radiation, λ = 0.1542 nm, 40 KV, 100 mA). The morphology and structure of the as-synthesized SnO2 structures were studied using a JEOL JSM-6700F field emission scanning electron microscope (SEM), and high-resolution transmission electron microscope (HRTEM JEM-2100, 200 kV). The specific surface area was estimated using the Brunauer–Emmett–Teller (BET) method based on the nitrogen adsorption isotherm (77 K) using a NAVA 2000e surface area and pore size analyzer (Quantachrome instruments, USA), and the pore sizes were calculated using Barrett–Joyner–Halenda (BJH) models from the adsorption branches of the adsorption–desorption isotherms. The sample was degassed at 200 °C for 12 h in a vacuum prior to the measurements. The gas-sensing properties of the samples were determined using a China WS-30A gas sensitivity instrument.Fabrication and measurement of the gas sensors
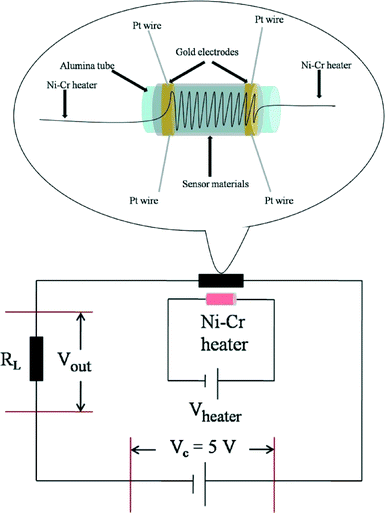
The gas sensor was fabricated as follows: the powders were mixed with water, and then coated onto an Al2O3 tube on which two platinum wires had been installed at each end. The structure of the sensor is shown in Scheme 1. The operating temperature was controlled by adjusting the heating power using a Ni–Cr alloy coil placed through the tube to heat the sensing material. The sensing element was aged at 300 °C for 7 days in order to improve its stability and repeatability. The gas sensitivity, S, was defined as the ratio Ra/Rg, where Ra was the resistance measured in air and Rg was that measured in the tested gas atmosphere. The response and recovery times were defined as the time to reach 90% of the final signal. The relation between S and the voltage is as follows:U c is the testing voltage (Uc = 5 V), RL is the load resistance, Ia, Ua, and Ra are the electrical parameters in air, Ig, Ug, and Rg are the electrical parameters in the gas.
Results and discussion
Fig. 1 shows a typical XRD pattern of the Ag NPs decorated porous SnO2 structures with different Ag (0–15%) doping content. All the diffraction peaks of the pure SnO2 structures can be indexed to the tetragonal rutile SnO2 structure (JCPDS card no. 41-1445, α0 = 4.738 Å and c0 = 3.188 Å). No characteristic peaks were observed for other impurities, revealing the high purity of the prepared SnO2 microstructures. Because the amount of Ag NPs doped in the SnO2 structures is too small, the XRD pattern of 5% Ag NPs doped SnO2 shows almost no change compared with that of the pure SnO2 products. However, in the cases of the 10% and 15% Ag-doped SnO2 products, the Ag peaks can be clearly observed at angles of around 38.1, 44.3 and 81.5 (JCPDS no. 87-0717), further indicating the formation of Ag NPs decorated porous SnO2 products.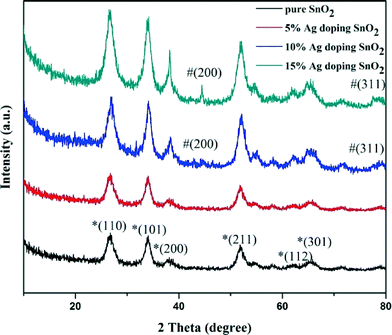 | ||
| Fig. 1 The XRD patterns of 0%, 5%, 10%, and 15% Ag NPs doped porous SnO2 samples. The XRD peaks of SnO2 (JCPDS no. 41-1445) are marked with “*”, and Ag (JCPDS no. 87-0717) are marked with “#”. | ||
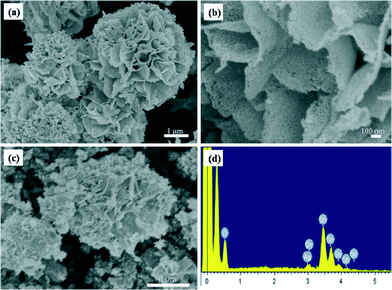
The morphology and size of the as-synthesized SnO2 products are characterized by SEM. A typical low magnification SEM image is shown in Fig. 2a, revealing a flower-like structure with average diameters of 4–5 μm, and large quantities of porous SnO2 products can be observed in Fig. S2 in the ESI.† In addition, these nanostructures consist of some nanoporous nanosheets with average thicknesses of 60 nm, as shown in Fig. 2b. The porous character may be attributed to the fact that the SnO2 nanoparticles have a strong tendency to aggregate with each other to minimize their surface energy in the annealing process.36
After impregnating with a AgNO3 aqueous solution, the flower-like structures are coarser than those of pure SnO2. It could also be seen from Fig. 2c that there are many Ag NPs on the surface of the SnO2 products. The as-synthesized nanostructure was examined using the energy dispersive X-ray spectrum (EDS), as shown in Fig. 2d. It can be clearly seen that three elements (Ag, Sn, and O) exist in this area. Similar EDS results have also been obtained in many different areas, which further confirm that the Ag NPs are uniformly distributed in the whole sample.
Further detailed structural analysis of the porous SnO2 products was characterized using TEM. The typical TEM image in Fig. 3a shows that the shape of the as-synthesized product was similar to that of the SEM observation. A high-magnification TEM image (Fig. 3b) revealed numerous pores and that the nanosheets consist of many nanoparticles. A high resolution TEM image of the porous SnO2 product shows resolved fringes separated by 0.335 nm and 0.265 nm, corresponding to the (110) and (101) lattice spacing of a tetragonal SnO2 crystal, respectively. From the inset of Fig. 3c, it is clear that the nanosheets exhibit an almost polycrystalline diffraction pattern.
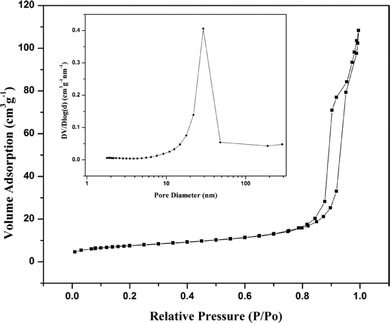
To further examine the porous structure of the SnO2 products, nitrogen adsorption–desorption isotherms and the corresponding Barrett–Joyner–Halenda (BJH) pore diameter distribution were measured to obtain information about the nature of the porosity, as shown in Fig. 4. It reveals that the isotherm of the as-synthesized SnO2 products is a typical isotherm with H3-type hysteresis loops37 and the porous SnO2 products possess a mesoporous (2–50 nm) structure. The BET specific surface area is 26.60 m3 g−1. The pore size distribution demonstrates the material contains a mesoporous structure with an average pore size centered at about 22.41 nm. Due to the large surface area and porous structure, the nanostructures have an advantage for gas adsorption–desorption and gas molecular diffusion, indicating potential applications in gas sensors with enhanced gas-sensing performance.
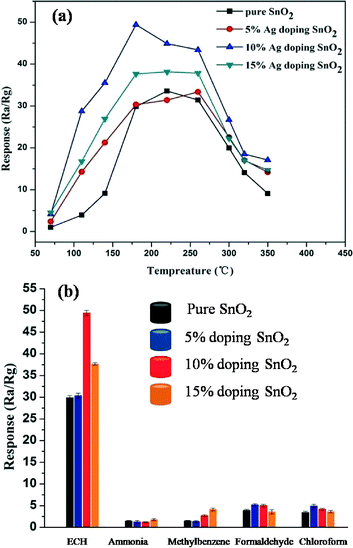
In order to evaluate the unique characteristics of the porous SnO2 products with the catalytic role of the Ag NPs, we investigated the Ag NPs decorated porous SnO2 products gas sensing performance to detect some dangerous gases in production processes. Fig. 4a shows the different Ag NPs doped content sensors responses to 100 ppm of ECH gas at different operating temperatures. The optimal working temperature and the corresponding response for the 0%, 5%, 10%, 15% Ag NPs decorated porous SnO2 product gas sensors are 220 °C and 34, 260 °C and 33, 180 °C and 50, and 220 °C and 38.1, respectively. The result indicates that the highest response (S = 50) is for the 10% Ag NPs doped porous SnO2 products at an optimum operation temperature of about 180 °C. In addition, Fig. S3 in the ESI† shows an XRD pattern of the Ag NPs doped porous SnO2 products before and after the heat treatment at 180 °C for 24 h, which is the optimum temperature of the gas sensing detection. The Ag phase doesn't transform before and after the heat treatment.
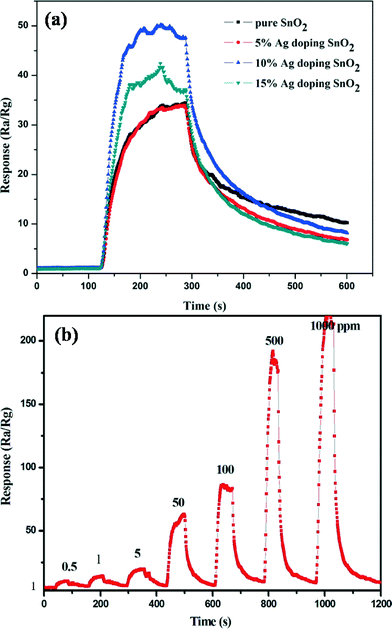
To further confirm the sensing properties of the as-synthesized Ag NPs doped porous SnO2 product sensors, five typical gases (ECH, ammonia, methylbenzene, formaldehyde, and chloroform in production processes) were selected as target gases to investigate the gas response at 180 °C, where the concentration of all the tested gases is 100 ppm. The results shown in Fig. 5b demonstrate that the Ag NPs doped SnO2 product sensors show excellent selectivity to ECH, whereas they present low responses to the other typical interference gases at the same temperature, especially the 10% Ag NPs doped SnO2 product sensor. This indicates that the sensor has quite excellent selectivity towards ECH gas, which can be attributed to the catalytic promotion effect of the Ag NPs. Fig. 6a presents the response transients of different gas sensors exposed to 100 ppm of ECH gas at an operating temperature of 180 °C. The response time and recovery time of the 0%, 5%, 10% and 15% Ag NPs doped SnO2 nanostructure gas sensors were calculated to be 17s and 287s, 16s and 238s, 16s and 186s, and 15s and 183s, respectively. Furthermore, the 10% Ag doped SnO2 sensor exhibits the highest response and a good response time and recovery time among all the samples. The real-time response curve of the 10% Ag-doped porous SnO2 sensors at 180 °C for different concentrations of ECH is shown in Fig. 6b. It is obvious that the structures have a good response to ECH. At a low concentration of 0.5 ppm of ECH, the response value is about 7.38, and the sensitivity increases at elevated concentrations of the target gases. So the OSHA's exposure limit of ECH can be detected easily.23
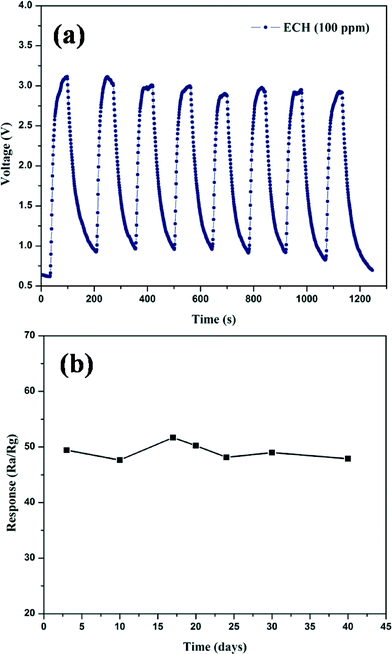
The reproducibility and repeatability of the sensor, as an important element,38 was measured. Fig. 7a shows the repeating response of the 10% Ag NPs doped porous SnO2 product based sensor. The sensor was tested 8 times with 100 ppm of ECH gas at 180 °C. No obvious variations in the sensor sensitivity were observed. The sensor finally recovered fully after removing the ECH gas, indicating the good reproducibility and repeatability of the sensor to ECH gas. The stability of the sensors was also investigated. The sensing property of the 10% Ag NPs engineered porous SnO2 product sensor was tested at 180 °C for 100 ppm of ECH in 50 days. Fig. 7b showed that the sensor exhibited good long-term stability, fulfilling the requirements for gas sensor applications. These results indicate that the sensor can potentially be applied in ECH detectors and public safety investigation.
Conclusion
In summary, a simple hydrothermal technique was demonstrated for the synthesis of porous SnO2 products with a diameter of 4–5 μm, which were composed of porous nanosheets with an average thicknesses of 60 nm. Ag NPs decorated porous SnO2 products were obtained by the impregnation method. The obtained nanostructures exhibited an excellent gas sensing performance towards ECH gas. The 10% Ag NPs engineered SnO2 product gas sensor shows the best performance, demonstrating a high response, good selectivity, short response and recovery time and a very low detection limit (0.5 ppm) for ECH gas. Additionally, it shows the sensor has good reproducibility and repeatability, and long-term stability for ECH gas, proving to be a promising material for ECH detection in practical applications.Acknowledgements
This work was supported by the Foundation for Key Project of Ministry of Education, China (no. 211046), the Program for New Century Excellent Talents in Heilongjiang Provincial University (1252-NCET-018), the Scientific Research Fund of Heilongjiang Provincial Education Department (12531179) and the Program for Scientific and Technological Innovation Team Construction in Universities of Heilongjiang (no. 2011TD010).Notes and references
- Z. P. Li, W. X. Pan, D. J. Zhang and J. H. Zhan, Chem.–Asian J., 2010, 5, 1854 CrossRef CAS PubMed.
- H. M. Aliha, A. A. Khodadadi and Y. Mortazavi, Sens. Actuators, B, 2013, 181, 637 CrossRef CAS PubMed.
- Z. H. Jing and J. H. Zhan, Adv. Mater., 2008, 20, 4547 CrossRef CAS.
- W. Guo, X. C. Duan, Y. Shen, K. Z. Qi, C. Y. Wei and W. J. Zheng, Phys. Chem. Chem. Phys., 2013, 15, 11221 RSC.
- Y. E. Chang, D. Y. Youn, G. Ankonina, D. J. Yang, H. G. Kim, A. Rothschild and I. D. Kim, Chem. Commun., 2009, 4019 RSC.
- Q. Kuang, C. S. Lao, Z. L. Wang, Z. X. Xie and L. S. Zheng, J. Am. Chem. Soc., 2007, 129, 6070 CrossRef CAS PubMed.
- R. Yogamalar, V. Mahendran, R. Srinivasan, A. Beitollahi, R. P. Kumar, A. C. Bose and A. Vinu, Chem.–Asian J., 2010, 5, 2379 CrossRef CAS PubMed.
- G. H. Lu, L. E. Ocola and J. H. Chen, Adv. Mater., 2009, 21, 2487 CrossRef CAS.
- C. C. Wang, S. A. Akbar and M. J. Madou, J. Electroceram., 1998, 2, 273 CrossRef CAS.
- M. Epifani, T. Andreu, R. Zamani, J. Arbiol, E. Comini, P. Siciliano, G. Faglia and J. R. Morante, CrystEngComm, 2012, 14, 3882 RSC.
- L. Xu, R. Q. Xing, J. Song, W. Xu and H. W. Song, J. Mater. Chem. C, 2013, 1, 2174 RSC.
- X. Chen, Z. Guo, W. H. Xu, H. B. Yao, M. Q. Li, J. H. Liu, X. J. Huang and S. H. Yu, Adv. Funct. Mater., 2011, 21, 2049 CrossRef CAS.
- J. Zhang, X. H. Liu, S. H. Wu, M. J. Xu, X. Z. Guo and S. R. Wang, J. Mater. Chem., 2010, 20, 6453 RSC.
- D. J. Yang, I. Kamienchick, D. Y. Youn, A. Rothschild and I. D. Kim, Adv. Funct. Mater., 2010, 20, 4258 CrossRef CAS.
- K. Y. Dong, J. K. Choi, I. S. Hwang, J. W. Lee, B. H. Kang, D. J. Ham, J. H. Lee and B. K. Ju, Sens. Actuators, B, 2011, 157, 154 CrossRef CAS PubMed.
- U.S.E.P. Agency, Health and Environmental Effects Profile for Epichlorohydrin,U.S. Environmental Protection Agency, 1985, p. 3 Search PubMed.
- V. L. Orkin, V. G. Khamaganov, S. N. Kozlov and M. J. Kurylo, J. Phys. Chem. A, 2013, 117, 3809 CrossRef CAS PubMed.
- R. C. Johnson, K. Koch and R. G. Cooks, Ind. Eng. Chem. Res., 1999, 38, 343 CrossRef CAS.
- M. Lasa, R. Garcia and E. Millán, J. Chromatogr. Sci., 2006, 44, 438 CAS.
- H. Kuo, Y. Huang, J. Lo, T. Cheng and M. C. Wu, Int. Arch. Occup. Environ. Health, 2000, 73, 275 CrossRef CAS.
- U.S. Environmental Protection Agency. National Primary Drinking Water Regulations, to be found under http://water.epa.gov/drink/contaminants/index.cfm, 2009 Search PubMed.
- R. B. Jones and W. C. Mackrodt, Biochem. Pharmacol., 1983, 32, 2359 CrossRef CAS.
- Occupational Safety & Health Administration (OSHA), Chemical Sampling Information, Epichlorohydrin, to be found under http://www.osha.gov/dts/chemicalsampling/data/CH_238700.html, 2010 Search PubMed.
- NIOSH Manual of Analytical Methods (NMAM); Epichlorohydrin, to be found under http://www.cdc.gov/niosh/npg/npgd0254.html, 2010 Search PubMed.
- J. Gaca and G. Wejnerowska, Talanta, 2006, 70, 1044 CrossRef CAS PubMed.
- C. Loda, E. Bernabe, A. Nicoletti, S. Bacchi and R. Dams, Org. Process Res. Dev., 2011, 15, 1388 CrossRef CAS.
- M. J. Z. Sakhvidi, A. Bahrami, A. Afkhami and A. Rafiei, Int. J. Environ. Anal. Chem., 2012, 92, 1365 CrossRef.
- K. Karthikeyan, G. T. Arularasu, P. Devaraj and K. C. Pillai, Sci. Pharm., 2010, 78, 835 CrossRef CAS PubMed.
- R. L. Pesselman and M. J. Feit, J. Chromatogr., A, 1988, 439, 448 CrossRef CAS.
- L. D. Petrocellis, M. Tortoreto, S. Paglialunga, R. Paesani, L. Airoldi, E. R. Castaneda and C. Pantarotto, J. Chromatogr., A, 1982, 240, 218 CrossRef.
- M. Hanada, H. Koda, K. Onaga, K. Tanaka, T. Okabayashi, T. Itoh and H. Miyazaki, Anal. Chim. Acta, 2003, 475, 27 CrossRef CAS.
- A. W. E. Hodgson, P. Jacquinot and P. C. Hauser, Anal. Chem., 1999, 71, 2831 CrossRef CAS.
- T. Torkelson and D. S. Ballantine, Analyst, 1998, 123, 209 RSC.
- J. Y. Liu, F. L. Meng, Y. Zhong, J. H. Liu, G. Y. Chen, Y. T. Wan and K. Qian, J. Mater. Res., 2010, 25, 1992 CrossRef CAS.
- A. Abdel-Wahab, O. Mohamed, S. Ahmed and M. Mostafa, J. Phys. Org. Chem., 2012, 25, 1418 CrossRef CAS.
- T. H. Le, Q. D. Truong, T. Kimura, H. H. Li, C. S. Guo, S. Yin, T. Aato and Y. C. Ling, Solid State Sci., 2013, 15, 29 CrossRef CAS PubMed.
- J. L. Mohanan, I. U. Arachchige and S. L. Brock, Science, 2005, 307, 397 CAS.
- S. D. Choi and B. K. Min, Sens. Actuators, B, 2001, 77, 330 CrossRef CAS.
Footnote |
| † Electronic supplementary information (ESI) available. See DOI: 10.1039/c3ce41478g |
| This journal is © The Royal Society of Chemistry 2014 |


