Effects of nanoparticle surface ligands on protein adsorption and subsequent cytotoxicity†
Jing
Bai
,
Tiantian
Wang
,
Yichen
Wang
and
Xiue
Jiang
*
State Key Laboratory of Electroanalytical Chemistry, Changchun Institute of Applied Chemistry, Changchun 130022, PR China. E-mail: jiangxiue@ciac.ac.cn
First published on 17th December 2013
Abstract
With the widespread use of nanoparticles (NPs) such as quantum dots (QDs) in biomedical applications, and the growing concerns about nanotoxicity of these engineered nanoparticles, the importance of nanoparticle–protein interaction has not been well emphasized. In order to better understand the physical basis of the biological activity of nanoparticles in nanomedicine applications or under conditions of environmental exposure, the interaction of CdSe/ZnS QDs having different surface ligands as a model with human serum albumin (HSA) has been investigated in detail by various spectroscopic techniques including UV-vis absorption, fluorescence, circular dichroism, and Fourier transform infrared (FTIR) spectroscopies. We find that QDs coated with zwitterionic D-penicillamine (DPA-QDs) or anionic mercaptosuccinic acid (MSA-QDs) bind to the same site of serum albumin, domain II A, site I, and the differences of the Stern–Volmer quenching constant KSV and the binding constant K are about sixfold and sevenfold after 4 h of mixing, respectively. We also find tentative evidence that the model proteins undergo conformational changes upon association with the QDs that have different surface ligands. Additional cellular cytotoxicity assays, with HeLa cells, reveal that the stronger adsorption capacity of HSA on the surface of MSA-QDs results in more reduced cytotoxicity for the protein-coated QDs, while the weaker binding capacity of HSA on DPA-QDs has less effect on the interaction of QDs with cells. These findings have shed light on the design and application of QDs nanomaterials to nanomedicine by a comprehensive preconsideration of their interaction with human serum proteins.
1. Introduction
The rapid growth of nanotechnology has produced a variety of nanomaterials including all kinds of novel semiconductor nanoparticles (NPs).1,2 Semiconductor quantum dots (QDs) have received considerable attention due to their unique optical properties which include high quantum yield, large molar extinction coefficient, tunable fluorescence emission, and photostability.3–5 Particularly, the water-soluble CdSe@ZnS QDs have attracted much attention in many nanomedical applications in recent years. For example, they have been used as probes for in vitro6 and in vivo imaging7 including vascular imaging,8 cell tracking,9 and targeted molecular imaging.10 Multimodal QDs for simultaneous diagnostics and therapeutics have also been extensively developed.11 These applications inevitably increase the necessity of studying the interaction between QDs and physiological systems. Only if we know how to manipulate the interaction, we can benefit from the novel imaging capabilities featured by the QDs probes. Hence, many studies have been performed on the biological effects of QDs.12–14 It has been found that the geometry and the surface ligand of the QDs affect their interaction with cells.12,13 We also studied the uptake kinetics of the zwitterionic QDs–DPA-QDs by living cells, observed the trafficking of the DPA-QDs to subcellular compartments and studied the DPA-QDs-induced structural changes of the lipid bilayer based on model membranes prepared on solid supports with lipid compositions identical to those of cell membranes.15,16However, in nanomedical applications of QDs, our blood circulatory system will most likely be the first interaction organ exposed to these QDs. Prior to the endocytosis, nanoparticles may first combine with the proteins in the blood, and obtain a new “biological identity”, which determines the subsequent cell/tissue reaction. On the other hand, when nanoparticles (NPs) interact with proteins, they might alter the protein conformation, expose new epitopes on the protein surface, or perturb the normal protein function, which could induce unexpected biological reactions and lead to toxicity. Therefore, the quantitative interaction of nanoparticles with proteins is an important step toward understanding the behavior of QDs in a highly heterogeneous in vivo environment and concomitant biological responses. In various studies it was reported that the size and surface properties of nanoparticles are important for the interaction between the nanoparticles and their surrounding medium or living cell systems.17–20 Dawson et al. analyzed the adsorption of plasma proteins on polystyrene nanoparticles with different surface properties and sizes. They showed that the size of the particle and its surface modification are able to entirely change the nature of the biologically active proteins in the corona.21 Different acidic and basic functional groups of the polystyrene22 and alumina23 particles influence the kind of proteins adsorbed on the surface. Rotello et al. investigated the binding thermodynamics of Au NP–protein interaction. They showed that the enthalpy and entropy changes for the complex formation depend upon the structure of nanoparticles and the surface characteristics of the proteins.24 Although other recent studies have already emphasized the effect of nanomaterial surface properties on the interaction of NPs with proteins, most of them focused on the polystyrene,17,21,22 Au, Ag,19,24,25 alumina,23 and magnetic iron oxide nanoparticles,26 and only a few studies have been performed on the interaction between proteins and QDs. Moreover, most of them focused on the interaction of water-soluble CdTe QDs with plasma proteins,27,28 while there were few reports about the interaction between plasma proteins and core/shell CdSe@ZnS QDs that have been extensively used in nanomedicine.29 As far as we know, no study about the effect of surface ligands on the interaction of CdSe@ZnS QDs with plasma proteins and the subsequent cytotoxicity modulated by the adsorbed protein has been reported up to now.
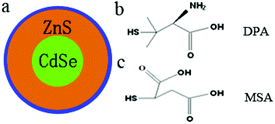
Human serum albumin (HSA), a 585 amino acid residue monomer, is the most abundant protein constituent in human blood plasma (40 kg m−3 or 0.6 mM) and has many physiological functions.30 Except for maintaining colloid osmotic pressure in blood, HSA also plays a role in the transport and distribution of exogenous and endogenous molecules, including nutrients, hormones, metal ions and numerous pharmaceuticals.31 As QDs are used in nanomedicine, their transportation, distribution, physiological and toxicological actions in vivo are closely related to their binding proteins. For the biological applications, the surface of the QDs has to be modified with hydrophilic molecules like water-soluble thiolated ligands. As a result, investigating the effect of surface ligands on the interaction of HSA with QDs can help us better understand the physiological behavior of QDs and their toxicological actions, and hence become an important research field in chemistry, life sciences and clinical medicine. In the present work, we synthesized different ligand-capped CdSe/ZnS QDs (Scheme 1). Proceeding from our former studies, here we studied the interaction of HSA with zwitterionic and carboxylic QDs. A wide range of photophysical techniques, such as fluorescence quenching, UV-visible absorption, circular dichroism (CD), FTIR spectroscopy and transmission electron microscopy (TEM), were employed to characterize various aspects of the surface ligand-dependent protein–QDs interactions. Information regarding the binding constant and the binding sites of the reaction was provided. The conformational changes of HSA were discussed on the basis of CD and FTIR. We found a surprising binding of blood protein onto the surface of different ligand-capped QDs, with different adsorption capacities. These differences in protein adsorption in the different ligand-capped CdSe/ZnS QDs have different cytotoxicity by influencing the subsequent cellular responses.
2. Experimental section
2.1. Synthesis of water-soluble CdSe/ZnS QDs with different short ligands
Water-soluble CdSe/ZnS QDs with different short ligands were prepared as reported previously.32 The CdSe/ZnS core/shell QDs were prepared in an organic solvent. The surfaces of the resulting CdSe/ZnS QDs were modified with D-penicillamine (DPA) and mercaptosuccinic acid (MSA), respectively, yielding water-soluble DPA-QDs and MSA-QDs (see ESI†). The surfaces of the resulting CdSe/ZnS QDs were modified with D-penicillamine (DPA) and mercaptosuccinic acid (MSA), respectively, yielding water-soluble DPA-QDs and MSA-QDs. The hydrodynamic sizes of synthesized QDs were characterized by fluorescence correlation spectroscopy (FCS) using a home-built setup.33 ζ-Potential was determined in buffer solution by dynamic light scattering using a Zetasizer (ZEN3600, Malvern Co., UK).The concentration of QDs was calculated using Lambert–Beer's law:34
| A = εCL | (1) |
2.2. UV-vis spectra measurements
UV-vis absorption spectra were measured using a UV-1700 PharmaSpec (Shimadzu, Japan) spectrometer with a 1 cm cuvette. UV-vis absorption spectra were measured in the range between 520 nm and 700 nm at room temperature.2.3. The sample preparation of TEM
The morphology of the products was determined by TEM. A total of 5 μL of the sample was deposited from a dilute solution on a 3–4 nm thick film of amorphous carbon supported on a 230 mesh copper grid (Zhong Xing Bai Rui Instruments, China), and the solvent was blotted with a filter paper. The grids were observed on a Hitachi H-600 operated at 75 keV.2.4. Fluorescence measurements
Fluorescence measurements were performed using a LS-55 Luminescence Spectrometer (Perkin-Elmer). The spectra of HSA were recorded in the wavelength range of 285–420 nm upon excitation at 280 nm. The spectra of QDs were recorded in the wavelength range of 560–680 nm. 10 nm per 10 nm of slit widths and 300 nm min−1 of scan speed were kept constant within each dataset, and each spectrum was the average of three scans. A 1.00 cm path length of quartz cell was used for these studies. Before the experiment, a 2.0 × 10⁻⁶ mol L−1 HSA solution was mixed with different concentration QDs at 37 °C with 4 h of incubation. The experiments were repeated and found to be reproducible within experimental errors.2.5. Circular dichroism (CD) measurements
Far-UV circular dichroism (CD) spectra were taken on a JASCO J-810 spectrometer, using a rectangular quartz cell with 1.0 cm path length. After incubation for 4 h between HSA and QDs, the CD spectra were recorded between 200 and 250 nm in 0.05 mol L−1 Tris–HCl (pH 7.4 ± 0.1), at 25 °C. The concentration of HSA in the CD study was 5.0 × 10⁻⁷ mol L−1, and the concentration of QDs was 1.0 × 10⁻⁸ mol L−1. Each spectrum was the average of three successive scans and was corrected by Tris–HCl buffer solution.2.6. Fourier transform infrared (FTIR) measurements
FTIR spectra were recorded on a Nicolet 520 FTIR spectrometer (Nicolet) equipped with a germanium attenuated total reflection (ATR) accessory, a DTGS KBr detector, and a KBr beam splitter. After incubation for 4 h between HSA and QDs, the spectra of free HSA and combined HSA were taken via the ATR method with a 4 cm−1 of resolution. A 512-scan interferogram was used to ensure a good signal-to-noise ratio in the experiment. An absorption spectrum of prerecorded Tris–HCl buffer solution under identical conditions was automatically subtracted during data collection.2.7. Cell culture
HeLa cells (cervical cancer cell line) were maintained in a DMEM medium containing 10% fetal bovine serum, 100 units mL−1 penicillin and 100 mg mL−1 streptomycin. Cell culture was performed in a humidified 5% CO2 atmosphere at 37 °C. For all experiments, cells were harvested from subconfluent cultures by the use of trypsin and resuspended in a fresh complete medium before plating.2.8. Cell toxicity assay
The viability of cells in the presence of QDs nanoparticles was investigated using 3-[4,5-dimethylthialzol-2-yl]-2,5-diphenyltetrazolium bromide (MTT, Sigma) assay. For the cell toxicity assay, HeLa cells were seeded in a 96-well plate at a density of 1 × 10⁴ cells per well and cultured in 5% CO2 at 37 °C for 24 h. The cells were then incubated with DPA-QDs, MSA-QDs, HSA + DPA-QDs and HSA + MSA-QDs for 4 h. Next, cells were incubated in media containing 0.5 mg mL−1 of MTT for 4 h. The medium is then replaced with 100 μL dimethyl sulfoxide (DMSO), and the absorbance was monitored at 490 nm using a Versamax microplate reader (BioTek Instruments Inc., USA). The results were quantified by manually subtracting the blank value from each value and then normalizing against the control values.2.9. Live cell confocal imaging
For the confocal image, HeLa cells were seeded in cell culture dishes and cultured in 5% CO2 at 37 °C for 24 h. Afterwards, the cells were rinsed three times with PBS. For nanoparticle exposure, cells were incubated with 800 μL of 10 nM QDs in PBS. The cells were imaged using a confocal laser scanning fluorescence microscope (CLSM, Leica TCS SP2, Leica Microsyste ms, Mannheim, Germany). QDs were excited at 488 nm and observed through a 550–650 nm emission band-pass filter. The mean fluorescence intensity of QDs in cells was determined using the Image J software.3. Results and discussion
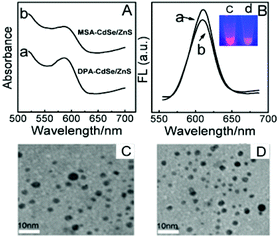
CdSe@ZnS QDs capped with short zwitterionic DPA, which was functionalized with surface amine and carboxylic acid groups,35 have shown superior stability in neutral solution. In addition to DPA-QDs, we also prepared MSA-coated CdSe@ZnS QDs. In comparison with DPA, the MSA ligand has a similar length, but the surface functional groups contain two carboxylic acids. Fig. 1A shows the absorption spectra of DPA-QDs (curve a) and MSA-QDs (curve b). Obviously, both of the absorption peaks were located at 590 nm. Fig. 1B shows the fluorescence emission spectra (FL) of DPA-QDs (curve a) and MSA-QDs (curve b). Both of the FL spectra had the narrow peaks at 610 nm with the full-width at half-maximum of about 36 nm. Since the absorption and FL spectra of QDs are determined by their size, the similar absorption and FL spectra of both QDs suggest identical sizes. Fluorescence images of DPA-QDs (c) and MSA-QDs (d) are shown in the inset of Fig. 1B with the orange-red fluorescence. The TEM images (Fig. 1C and D) and the resulting size histograms (Fig. S1A and B†) revealed that the size distribution of the QDs was centered at an average diameter of 4 nm. The colloidal stability of QDs was characterized by measuring their zeta potentials in the buffer solution (tris, pH 7.4), which yielded a value of −32 mV and −45 mV for DPA-QDs and MSA-QDs, respectively. Typically, a zeta potential below −30 mV is considered an indication of a colloidally stable system.36 Also, the sizes monitored by FCS detection were 9.9 ± 0.2 nm and 12.6 ± 0.3 nm for DPA-QDs and MSA-QDs, respectively, indicating that these particles are stable without any precipitation.The ligand characterizations of QDs were further confirmed by the FTIR spectra shown in Fig. S2.† The bands at 1637 cm−1 are known to arise from the δas (–NH3+), overlapping with the asymmetric stretching vibration of the –COO− group.37 The signal at 1109 cm−1 belongs to C–N vibrational modes of the zwitterionic DPA-QDs. In the spectrum of MSA-QDs (curve b), two main peaks were observed at 1571 and 1490 cm−1, which belong to vas (–COO−) and vs (–COO−) vibrational modes, respectively. The results show that water-soluble thiolated ligands have been exchanged to the surface of QDs. In order to detect the effects of nanoparticle surface ligands on protein adsorption, it is important to ensure that the same amount of ligand was grafted on QDs, which was analyzed by ICP-MS (see ESI†).38 The equation for packing density was derived in the ESI.† The results showed that the DPA/MSA ratio on the surface of QDs was around 1.09, equal to 1.0, indicating that the amount of DPA and MSA grafted on QDs is the same.
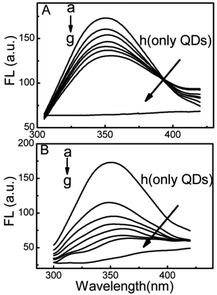
Fluorescence quenching is the decrease of the quantum yield of fluorescence from a fluorophore induced by a variety cavity near Trp.39 However, in comparison with the DPA-QDs, the MSA-QDs caused stronger quenching in the fluorescence intensity of HSA with the same concentration and a larger red shift of the fluorescence emission bands of HSA from 349 to 360 nm (Fig. 2). Therefore, it can be concluded that the adsorption of HSA on the surface of MSA-QDs was stronger than that on the DPA-QDs.
The observed fluorescence quenching probably arises from the energy transfer occurring between HSA and QDs.40 The fluorescence quenching is known to occur mainly by a collisional process (dynamic quenching) and/or formation of a complex between a quencher and a fluorophore (static quenching).41 For fluorescence quenching, the decrease of the intensity is usually described by the well-known Stern–Volmer equation:42
 | (2) |
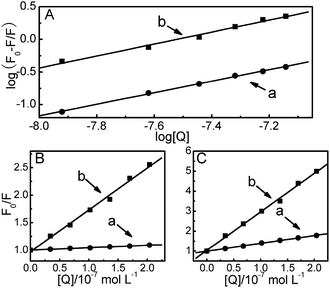
The Stern–Volmer quenching constants KSV for DPA-QDs and MSA-QDs were calculated to be 0.43 × 10⁷ L mol−1 and 2.64 × 10⁷ L mol−1, respectively (Table 1).
| Systems | k q (×1015 L mol−1 s−1) | K SV (×107 L mol−1) | K (×107 L mol−1) | n |
|---|---|---|---|---|
| HSA–DPA-QDs | 0.43 | 0.43 | 0.72 | 0.89 |
| HSA–MSA-QDs | 2.64 | 2.64 | 5.10 | 0.92 |
That is to say, the quenching may occur due to the formation of a complex between HSA and QDs. In order to understand the interaction between HSA and QDs, the binding constant (K) was determined from the fluorescence intensity by employing the Lineweaver–Burk equation:42
 | (3) |
Further, it is critical to monitor the stability of the QDs–HSA complex during the interaction. We detected the fluorescence emission spectra of QDs in the QDs–HSA complex (Fig. S4†). After the incubation with HSA for 4 h, the maximal fluorescence emission bands and half peak width of QDs, especially DPA-QDs, were nearly unaffected as compared with the separate QDs, only accompanied by a decline in the fluorescence intensity of QDs, indicating that the two QDs, especially DPA-QDs, are stable during the interaction, and have no apparent aggregation. Therefore, we can conclude that the difference in the fluorescence quenching efficiency should be due to the difference in the ligands.
To directly observe the binding of QDs nanoparticles to HSA, TEM was used to characterize the morphologies of QDs after exposure to the protein solutions (see Fig. 3). In order to allow adequate interaction between nanoparticles and proteins, the same concentrations of DPA-QDs and MSA-QDs were mixed with HSA for 4 h, and then the mixture was imaged. Surprisingly, the morphologies of the two QDs were completely different. Most MSA-QDs bound to HSA (Fig. 3C), but only a small amount of DPA-QDs bound to HSA (Fig. 3B). The results are consistent with fluorescence quenching, and the binding constant of DPA-QDs to HSA was about 7 times weaker than that of the MSA-QDs. These results mean that the binding capacity of DPA-QDs to HSA is quite weak, which is in accord with what has been reported by Choi et al., who have found that the QDs coated with zwitterionic cysteine prevented the adsorption of serum protein,45 while our study also further confirms this conclusion.
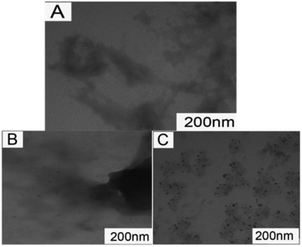 | ||
| Fig. 3 TEM images of HSA (A), HSA-DPA-QDs (B) and HSA-MSA-QDs (C). Images presented are representative of at least 20 different regions in each sample. | ||
We first determined the number of the binding sites between HSA and QDs. On the assumption that the QDs have n independent binding sites on protein, the binding sites can be obtained from the equation:46
| log(F0 − F)/F = log K + n log[Q] | (4) |
As the data in the preceding discussion do not allow us to give the precise binding sites on the protein, more information about the binding sites of QDs can be gained by monitoring the changes of the fluorescence of QDs-bound protein that is brought about by site I (phenylbutazone, warfarin) and site II (ibuprofen, diazepam) markers.47 To identify the binding location of QDs on the serum albumin, the fluorescence spectra of 2.0 × 10⁻⁶ mol L−1 HSA samples containing the equimolar concentration of phenylbutazone or ibuprofen with the addition of different concentrations of QDs were recorded upon excitation at 280 nm. In the presence of phenylbutazone, the fluorescence intensity of the HSA decreased gradually with an increasing concentration of DPA-QDs or MSA-QDs. But the amplitude variation of fluorescence quenching was significantly weaker than that in the absence of phenylbutazone. Therefore, these observations suggest that phenylbutazone could, to some extent, occupy the binding sites of QDs on the HSA. By contrast, in the presence of ibuprofen, the fluorescence properties of the HSA–DPA-QD and HSA–MSA-QD complexes were almost the same as those in the absence of ibuprofen, which indicate that ibuprofen does not prevent the binding of QDs to HSA. To facilitate the comparison of the influence of phenylbutazone and ibuprofen on the fluorescence spectra of HSA–QDs systems, the quenching data were analyzed according to the Stern–Volmer equation (Fig. 4B and C). The corresponding results are shown in Table 2. The results show that the quenching constant was surprisingly variable in the presence of phenylbutazone, while a small influence was observed in the presence of ibuprofen (somewhat lower than that with isolated HSA). These results and plots demonstrate that the binding sites of DPA-QDs and MSA-QDs on HSA are site I in the subdomain IIA of HSA.
| Systems | K SV (×107 L mol−1) | |
|---|---|---|
| DPA-QDs | MSA-QDs | |
| HSA | 0.43 | 2.64 |
| HSA + phenylbutazone | 0.044 | 0.76 |
| HAS + ibuprofen | 0.39 | 1.93 |
As is well known, site I (phenylbutazone binding site), which has been described as a large hydrophobic cavity, is present in subdomain IIA of HSA. The inside wall of the pocket is formed by hydrophobic side chains, whereas the entrance to the pocket is surrounded by positively charged residues, such as Arg257, Arg222, Lys199, His242, Arg218, and Lys195, functioned sterically and electrostatically in ligand binding.29,47 Moreover, the helix in IIA is displaced outward and presents a very hydrophilic surface toward the cavity.48 Previous work showed that typical site I ligands appeared to be dicarboxylic acids and/or bulky heterocyclic molecules with a negative charge localized in the middle of the molecule.47 Note that surface charge can significantly mediate the interaction between nanomaterials and biological systems.49 In our studies, it is also clear that HSA seems to have a preference for binding to negatively charged surfaces (MSA contain two carboxyl groups). The MSA ligand has two carboxylic acid groups, while one carboxylic acid group of DPA is balanced with one amine group. The QDs is likely bound to the entrance of the pocket by positively charged residues. Also, this is probably related with the hydrophilic of the QDs. As HSA is basically hydrophilic, it shows much higher adsorption capacity on MSA-QDs with two carboxyl groups than zwitterionic DPA-QDs.
To obtain more information on the binding of HSA to QDs, further experiments were carried out with CD and FTIR techniques to analyze the HSA–QD systems. Fig. 5 shows the far-UV CD spectra of HSA in the absence and presence of DPA-QDs and MSA-QDs, respectively. The CD spectra of HSA exhibited two negative bands at 208 and 220 nm (curve a), which were the characteristics of α-helix in the advanced structure of the protein.46,50 The addition of DPA-QDs caused a decrease in both bands of HSA (curve b), indicating that part of the protein binding to the surface of the DPA-QDs causes a conformational changes of proteins. However, the presence of MSA-QDs caused a further decrease in the band intensity (curve c). The above-mentioned results may be attributed to the formation of a complex between HSA and QDs, which induces the conformational changes of proteins. Since the α-helix is one of the elements of the secondary structure, the structure change of albumin could be evaluated by the content of the α-helix structure. The CD results were expressed in terms of mean residue ellipticity (MRE) in deg cm2 d mol−1 according to the following equation:51
 | (5) |
 | (6) |
![[thin space (1/6-em)]](https://www.rsc.org/images/entities/char_2009.gif) 000 is the MRE value of a pure α-helix at 208 nm. From the above equation, the calculated results exhibited a reduction of α-helix structures from 62% in free HSA to 58% in the HSA–DPA-QDs complex and 45% in the HSA–MSA-QDs complex, which was indicative of the loss of α-helix upon interaction. The difference in the reduction of the CD intensity may be due to less binding of HSA to the surface of DPA-QDs or less conformational changes of adsorbed proteins on the surface of DPA-QDs, indicating that the adsorption ability of the protein on the surface of QDs is related to the surface properties of ligands.
000 is the MRE value of a pure α-helix at 208 nm. From the above equation, the calculated results exhibited a reduction of α-helix structures from 62% in free HSA to 58% in the HSA–DPA-QDs complex and 45% in the HSA–MSA-QDs complex, which was indicative of the loss of α-helix upon interaction. The difference in the reduction of the CD intensity may be due to less binding of HSA to the surface of DPA-QDs or less conformational changes of adsorbed proteins on the surface of DPA-QDs, indicating that the adsorption ability of the protein on the surface of QDs is related to the surface properties of ligands.
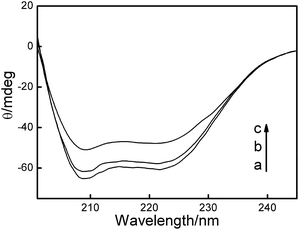 | ||
| Fig. 5 The far-UV CD spectra of HSA–QDs system: (a) 5.0 × 10⁻⁷ mol L−1 HSA; (b) 5.0 × 10⁻⁷ mol L−1 HSA + 1.0 × 10⁻⁸ mol L−1 DPA-QDs; (c) 5.0 × 10⁻⁷ mol L−1 HSA + 1.0 × 10⁻⁸ mol L−1 MSA-QDs. | ||
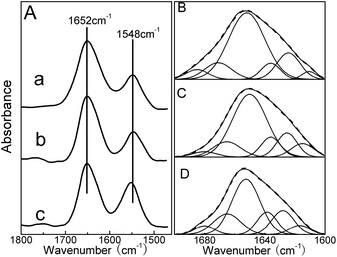
Additional evidence regarding the interaction of QDs with HSA was obtained from FTIR spectroscopy. As shown in Fig. 6A, free HSA, HSA–DPA-QDs and HSA–MSA-QDs complexes showed the amide I and II bands at about 1652 and 1548 cm−1. A quantitative analysis of the protein secondary structure for the free HSA, HSA–DPA-QDs and HSA–MSA-QDs complexes has been carried out, and the results are shown in Fig. 6B–D and Table 3. The component bands of the infrared amide I band were attributed to the following: 1615–1637 cm−1 to β-sheet, 1638–1648 cm−1 to random coil, 1649–1660 cm−1 to α-helix, 1660–1680 cm−1 to turn, and 1680–1692 cm−1 to β-antiparallel structures, respectively.53 The free HSA had 59% α-helix (1654 cm−1), 17% β-sheet (1620 and 1630 cm−1), 11% turn structure (1673 cm−1), 5% β-antiparallel (1685 cm−1) and 8% random coil (1640 cm−1) (Fig. 6B and Table 3). Upon the addition of DPA-QDs, a minor decrease of the α-helix occurred from 59% (free HSA) to 56% (HSA–DPA-QDs), while the contents of the β-sheet and random coil increased from 17% to 19% and from 8% to 10% (Fig. 6C and Table 3). However, a major decrease of α-helix from 59% (free HSA) to 45% (HSA–MSA-QDs) with an increase in the β-sheet from 17% to 20%, β-turn from 11% to 16% and random coil from 8% to 13% was observed upon MSA-QD complexation (Fig. 6D and Table 3). The major decrease in the α-helix structure and the increase in the β-sheet, turn and random coil structures suggest a partial protein unfolding in the presence of QDs. This result is in accord with that obtained by CD spectroscopy. Also it is shown that the surface of QDs coating has an important impact on the protein structure, which agrees with previous studies that particles coated with carboxylic groups affect the conformation of protein to a much greater degree.54
| Systems | Fraction of secondary structure (%) | ||||
|---|---|---|---|---|---|
| α-Helix (%) | β-Sheet (%) | Turn (%) | Random (%) | β-Anti (%) | |
| Free HSA | 59 | 17 | 11 | 8 | 5 |
| HSA–DPA-QDs | 56 | 19 | 11 | 10 | 4 |
| HSA–MSA-QDs | 45 | 20 | 16 | 13 | 6 |
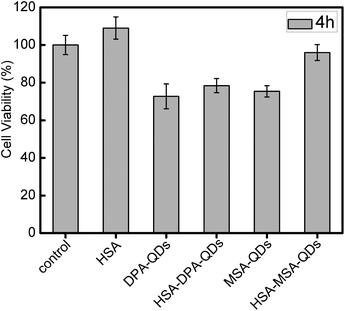
We carried out an additional experiment exploring whether the spontaneous coating of HSA influenced the toxicity of QDs using the conventional MTT assay (Fig. 7). Interestingly, we found that HSA-coated MSA-QDs caused less cytotoxicity than uncoated MSA-QDs, whereas HSA-coated DPA-QDs showed similar toxicity with uncoated DPA-QDs. It is worth noting that the effects of these QDs–protein complexes have a similar order to the QDs binding capacity, such as MSA-QDs > DPA-QDs. HSA as a capping agent for the modification of the MSA-QDs surface further improves the biocompatibility, because the stable surface coating of the QDs prevents their oxidation and avoids the release of cadmium ions, a known toxin and suspected carcinogen.55
Also, when the QDs were incubated with the HeLa cells for only 30 min, fluorescent confocal images showed that DPA-QDs or MSA-QDs accumulated on the cell membrane and were internalized into cells. Also, most DPA-QDs still had migrated into the cells even after incubating with HSA at 37 °C for 4 h prior to incubating with cells. By contrast, less MSA-QDs were endocytosed by the cells after incubation with HSA. Also, as seen from Fig. S5,† the fluorescence intensity of HeLa cells treated with HSA–MSA-QDs was considerably lower than that of the separate MSA-QDs. It is not unreasonable to assume that the MSA-QDs easily adsorb HSA onto their surface, resulting in less MSA-QDs uptake by cells with low cytotoxicity.
These results indicate that the attachment of the HSA layer to the QDs reduces the biological toxicity of QDs whereas HSA-coated MSA-QDs are less toxic. However, the weak binding capacity of DPA-QDs to HSA avoids the serum protein adsorption, which is important for their applications in nanomedicine.
4. Conclusions
In this work, the interaction of semiconductor QDs with HSA has been systematically studied by UV-vis, fluorescence, CD, FTIR and TEM. From the discussion above, we can ascertain that nanoparticles typically bind proteins and exhibit different binding characteristics depending on their surface property. The binding constants of DPA-QDs and MSA-QDs with HSA were slightly different, but the binding capacity of DPA-QDs was dramatically weak. The actual extent of protein conformational change was also highly variable with the surface property of QDs, for which the DPA-QDs induced less conformational changes. Our studies about the influence of the surface properties of nanoparticles are crucial for understanding the interactions between proteins and nanoparticles. Moreover, the capacity to control the surface interaction through surface functionalization suggests the relevance of this process to NP toxicity and nanomedicine applications. Particularly, the studies on the HSA–QDs interaction domain open up the possibility of better modeling and predicting the interaction of proteins and other biomolecules to nanoparticles.Acknowledgements
This work was supported by the Youth Foundation of China (21105097), President Funds of the Chinese Academy of Sciences, Natural Science foundation of Jilin Province (201215092).Notes and references
- A. P. Alivisatos, Science, 1996, 271, 933–937 CAS.
- M. A. Hines and P. Guyot-Sionnest, J. Phys. Chem., 1996, 100, 468–471 CrossRef CAS.
- X. Michalet, F. F. Pinaud, L. A. Bentolila, J. M. Tsay, S. Doose, J. J. Li, G. Sundaresan, A. M. Wu, S. S. Gambhir and S. Weiss, Science, 2005, 307, 538–544 CrossRef CAS PubMed.
- M. Howarth, W. Liu, S. Puthenveetil, Y. Zheng, L. F. Marshall, M. M. Schmidt, K. D. Wittrup, M. G. Bawendi and A. Y. Ting, Nat. Methods, 2008, 5, 397–399 CrossRef CAS PubMed.
- J. Sharma, Y. Ke, C. Lin, R. Chhabra, Q. Wang, J. Nangreave, Y. Liu and H. Yan, Angew. Chem., Int. Ed., 2008, 47, 5157–5159 CrossRef CAS PubMed.
- M. Howarth, K. Takao, Y. Hayashi and A. Y. Ting, Proc. Natl. Acad. Sci. U. S. A., 2005, 102, 7583–7588 CrossRef CAS PubMed.
- J. M. Klostranec and W. C. W. Chan, Adv. Mater., 2006, 18, 1953–1964 CrossRef CAS.
- D. R. Larson, W. R. Zipfel, R. M. Williams, S. W. Clark, M. P. Bruchez, F. W. Wise and W. W. Webb, Science, 2003, 300, 1434–1436 CrossRef CAS PubMed.
- E. B. Voura, J. K. Jaiswal, H. Mattoussi and S. M. Simon, Nat. Med., 2004, 10, 993–998 CrossRef CAS PubMed.
- L. Yang, H. Mao, Y. A. Wang, Z. Cao, X. Peng, X. Wang, H. Duan, C. Ni, Q. Yuan, G. Adams, M. Q. Smith, W. C. Wood, X. Gao and S. Nie, Small, 2009, 5, 235–243 CrossRef CAS PubMed.
- Y.-P. Ho and K. W. Leong, Nanoscale, 2010, 2, 60–68 RSC.
- J. S. Aaron, A. C. Greene, P. G. Kotula, G. D. Bachand and J. A. Timlin, Small, 2011, 7, 334–341 CrossRef CAS PubMed.
- N. A. Al-Hajaj, A. Moquin, K. D. Neibert, G. M. Soliman, F. M. Winnik and D. Maysinger, ACS Nano, 2011, 5, 4909–4918 CrossRef CAS PubMed.
- Y. Li, Y. Zhou, H.-Y. Wang, S. Perrett, Y. Zhao, Z. Tang and G. Nie, Angew. Chem., Int. Ed., 2011, 123, 5982–5986 CrossRef.
- X. Jiang, C. Röcker, M. Hafner, S. Brandholt, R. M. Dörlich and G. U. Nienhaus, ACS Nano, 2010, 4, 6787–6797 CrossRef CAS PubMed.
- T. Wang, J. Bai, X. Jiang and G. U. Nienhaus, ACS Nano, 2012, 6, 1251–1259 CrossRef CAS PubMed.
- G. Baier, C. Costa, A. Zeller, D. Baumann, C. Sayer, P. H. Araujo, V. Mailander, A. Musyanovych and K. Landfester, Macromol. Biosci., 2011, 11, 628–638 CrossRef CAS PubMed.
- L. Shang, R. M. Dörlich, V. Trouillet, M. Bruns and G. Ulrich Nienhaus, Nano Res., 2012, 5, 531–542 CrossRef CAS.
- L. Treuel, M. Malissek, J. S. Gebauer and R. Zellner, ChemPhysChem, 2010, 11, 3093–3099 CrossRef CAS PubMed.
- A. Verma and F. Stellacci, Small, 2010, 6, 12–21 CrossRef CAS PubMed.
- M. Lundqvist, J. Stigler, G. Elia, I. Lynch, T. Cedervall and K. A. Dawson, Proc. Natl. Acad. Sci. U. S. A., 2008, 105, 14265–14270 CrossRef CAS PubMed.
- A. Gessner, A. Lieske, B.-R. Paulke and R. H. Müller, J. Biomed. Mater. Res., 2003, 65A, 319–326 CrossRef CAS PubMed.
- F. Meder, T. Daberkow, L. Treccani, M. Wilhelm, M. Schowalter, A. Rosenauer, L. Mädler and K. Rezwan, Acta Biomater., 2012, 8, 1221–1229 CrossRef CAS PubMed.
- M. De, C.-C. You, S. Srivastava and V. M. Rotello, J. Am. Chem. Soc., 2007, 129, 10747–10753 CrossRef CAS PubMed.
- S. Chakraborty, P. Joshi, V. Shanker, Z. A. Ansari, S. P. Singh and P. Chakrabarti, Langmuir, 2011, 27, 7722–7731 CrossRef CAS PubMed.
- S. Liu, Y. Han, R. Qiao, J. Zeng, Q. Jia, Y. Wang and M. Gao, J. Phys. Chem. C, 2010, 114, 21270–21276 CAS.
- Z. Lu, W. Hu, H. Bao, Y. Qiao and C. M. Li, MedChemComm, 2011, 2, 283–286 RSC.
- Y. He, P. Yin, H. Gong, J. Peng, S. Liu, X. Fan and S. Yan, Sens. Actuators, B, 2011, 157, 8–13 CrossRef CAS PubMed.
- Q. Xiao, S. Huang, Z. D. Qi, B. Zhou, Z. K. He and Y. Liu, Biochim. Biophys. Acta, 2008, 1784, 1020–1027 CrossRef CAS PubMed.
- J. Xiao, L. Chen, F. Yang, C. Liu and Y. Bai, J. Hazard. Mater., 2010, 182, 696–703 CrossRef CAS PubMed.
- X.-f. Zhang, C.-y. Shu, L. Xie, C.-r. Wang, Y.-z. Zhang, J.-f. Xiang, L. Li and Y.-l. Tang, J. Phys. Chem. C, 2007, 111, 14327–14333 CAS.
- V. V. Breus, C. D. Heyes and G. U. Nienhaus, J. Phys. Chem. C, 2007, 111, 18589–18594 CAS.
- C. Rocker, M. Potzl, F. Zhang, W. J. Parak and G. U. Nienhaus, Nat. Nanotechnol., 2009, 4, 577–580 CrossRef PubMed.
- W. W. Yu, L. Qu, W. Guo and X. Peng, Chem. Mater., 2003, 15, 2854–2860 CrossRef CAS.
- V. V. Breus, C. D. Heyes, K. Tron and G. U. Nienhaus, ACS Nano, 2009, 3, 2573–2580 CrossRef CAS PubMed.
- X. Wang, H. Bai and G. Shi, J. Am. Chem. Soc., 2011, 133, 6338–6342 CrossRef CAS PubMed.
- M. Bieri and T. Bürgi, Langmuir, 2006, 22, 8379–8386 CrossRef CAS PubMed.
- S. Elzey, D. H. Tsai, S. Rabb, L. Yu, M. Winchester and V. Hackley, Anal. Bioanal. Chem., 2012, 403, 145–149 CrossRef CAS PubMed.
- J. Min, X. Meng-Xia, Z. Dong, L. Yuan, L. Xiao-Yu and C. Xing, J. Mol. Struct., 2004, 692, 71–80 CrossRef CAS PubMed.
- L. Shang, Y. Wang, J. Jiang and S. Dong, Langmuir, 2007, 23, 2714–2721 CrossRef CAS PubMed.
- B. Ahmad, S. Parveen and R. H. Khan, Biomacromolecules, 2006, 7, 1350–1356 CrossRef CAS PubMed.
- J. Tian, J. Liu, W. He, Z. Hu, X. Yao and X. Chen, Biomacromolecules, 2004, 5, 1956–1961 CrossRef CAS PubMed.
- Y. Liu, M.-X. Xie, M. Jiang and Y.-D. Wang, Spectrochim. Acta, Part A, 2005, 61, 2245–2251 CrossRef PubMed.
- W. R. Ware, J. Phys. Chem., 1962, 66, 455–458 CrossRef CAS.
- H. Soo Choi, W. Liu, P. Misra, E. Tanaka, J. P. Zimmer, B. Itty Ipe, M. G. Bawendi and J. V. Frangioni, Nat. Biotechnol., 2007, 25, 1165–1170 CrossRef PubMed.
- S. Ashoka, J. Seetharamappa, P. B. Kandagal and S. M. T. Shaikh, J. Lumin., 2006, 121, 179–186 CrossRef CAS PubMed.
- V. T. Chuang and M. Otagiri, Chirality, 2006, 18, 159–166 CrossRef CAS PubMed.
- S. Curry, H. Mandelkow, P. Brick and N. Franks, Nat. Struct. Mol. Biol., 1998, 5, 827–835 CAS.
- N. M. Schaeublin, L. K. Braydich-Stolle, A. M. Schrand, J. M. Miller, J. Hutchison, J. J. Schlager and S. M. Hussain, Nanoscale, 2011, 3, 410–420 RSC.
- J. Liu, J. Tian, W. He, J. Xie, Z. Hu and X. Chen, J. Pharm. Biomed. Anal., 2004, 35, 671–677 CrossRef CAS PubMed.
- Y. Li, W. He, J. Liu, F. Sheng, Z. Hu and X. Chen, Biochim. Biophys. Acta, 2005, 1722, 15–21 CrossRef CAS PubMed.
- S. S. Kalanur, J. Seetharamappa and U. Katrahalli, Colloids Surf., B: Biointerfaces, 2010, 75, 75–79 CrossRef CAS PubMed.
- G. Zhang, L. Wang and J. Pan, J. Agric. Food Chem., 2012, 60, 2721–2729 CrossRef CAS PubMed.
- J. H. Teichroeb, J. A. Forrest and L. W. Jones, Eur. Phys. J. E Soft Matter, 2008, 26, 411–415 CrossRef CAS PubMed.
- Y. Guo, D. Shi, H. Cho, Z. Dong, A. Kulkarni, G. M. Pauletti, W. Wang, J. Lian, W. Liu, L. Ren, Q. Zhang, G. Liu, C. Huth, L. Wang and R. C. Ewing, Adv. Funct. Mater., 2008, 18, 2489–2497 CrossRef CAS.
Footnote |
| † Electronic supplementary information (ESI) available: Size histogram of QDs. FTIR spectra of QDs. Fluorescence emission spectra of QDs incubated 4 h with HSA, confocal images of HeLa cells after incubation of 1 h with QDs together with the calculations of ligand density per QDs. See DOI: 10.1039/c3bm60224a |
| This journal is © The Royal Society of Chemistry 2014 |

