Behaviour of silica nanoparticles in dermis-like cellularized collagen hydrogels†
Sandrine
Quignard
a,
Christophe
Hélary
a,
Michel
Boissière
b,
Jose-Maria
Fullana
c,
Pierre-Yves
Lagrée
c and
Thibaud
Coradin
*a
aUPMC Univ Paris06; CNRS, Chimie de la Matière Condensée de Paris, Collège de France, F-75005 Paris, France. E-mail: thibaud.coradin@upmc.fr; Fax: +33 144271443; Tel: +33 144271528
bLaboratoire ERRMECe EA1391, Institut des Matériaux, Université de Cergy-Pontoise, F-95302 Pontoise, France
cCNRS, UMR 7190, Inst Jean Rond Alembert, F-75005 Paris, France
First published on 2nd December 2013
Abstract
A model of the fate of colloidal silica in the dermis was designed based on the diffusion of fluorescent silica nanoparticles through collagen hydrogels. The diffusion process was found to depend on particle size (10–200 nm) and surface charge, as well as on collagen concentration (1.5–5 mg mL−1). The presence of human dermal fibroblasts within the hydrogels also significantly impacted on the behaviour of the particles. In particular, the simultaneous monitoring of particulate and soluble forms of silica showed that both the hydrogel network and the cellular activity have a strong influence on the solubilization process of the silica particles, through a combination of surface sorption, uptake and intracellular dissolution. Interactions between silica and collagen in 3D environments also lower the cytotoxicity of 10 nm particles compared to traditional 2D cultures. The results emphasize the complexity of silica chemistry in living tissues and specifically indicate the need for further investigations of the in vivo behaviour of its soluble forms.
1. Introduction
Silica nanoparticles are widely used nanomaterials, e.g. fillers in cosmetics, food additives or dental ceramics.1,2 Among these applications, their use in cosmetic products raises the problem of dermal exposure. Skin acts as the first barrier of the organism towards the external environment. Even though skin is said to efficiently prevent penetration of molecules heavier than 0.5 to 1 kDa,3 several studies tend to show that nanoparticles well above this limit are able to cross the epidermis and reach the dermis.4–10 In particular, a recent study has shown that silica particles were not only able to reach the dermis but permeate the whole skin after topical application and reach systemic circulation.10Several parameters can influence the ability of nanomaterials to permeate skin. Apart from the intrinsic characteristics of the materials (size, shape, surface area, surface charge, etc.), formulation of the suspension can also affect dramatically the behaviour of the particles towards skin,11 as well as the state of the skin (abrasion, irritations) or mechanical strains (massage, flexions).9,12–14 Results often seem contradictory due to the variability of nanomaterials and the lack of precise characterization of the nano-objects. Anyway, what emerges from these different studies is the complexity of the interactions of nano-objects with the different components of the skin (extra-cellular matrix, cells, soluble biomolecules, etc.).14
So far studies concerning dermal penetration of silica nanoparticles are scarce and a complete understanding of the silica–tissue interactions is rendered difficult by the complexity of the ex vivo medium.15 In this context, we propose here a simpler approach using collagen hydrogels associated with human dermal fibroblasts as models of the dermis16 for diffusion studies. Through this approach it becomes possible to study in more detail the role of the collagen network and of the cells on the fate of silica nanoparticles of various size and charge. In particular, two important points had to be clarified. The first one relates to the solubilization of silica nanoparticles during transport through the skin. Indeed, it is well-known that colloidal silica as obtained by sol–gel routes, and without additional chemicals or treatment,17,18 tends to dissolve within a few hours under neutral pH conditions and at 37 °C when placed in an open environment (i.e. when the solubility equilibrium is not reached due to continuous removal of released silicic acid).19 The second aspect was related to the role of the 3D environment as provided by the dermis-mimicking collagen hydrogel on the cell–particle interactions, including internalization and cytotoxicity, that are, to a few exceptions,20,21 mainly studied under 2D in vitro conditions.22–25 These model studies underline the complex influence of collagen and fibroblasts on silica partition between particulate and soluble forms that will ultimately play a major role in the in vivo fate of silica-based biomaterials.26
2. Materials and methods
2.1. Nanoparticle synthesis and characterization
Fluorescent silica nanoparticles were synthesized according to the literature.27,28 Briefly, tetraethyl orthosilicate (TEOS 98 wt%, Aldrich) was added to a stirred solution of ammonium hydroxide solution (30%, CarloErba Reagents) in ethanol to obtain nanoparticles with a diameter larger than 30 nm followed by the addition of a solution of fluorescein-grafted aminopropyl triethoxysilane (APTES, Merck; FITC isomer 1 95%, Alpha Aesar). The solution was stirred for 48 h at room temperature before purification of the nanoparticles by dialysis (Spectra/Por, diameter 25 mm, pore diameter 4.2–5.0 nm from Carl Roth). Finally, the suspension of positively-charged nanoparticles was dialysed against 17 mM acetic acid to avoid their aggregation. To obtain smaller particles, the ammonium hydroxide solution in ethanol was replaced by a solution of L-(+)-lysine monohydrate (Sigma) in ultrapure Milli-Q water at 60 °C.29 After 72 h of stirring at 60 °C, negatively-charged particles were obtained. Some of those particles were post-functionalized by aminopropyl triethoxysilane as described by Badley et al.30Characterization of these particles and their behaviour in biological media has already been reported.31 Their main characteristics are summarized in Table 1 (see ESI-1† for TEM images). It is important to emphasize that the procedure leads to the presence of covalently-grafted fluorophores over the whole particle volume. Through centrifugation, it was possible to separate fluorescent particles from fluorescent soluble species, i.e. FITC-linked silicic acids, that originate from particle dissolution. This allowed the investigation of particle dissolution rate in culture medium (kd,m). In addition, it was demonstrated that the incorporation of the fluorophore had only a minor impact on the solubility rate compared to pure silica particles of similar size.31
| d DLS (nm) | d TEM (nm) | ζ water (mV) | ζ medium (mV) | k d,m (10−4 mg mL−1 h−1) | |
|---|---|---|---|---|---|
| n.d. non-determined. | |||||
| Si + 200 | 230 ± 25 | 175 ± 20 | 50 ± 4 | −3 ± 3 | 470 ± 50 |
| Si + 60 | 60 ± 15 | 40 ± 15 | 56 ± 5 | −5 ± 3 | 25 ± 4 |
| Si + 10 | n.d. | 10 ± 3 | 42 ± 4 | −5 ± 3 | 7 ± 1 |
| Si − 10 | n.d. | 10 ± 3 | −18 ± 4 | −23 ± 4 | 2.1 ± 0.3 |
2.2. In vitro permeation study
Normal human dermal fibroblasts (NHDF, from Promocell) were grown in Dulbecco's modified Eagle culture medium (DMEM, Gibco BRL) supplemented with fetal calf serum (10%, from Gibco BRL), penicillin (100 units mL−1), streptomycin (100 μg mL−1, from Gibco BRL) and fungizone (0.25 μg mL−1, from Gibco BRL). The culture flasks (75 cm2) were kept at 37 °C in 95% humidity and a 5% CO2 atmosphere. At confluence, fibroblasts were removed from cultured flasks by treatment with 0.1% trypsin and 0.02% EDTA. Cells were rinsed and resuspended in the supplemented DMEM media. Fibroblasts were used at passage 6–7 for the experiments.Collagen hydrogels with entrapped fibroblasts were prepared as previously described (Fig. 1).32 Briefly, for collagen hydrogels at 3 mg mL−1 (H3), 1.5 mL of collagen solution in acetic acid at 10 mg mL−1 was mixed with 2.75 mL of culture medium, 0.25 mL of 0.1 M NaOH and 0.5 mL of cell suspension (3.0 × 10⁵ cells mL−1). The mixture was poured into cell culture inserts (pore size 2 μm) adapted to 24-well culture plates and set in an incubator at 37 °C with 95% humidity and a 5% CO2 atmosphere for 24 h before starting the permeation experiment. The volume was adjusted to obtain a 2 mm thick gel in order to have an easily handled gel with a thickness close to that of the dermis. Hydrogels at 1.5 mg mL−1 (H1.5) were prepared following the same protocol using 1.5 mL of a 5 mg mL−1 collagen solution in acetic acid mixed with 2.75 mL of culture medium whereas the 5 mg mL−1 (H5) hydrogels were prepared using 2.5 mL of the 10 mg mL−1 collagen solution mixed with 1.75 mL of culture medium.
 | ||
| Fig. 1 SEM images of (a) acellular and (b) fibroblast-populated 3 mg mL−1 collagen hydrogels (scale bar = 5 μm). | ||
For diffusion experiments, 500 μL of silica nanoparticle suspension (C0 = 0.6 mg mL−1) were deposited onto the surface of the hydrogels and 1 mL fresh culture medium was used as the receptor medium under the culture inserts (Scheme 1). At selected intervals from 1 h to 72 h, 200 μL aliquots of the receptor solution were removed and immediately replaced by an equivalent volume of fresh medium. For each sample, two measurements were performed: the total fluorescence and the fluorescence intensity after centrifugation in a Nanosep 3kD device (15 min, 8300g) to separate the nanoparticles from the solution and have access to the fluorescence of the dissolved forms only. Each experiment was conducted in triplicate. It was checked that the particle suspension deposited directly on the membrane diffused within a few minutes in the receptor compartment and did not influence the dissolution kinetics.
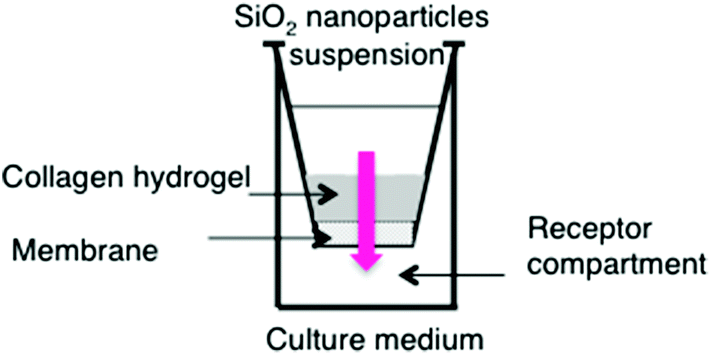 | ||
| Scheme 1 Set-up for diffusion studies. | ||
2.3. Modeling of the diffusion process
Modelling of the diffusion of nanoparticles across collagen hydrogels was performed taking into account the simultaneous adsorption−desorption process. The system is then described by eqn (1) and (2).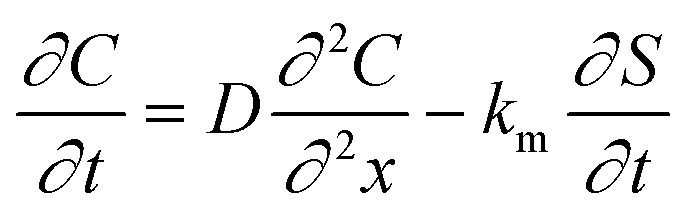 | (1) |
 | (2) |
These two coupled equations were solved numerically by an iterative process. To simplify the equations, it was hypothesized that an equilibrium was reached in the kinetics of the adsorption and desorption processes (i.e. kads = kdes). By varying the diffusion coefficient D and adsorption constant ka we manually adjusted the calculated curve C = f(t) with the experimental data corresponding to the diffusion of particles.
The Stokes–Einstein equation (eqn (3)) was used to calculate the diffusion coefficient DSE of the same particles in water.
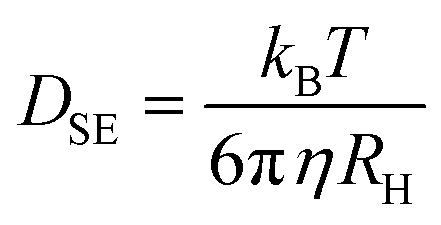 | (3) |
Finally, dissolution of the particles during their diffusion was modelled using eqn (4) after exchanging time t with t − t0, where t0 is the lag-time observed before any soluble species is measured in the reservoir, to side-step the effect of diffusion.
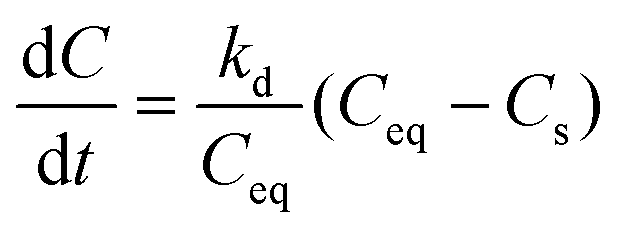 | (4) |
2.4. Toxicological assays
The cellular activity of NHDF cells in the hydrogels was evaluated with the Alamar Blue assay (n = 6).33 After 24 h of exposure, the nanoparticle suspension was removed and kept at 37 °C for further exposure times. Cellularized hydrogels were rinsed with medium and incubated, at 37 °C in a humidified 5% CO2 air atmosphere, for 4 h with a 10% solution of Alamar Blue in phenol red-free culture medium. Absorbance of the medium at 570 nm and 600 nm was recorded using a UV-visible spectrometer and cellular activity was calculated. Gels were rinsed three times and the stored nanoparticle suspension added back until 3 days and then 7 days of exposure. Incubation of silica nanoparticles with Alamar Blue gave negligible absorbance values, suggesting that no false positive results can originate from the particles.In addition, the number of cells was followed by Trypan Blue staining.34 Fibroblasts were removed from the hydrogels by treatment with collagenase (2 mg mL−1, 1 mL per gel) at 37 °C until the gel is completely digested, centrifuged at 400 g for 5 minutes and resuspended in 200 μL of Trypan Blue solution 0.1% in PBS and counted with a Malassez hemocytometer (n = 6).
2.5. Nanoparticle internalization
Internalization of the nanoparticles in fibroblasts immobilized in collagen hydrogels (3 mg mL−1) was studied using fluorescence microscopy. At 24 h and 72 h of exposure to the nanoparticles, gels with entrapped fibroblasts were fixed with 4% paraformaldehyde (24 h, 4 °C), after being washed three times with PBS 1×. The fixed samples were then dehydrated with an ascending ethanol series ending in butanol before inclusion in paraffin to obtain ten-micrometer sections, transverse to the sample surface. These sections were obtained with a manual microtome (Stiassnie, France) and rehydrated. Staining of the membranes with wheat germ agglutinin Alexa Fluor 555 conjugate (Invitrogen) and the endosomes with Blue/Yellow Lysosensor (Invitrogen) was used to investigate the internalization and location of the nanoparticles within the cells. Briefly, the sections were incubated for 30 min at room temperature with Lysosensor, rinsed with HBSS 1× and then incubated for 10 min with the WGA before observation under a fluorescent microscope (Axio 100, Carl Zeiss). The experiments were conducted in triplicate and analysis was performed on at least 10 images.Additional colocalization studies were performed using a laser scanning confocal fluorescent microscope (LSCM 710, Zeiss). Human dermal fibroblast cell culture was treated with Lysosensor Yellow-Blue (2 μM) for 60 min at 37 °C following the supplier's protocol, and then with FITC-labelled nanoparticles (0.6 mg mL−1) for an additional 24 h. The cells were rapidly washed with ice cold PBS to prevent the removal of the attached Lysosensor, fixed, and prepared for visualization under a LSCM. The obtained fluorescence micrographs were further analyzed by quantitative software (ZEISS Zen) to obtain colocalization-related parameters including Mander's overlap coefficient (MOC) and colocalization rate (CR).35
2.6. Statistical analysis
The statistical significance of differences was evaluated by a Wilcoxon–Mann–Whitney test. This test was chosen instead of Student's t test according to the result of a Shapiro–Wilk normality test. A value of P < 0.05 was considered significant.3. Results
3.1. Diffusion of silica nanoparticles in collagen hydrogels
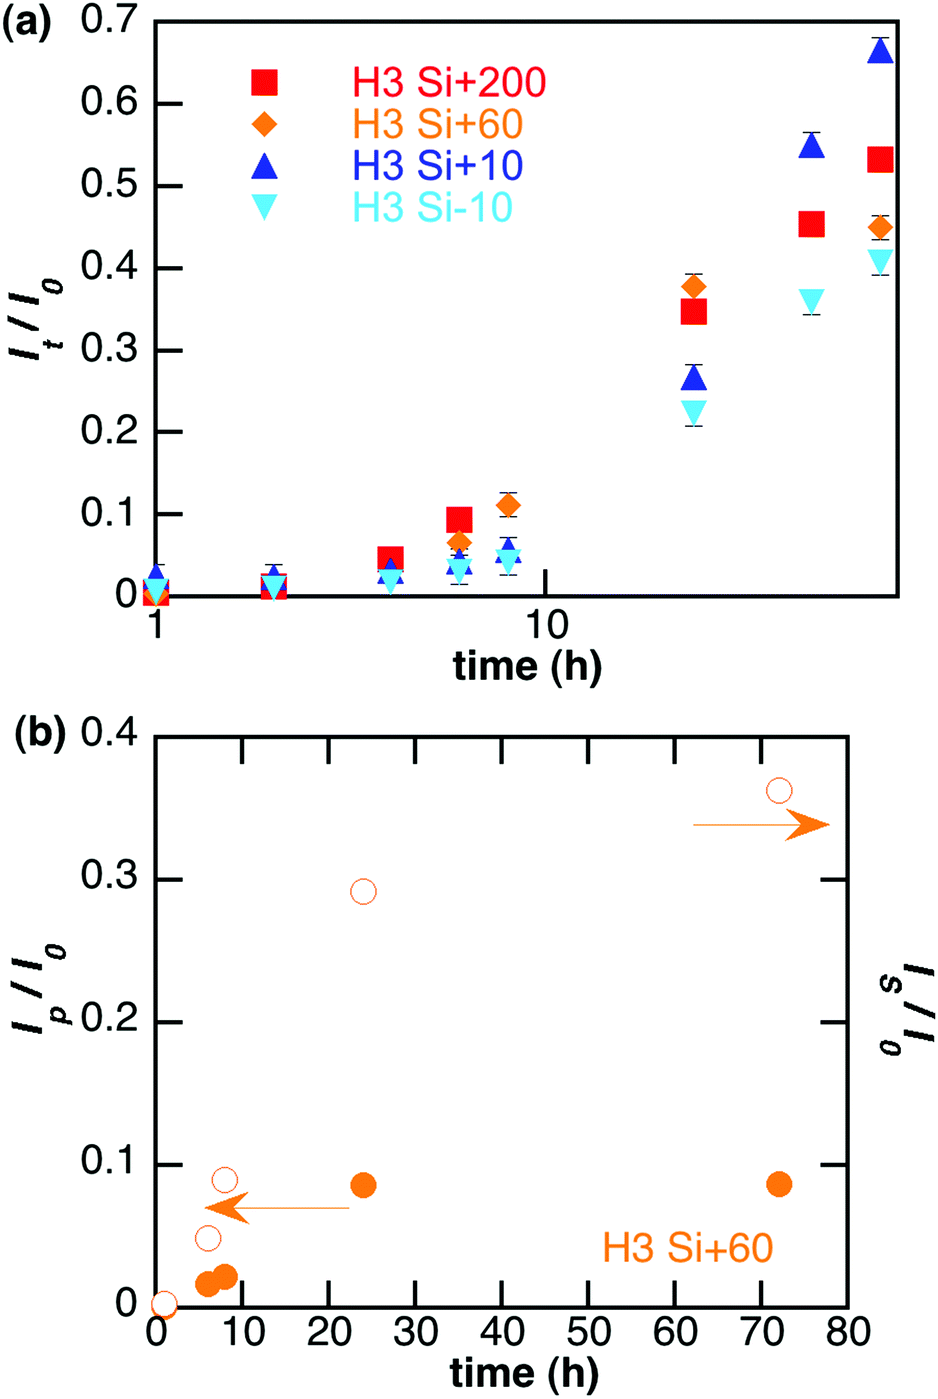 | ||
| Fig. 2 Diffusion of silica nanoparticles of various sizes and charges in 3 mg mL−1 collagen hydrogels. (a) Evolution of total fluorescence intensity in the reservoir (It) over initial particle suspension fluorescence intensity (I0) with time; (b) evolution of fluorescence intensity of nanoparticles (plain circles, Ip) and of soluble forms (empty circles, Is) in the reservoir over I0 for Si + 60 nanoparticles. | ||
To address specifically the diffusion of nanoparticles, the total fluorescence intensity was decomposed into its two components: nanoparticles (Ip) and fluorescent species resulting from the partial dissolution of the particles (Is). Such decomposition is given for Si + 60 particles in Fig. 2(b). Analysis of the repartition of fluorescent species recovered in the reservoir between particles and soluble forms highlights that size and surface charge affect the behaviour of the particles in the gel (Table 2). For positively-charged particles larger than 60 nm, soluble species are mainly recovered whereas for 10 nm particles half of the signal is due to diffused particles. Furthermore, the surface charge of the particles has a significant influence on this phenomenon as less soluble species from negatively charged (Si − 10) particles diffuse through the 3 mg mL−1 collagen hydrogel compared to positive ones (Si + 10).
![[thin space (1/6-em)]](https://www.rsc.org/images/entities/char_2009.gif)
Modelling of the curve corresponding to diffusion of nanoparticles gives an estimation of their diffusion coefficient D in each experiment (Table 2). No significant variation was observed as a function of particle size and charge. Interestingly, the apparent diffusion coefficients for 10 nm particles were comparable to those obtained from the Stokes–Einstein equation for colloids diffusing in water. This was no longer true for larger particles that exhibit higher apparent D values than the calculated ones.
Following evolution of the fluorescence intensity of soluble species out of the gel gives access to the apparent dissolution of the particles (Table 2). An initial lag-time t0 was observed before the recovery of soluble species, which increases when the diameter of the particles decreases and when their surface is negative, indicating a slower intra-gel dissolution for those particles. The dissolution rate was thus estimated by fitting the experimental curves with the dissolution equation (after exchanging time with t − t0 to side-step the effect of diffusion). Interestingly, dissolution rates in the gel (Table 2) are ca. 10–100 times smaller than in culture medium (Table 1) but follow the same evolution regarding the effect of size and charge.
 | ||
| Fig. 3 Diffusion of silica nanoparticles Si + 60 in 1.5 mg mL−1 (H1.5), 3 mg mL−1 (H3) and 5 mg mL−1 (H5) collagen hydrogels. (a) Evolution of total fluorescence intensity in the reservoir (It) over initial particle suspension fluorescence intensity (I0) with time; (b) evolution of fluorescence intensity of Si + 60 nanoparticles (plain circles, Ip) and of soluble forms (empty circles, Is) in the reservoir over I0 for a 5 mg mL−1 hydrogel. | ||
Higher concentrations of collagen hindered the diffusion of particles, both in terms of quantity of particles able to permeate the gel and in terms of kinetics. When the fluorescent signal is decomposed into its two components, nanoparticles and soluble species, it can be observed that collagen concentration impacts on the number of diffused particles, that decrease from 47% in a 1.5 mg mL−1 gel to 6% in a 5 mg mL−1 gel (Table 3). At the same time, the apparent diffusion coefficient is higher in the 1.5 mg mL−1 hydrogel. Concerning the quantity of soluble species released from the gel, doubling the concentration of collagen from 1.5 mg mL−1 to 3 mg mL−1 induces no significant modification, but increasing the collagen concentration up to 5 mg mL−1 decreases the quantity of recovered soluble species. The lag time increases with collagen concentration whereas the apparent dissolution rate decreases.
3.2 Influence of hydrogel cellularization
To assess whether the influence of the cells is passive (hindrance due to the spatial obstruction of the cells and/or passive interaction of the particles with the membrane) or active (internalization), the diffusion of Si + 60 particles in collagen hydrogels containing fibroblast cells fixed prior to their immobilization was studied. No significant difference in the diffusion of nanoparticles was observed compared to living cells (Fig. 4) indicating that the influence of the cells on the diffusion of nanoparticles is mostly a passive phenomenon. However, dead cells strongly decrease the kinetics and yield of soluble forms recovery compared to living cells (Fig. 4).
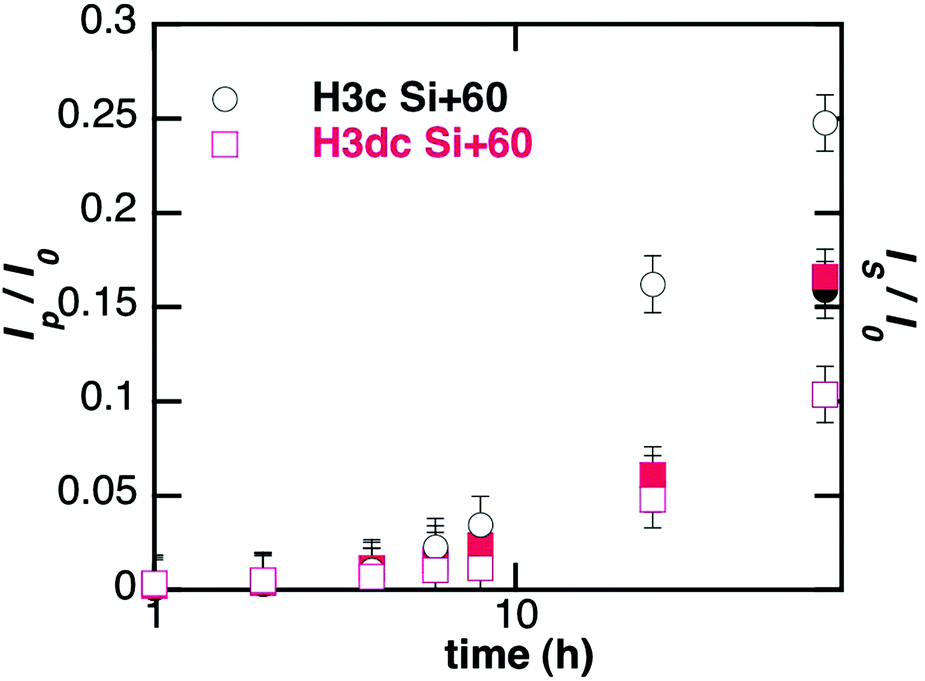 | ||
| Fig. 4 Diffusion of Si + 60 silica nanoparticles in 3 mg mL−1 hydrogels with living fibroblasts (H3c, circles) and with dead cells (H3dc, squares). Evolution of fluorescence intensity of nanoparticles (plain symbols, Ip) and of soluble forms (empty symbols, Is) in the reservoir over total intensity I0. | ||
 | ||
| Fig. 5 (a) Confocal fluorescence optical imaging of a 3 mg mL−1 collagen hydrogel containing fibroblasts after 24 h contact with Si + 60 nanoparticles. Lysosensor Yellow-Blue was used for blue staining of the endosomes. Green fluorescence corresponds to FITC (scale bar = 20 μm). (b) Detailed visualization of an entrapped fibroblast, where the intracellular light-blue color corresponds to a combination of Lysosensor and FITC fluorescence (scale bar = 20 μm). (c) Scatter diagram and pseudo-colored image of colocalization with the corresponding slice as an inset. | ||
Quantitative colocalization analysis is an advanced digital imaging tool to characterize the spatial expression of molecules of interest in immunofluorescence images obtained using confocal microscopy. By obtaining a scatterplot of the individual pixels from the paired images, CR actually represents the percentage of colocalized pixels in the middle sectorial field of plot zone 3 (Fig. 5b) compared to total pixels. MOC indicating an actual overlap of the signals is considered to represent the true degree of colocalization. Image analysis led to a MOC of 0.94, i.e. 94% colocalization between FITC and Lysosensor signals, confirming the intracellular localization of the nanoparticles in lysosomes. Internalisation of the particles in the presence of inhibitors of endocytosis (clathrin- and caveolae-mediated) was also checked by fluorescence microscopy as shown in ESI-3.† The data suggest that endocytosis of silica-nanoparticles in dermal fibroblasts immobilized in a collagen matrix is a combination of clathrin- and/or caveolae-mediated pathways, as already reported for similar cells in 2D culture.24,25,31
The impact of nanoparticles on cell viability was also monitored using cell counting (Trypan Blue staining) and metabolic activity (Alamar Blue assay) experiments after 24 hours and up to two weeks of culture.
Cell counting experiments (Fig. 6a) for 3 mg L−1 hydrogels show the absence of a significant detrimental effect of the particles, except for cells exposed to Si − 10 nanoparticles whose population slightly decreases after 24 h and 72 h. After 7 days of exposure, living cells are in similar or greater numbers when exposed to nanoparticles compared to the control. Metabolic tests provide some information concerning the activity of cells (Fig. 6b). Over the first 7 days, cells have a metabolic activity similar to that of the control, except for Si + 60 at 24 h and Si − 10 at 7 days for which the activity is significantly higher. However, compared to direct exposure, immobilized cells are far less sensitive to the detrimental effects of nanoparticles, especially Si − 10.31 Finally, the cytotoxicity of Si + 60 particles towards fibroblasts entrapped in collagen hydrogels is not modified by collagen concentrations ranging from 1.5 to 5 mg mL−1 (see ESI-4†).
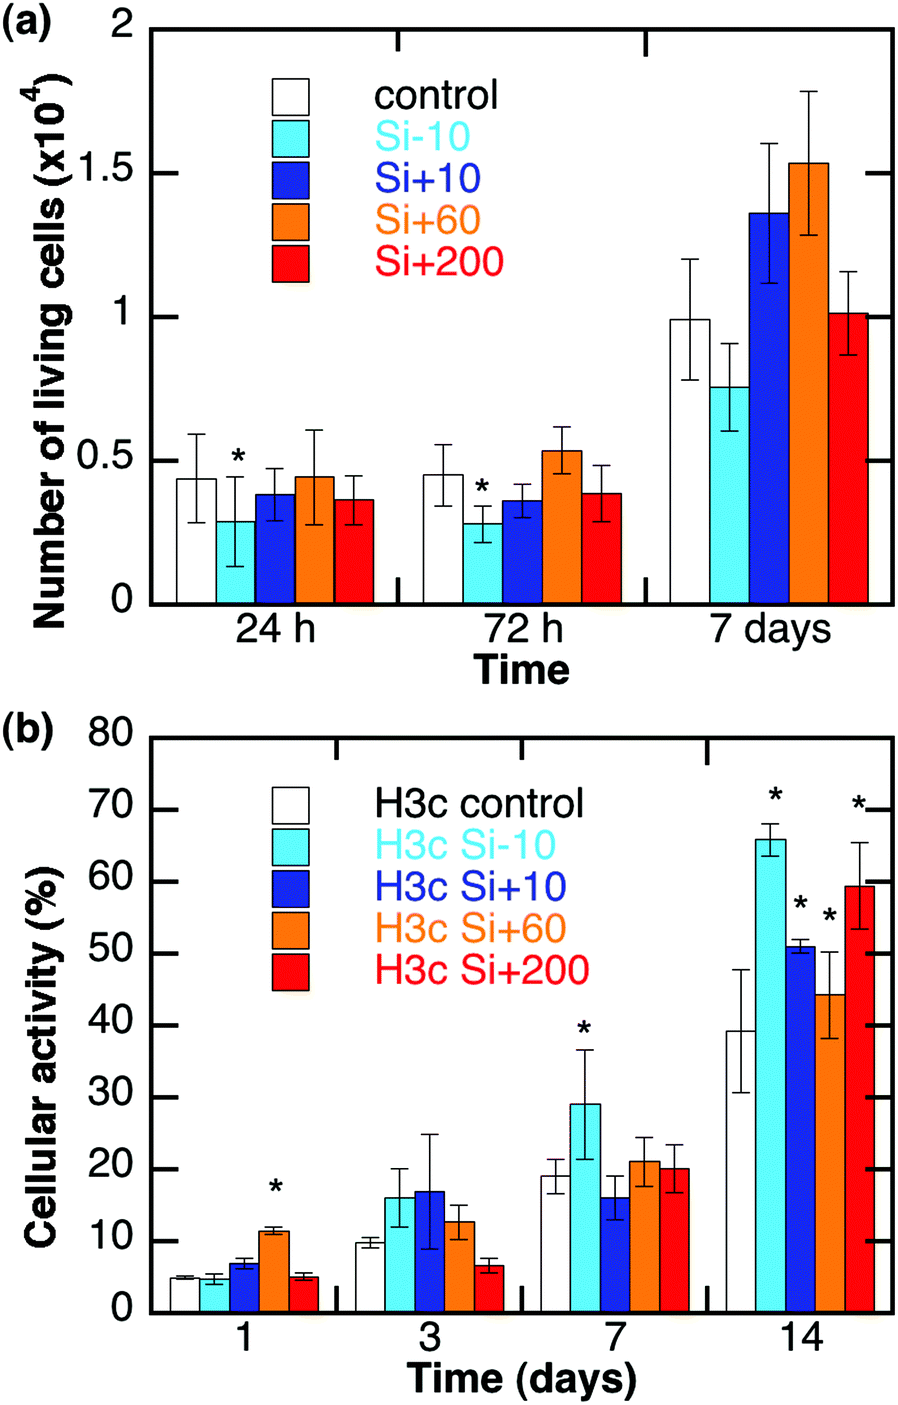 | ||
| Fig. 6 Evolution of (a) number of living cells from Trypan Blue staining and (b) cell metabolism from an Alamar Blue test for immobilized fibroblasts during silica particle diffusion in 3 mg mL−1 collagen hydrogels. When necessary, * indicates statistical significance (p < 0.05) compared to particle-free gels at each time point from the Wilcox test. | ||
4. Discussion
4.1. Fate of silica particles in acellular hydrogels
The transport of nano-sized objects within hydrogels has already been studied to elucidate biological processes.36 In these situations, the diffusing species may exhibit structural flexibility but are considered as chemically-inert.37 In the here-described model, the possibility for silica particles to undergo dissolution during transport introduces another level of complexity, as a population of smaller particles as well as soluble forms are simultaneously produced that will also diffuse (Scheme 2(a)).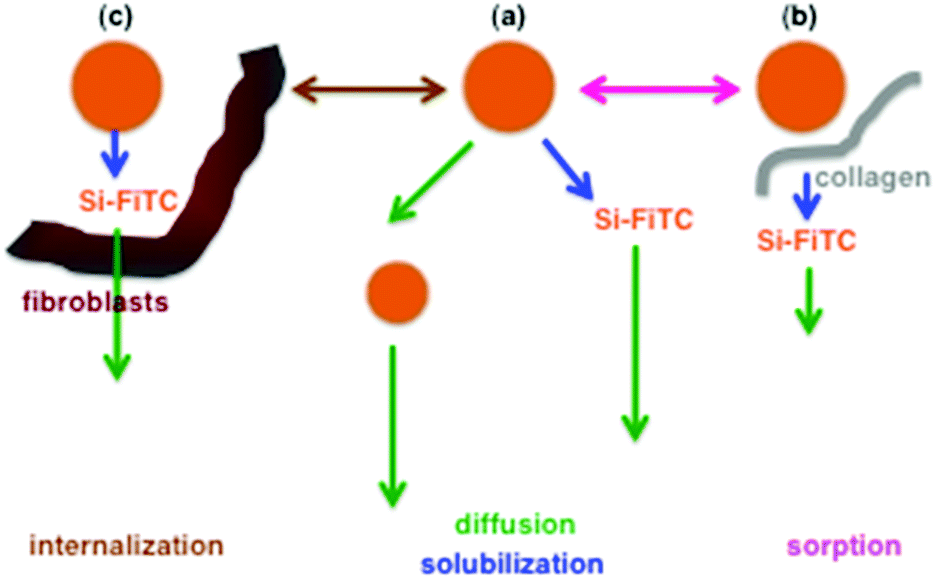 | ||
| Scheme 2 Schematic overview of the fate of silica particles in collagen hydrogels. During transport, particles may (a) undergo solubilization, leading to smaller particles and soluble forms (Si-FITC) that diffuse further, (b) adsorb on collagen fibres, decreasing their apparent solubility, and (c) be uptaken and dissolved by fibroblasts. For the sake of simplicity, the interactions of soluble forms with collagen and cells have been omitted. | ||
The effect of the hydrogel network on diffusion can arise from two phenomena:38 tortuosity that lengthens the path of the species compared to a linear straight displacement, and sorption that temporarily immobilizes the species on the gel internal surface. The former can be effective if the diffusing species dimensions are close to the hydrogel pore size. Here, the 3 mg mL−1 collagen network is macroporous, with pores in the micron-size domain (Fig. 1), i.e. one order of magnitude higher than the largest particles used in this work. Hence such an effect is not expected to significantly modify the diffusion kinetics of the particles or soluble forms.39 As a matter of fact, it was observed that the apparent diffusion coefficient for larger particles was higher than the ones that can be calculated for particles of similar size in water (compare Tables 1 and 2). A plausible explanation is that dissolution induces a continuous decrease in particle size during transport so that the initial particle dimension is not the correct value to be used in the Stokes–Einstein equation. This hypothesis is strengthened by the fact that as the largest particles have the higher dissolution rates, their size decrease is effective very early during the diffusion process. Accordingly, it is interesting to note that Si + 200 particles have a much higher solubility rate than Si + 60 particles in the medium but both species behave very similarly in the long term in the gel system.
Considering sorption processes, a first observation is the systematic decrease of the apparent dissolution rate of the particles from the medium to the gel, this decrease being enhanced at higher collagen concentrations. Accordingly, a delay that increases with decreasing solubility rate is necessary before observing soluble forms in the reservoir, whereas particles are recovered at the beginning of the experiments. In parallel, for fast-dissolving large positively-charged particles, silica is mainly recovered as soluble forms indicating that the time required for particle diffusion is sufficient for extensive dissolution of the particles. For smaller positive particles with slower solubility, a significant amount of particles can be transported as such (or with limited solubilization). However, at the end of the experiment, a similar amount of soluble form is recovered and the total amount of silica species that has diffused through the gel is larger.
One interpretation for these data is that, during transport, a fraction of silica particles is adsorbed on the collagen surface, resulting in the decrease of their rate of dissolution (Scheme 2(b)). This fraction decreases with decreasing particle size (as the available surface per particle is decreasing with its diameter) and with increasing collagen concentration (as the density of collagen is increasing with its concentration) (Table 3). The presence of a negative charge on the particle surface also tends to decrease the amount of sorbed particles, which can be related to the negative charge of collagen above pH 7.40
As far as soluble forms are concerned, the most striking observation is that their final amount is in the 35–40% range for positively-charged particles except for Si + 10 in 5 mg mL−1 hydrogels and for Si − 10 in all gels. This suggests that in these situations, soluble forms also tend to get adsorbed on the collagen surface. Whereas this effect can be easily understood for more concentrated collagen gels, the variation observed for Si − 10 is more difficult to analyze but would indicate that the soluble forms originating from Si + 10 and Si − 10 are different, the latter having a better affinity for collagen than the former.
4.2. Fibroblast–silica interactions in 3D environments
When fibroblast cells are incorporated into the hydrogels, a number of additional processes can occur. From a physico-chemical point of view, cells can be considered as objects with dimensions in the 20–30 μm size range that can modify the tortuosity of the network and provide new surfaces for sorption. As living organisms, they can also uptake and dissolve intra-cellularly silica particles, releasing dissolution products as particles and soluble forms in the medium.31Overall, for positively-charged particles, the presence of cells mainly seems to modify the fate of soluble forms, that are produced in lower amounts but are recovered more rapidly in the reservoir, resulting in almost no change in apparent dissolution rates (compare Tables 2 and 4). In other words, the cellularized gels speed up particle solubilization compared to acellular environments and retain more strongly the soluble forms. Hence cells behave like a new type of sorbent with less affinity for particles and more affinity for soluble silica compared to collagen. Using dead cells does not modify particle diffusion compared to living cells but limits the formation and release of soluble forms. On this basis, it can be proposed that cells, being dead or alive, have a similar ability to interact with silica particles. However, their influence on solubilization depends on their viability, suggesting that some biological activities are involved in this process.
In this context, it was possible to image Si + 200 nanoparticles within immobilized fibroblasts, in agreement with our previous reports on silica particle internalization in the same cells.31 Interestingly, the use of specific inhibitors indicated that the internalization pathways are similar for both surface-seeded and encapsulated cells. Thus, it is reasonable to assume that the intracellular dissolution process that was observed in 2D also takes place here. Coming back to our model experiments, it can therefore be suggested that the influence of immobilized cells on particle diffusion and dissolution is for some part related to their internalization/biodegradation (Scheme 2(c)).
Another interesting outcome of this study is that no significant cytotoxicity of the different particles could be observed for cells in 3D environments whereas Si + 10 and Si − 10 induced a detrimental effect on cell viability under 2D culture conditions at the same silica concentration.31 This can be attributed to the fact that the hydrogel lowers the dose of particles actually reaching the cells at a given time.
5. Conclusions
The results of these experiments bring some interesting information concerning the influence of different parameters on diffusion of silica nanoparticles through a collagen matrix. In particular, they demonstrate the influence of collagen–silica interactions on particle solubility. Noticeably, cellularization also influences the solubilization process through a combination of chemical and biological mechanisms. Indeed our model hydrogels differ from the dermis in several ways: collagen density is low compared to the tissue (ca. 50 mg mL−1), it does not contain other important biomolecules such as elastin and glycosaminoglycans and lacks macrophages and adipocytes. All these can have a major role in the different phenomena that could be identified via our model systems, especially silica particle adsorption on the matrix and cell-mediated dissolution. Nevertheless this work ultimately suggests that a more extensive study of the interactions between soluble forms of silica and living tissues is required to achieve a better understanding of the fate of silica-based nanostructured biomaterials in the human body.Notes and references
- R. Anselmann, J. Nanopart. Res., 2001, 3, 329 CrossRef CAS.
- Synthetic amorphous silica. ECETOC JACC report no. 51, 2006.
- H. S. Schaefer, F. Watts, J. Brod and B. Illel, Follicular penetration, in Prediction of percutaneous penetration. Methods, measurements, modeling, ed. R. C. Scott, R. H. Guy and J. Hadgraft, IBC Technical Services, 1990, pp. 163–173 Search PubMed.
- R. Alvarez-Roman, A. Naik, Y. N. Kalia, R. H. Guy and H. Fessi, J. Controlled Release, 2004, 99, 53 CrossRef CAS PubMed.
- A. K. Kohli and H. O. Alpar, Int. J. Pharm., 2004, 275, 13 CrossRef CAS PubMed.
- A. Vogt, B. Combadiere, S. Hadam, K. M. Stieler, J. Lademann, B. Autran, W. Sterry and U. Blume-Peytavi, J. Invest. Dermatol., 2006, 126, 1316 CrossRef CAS PubMed.
- G. Sonavane, K. Tomada, A. Sano, H. Ohshima, H. Terada and K. Makino, Colloids Surf., B, 2008, 65, 1 CrossRef CAS PubMed.
- J. Wu, W. Liu, C. Xue, S. Zhou, F. Lan, L. Bi, H. Xu, X. Yang and F.-D. Zeng, Toxicol. Lett., 2009, 191, 1 CrossRef CAS PubMed.
- F. F. Larese, F. D'Agostin, M. Crosera, G. Adami, N. Renzi, M. Bovenzi and G. Maina, Toxicology, 2009, 255, 333 CrossRef PubMed.
- H. Nabeshi, T. Yoshikawa, K. Matsuyama, Y. Nakazato, K. Matsuo, A. Arimori, M. Isobe, S. Tochigi, S. Kondoh, T. Hirai, T. Akase, T. Yamashita, K. Yamashita, T. Yoshida, K. Nagano, Y. Abe, Y. Yoshioka, H. Kamada, T. Imazawa, N. Itoh, T. Nakagawa, T. Mayumi, S. Tsunoda and Y. Tsutsumi, Biomaterials, 2011, 32, 2713 CrossRef CAS PubMed.
- M.-A. Bolzinger, S. Briançon and Y. Chevalier, Wiley Interdiscip. Rev. Nanomed. Nanobiotechnol., 2011, 3, 463 CAS.
- J. G. Rouse, J. Yang, J. P. Ryman-Rasmussen, A. R. Barron and N. A. Monteiro-Riviere, Nano Lett., 2007, 7, 155 CrossRef CAS PubMed.
- N. A. Monteiro-Riviere and J. E. Riviere, Nanotoxicology, 2009, 3, 188 CrossRef CAS.
- H. I. Labouta and M. Schneider, Nanomed: Nanotechnol. Biol. Med., 2013, 9, 39 CrossRef CAS PubMed.
- F. Rancan, Q. Gao, C. Graf, S. Troppens, S. Hadam, S. Hackbarth, C. Kembuan, U. Blume-Peytavi, E. Rühl, J. Lademann and A. Vogt, ACS Nano, 2012, 6, 6829 CrossRef CAS PubMed.
- M.-M. Giraud-Guille, C. Hélary, S. Vigier and N. Nassif, Soft Matter, 2010, 6, 4963 RSC.
- E. Mahon, D. R. Hristov and K. A. Dawson, Chem. Commun., 2012, 48, 7970 RSC.
- F. Nakaido, S. Inasawa, Y. Tsuji and Y. Yamaguchi, Bull. Chem. Soc. Jpn., 2013, 86, 520 CrossRef.
- K. S. Finnie, D. J. Waller, F. L. Perret, A. M. Krause-Heuer, H. Q. Lin, J. V. Hanna and C. J. Barbé, J. Sol-Gel Sci. Technol., 2009, 49, 12 CrossRef CAS PubMed.
- Y.-H. Park, J. N. Kim, S. H. Jeong, J. E. Choi, S.-H. Lee, B. H. Choi, J. P. Lee, K. H. Sohn, K. L. Park, M.-K. Kim and S. W. Son, Toxicology, 2010, 267, 178 CrossRef CAS PubMed.
- Y. Zhang, L. Hu, D. Yu and C. Gao, Biomaterials, 2010, 31, 8465 CrossRef CAS PubMed.
- J. S. Chang, K. Chang, D. F. Hwang and Z. L. Kong, Environ. Sci. Technol., 2007, 41, 2064 CrossRef CAS.
- V. Rabolli, L. Thomassen, C. Princen, D. Napierska, L. Gonzalez, M. Kirsch-Volders, P. H. Hoet, F. Huaux, C. E. Kirschhock, J. A. Martens and D. Lison, Nanotoxicology, 2010, 4, 307 CrossRef CAS PubMed.
- D. Drescher, G. Orts-Gil, G. Laube, K. Natte, R. W. Veh, W. Österle and J. Kneipp, Anal. Bioanal. Chem., 2011, 400, 1367 CrossRef CAS PubMed.
- H. Zhang, D. R. Dunphy, X. Jiang, H. Meng, B. Sun, D. Tarn, M. Xue, X. Wang, S. Lin, Z. Ji, R. Li, F. L. Garcia, J. Yang, M. L. Kirk, T. Xia, J. I. Zink, A. Nel and C. J. Brinker, J. Am. Chem. Soc., 2012, 134, 15790 CrossRef CAS PubMed.
- S. Heineman, T. Coradin and M. F. Desimone, Biomater. Sci., 2013, 1, 688 RSC.
- W. Stöber, A. Fink and E. Bohn, J. Colloid Interface Sci., 1968, 26, 62 CrossRef.
- A. van Blaaderen and A. Vrij, Langmuir, 1992, 8, 2921 CrossRef CAS.
- L. C. J. Thomassen, A. Aerts, V. Rabolli, D. Lison, L. Gonzalez, M. Kirsch-Volders, D. Napierska, P. H. Hoet, F. Huaux, C. E. Kirschhock and J. A. Martens, Langmuir, 2010, 26, 328 CrossRef CAS PubMed.
- R. D. Badley, W. T. Ford, F. J. Mc Enroe and R. A. Assink, Langmuir, 1990, 6, 792 CrossRef CAS.
- S. Quignard, G. Mosser, M. Boissière and T. Coradin, Biomaterials, 2012, 33, 4431 CrossRef CAS PubMed.
- (a) C. Hélary, I. Bataille, A. Abed, C. Illoul, A. Anglo, L. Louedec, D. Letourneur, A. Meddahi-Pellé and M.-M. Giraud-Guille, Biomaterials, 2010, 31, 481 CrossRef PubMed; (b) C. Hélary, A. Abed, G. Mosser, L. Louedec, A. Meddahi-Pellé and M.-M. Giraud-Guille, J. Tissue Eng. Regen. Med., 2011, 5, 248 CrossRef PubMed.
- S. L. Voytik-Haribin, A. O. Brightman, B. Waisner, C. H. Lamar and S. F. Badylak, In Vivo Cell Dev. Biol.-Animal, 1998, 34, 239 Search PubMed.
- S. Perry, L. Epstein and H. Gelbard, BioTechniques, 1997, 2, 1020 Search PubMed.
- E. M. Manders, F. J. Verbeek and J. A. Aten, J. Microsc., 1993, 169, 375 CrossRef.
- O. Lieleg and K. Ribbeck, Trends Cell Biol., 2011, 21, 543 CrossRef CAS PubMed.
- A. Pluen, P. A. Netti, R. K. Jain and D. A. Berk, Biophys. J., 1999, 77, 542 CrossRef CAS.
- J. Gutenwik, B. Nilsson and A. Axelsson, AIChE J., 2004, 50, 3006 CrossRef CAS.
- S. Ramanujan, A. Pluen, T. D. McKee, E. B. Brown, Y. Boucher and R. K. Jain, Biophys. J., 2002, 83, 1650 CrossRef CAS.
- D. Eglin, K. L. Shafran, J. Livage, T. Coradin and C. C. Perry, J. Mater. Chem., 2006, 16, 4220 RSC.
Footnote |
| † Electronic supplementary information (ESI) available: TEM images of particles; effect of cells on particle diffusion; fluorescence microscopy imaging of internalization without and with inhibitors; metabolic activity of cells in collagen hydrogels of various concentrations. See DOI: 10.1039/c3bm60214a |
| This journal is © The Royal Society of Chemistry 2014 |