A novel nonenzymatic hydrogen peroxide sensor based on three-dimensional porous Ni foam modified with a Pt electrocatalyst
Xingping
Lu
a,
Xianping
Xiao
a,
Zhuang
Li
b,
Fugang
Xu
a,
Hongliang
Tan
a,
Lanlan
Sun
c and
Li
Wang
*a
aKey Laboratory of Functional Small Organic Molecule, Ministry of Education, College of Chemistry and Chemical Engineering, Jiangxi Normal University, Nanchang 330022, China. E-mail: lwanggroup@aliyun.com; Fax: +86 791 88120861; Tel: +86 791 88120861
bState Key Laboratory of Electroanalytical Chemistry, Changchun Institute of Applied Chemistry, Chinese Academy of Sciences, Changchun 130022, China
cState Key Laboratory of Luminescence and Applications, Changchun Institute of Optics, Fine Mechanics and Physics, Chinese Academy of Sciences, 3888 East Nan-Hu Road, Changchun 130033, China
First published on 29th October 2013
Abstract
A novel nonenzymatic hydrogen peroxide (H2O2) sensor was simply prepared by depositing Pt nanoparticles (Pt NPs) onto Ni foam using UV-irradiation. Scanning electron microscopy was applied to characterize the changes of morphologies with UV-irradiation time. Energy dispersive spectroscopy confirmed that the Pt NP–Ni foam was mainly composed of Pt and Ni. The Pt NP–Ni foam electrode shared the unique advantages of Pt NPs (such as the good electrocatalytic activity) and Ni foam (such as the high electric conductivity, large surface area and high porosity). Its application in H2O2 detection, surprisingly, showed the high sensitivity and low detection limit. The linear range was from 0.005 to 0.85 mM. The sensitivity was 829 μA cm−2 mM−1 and the detection limit was 0.3 μM (S/N = 3). The H2O2 sensor also showed long-term stability. Therefore, the sensor is more suitable for the detection of H2O2 concentration.
1. Introduction
Ni foam, as a kind of commercial material with excellent electronic conductivity and a desirable three-dimensional (3D) network structure, can provide a high specific surface area and high porosity and accordingly become the ideal substrate material to immobilize an electrocatalyst.1 It not only reduces the diffusion resistance of electrolytes but also facilitates the ion transportation and maintains the very smooth electron pathways in the electrochemical reactions.1,2 Therefore, Ni foam has been widely used in electrode materials.Recently, in order to improve the catalytic activity of Ni, some precious metals or other chemicals were deposited onto the Ni foam and employed in various fields, such as fuel cells,3–10 electrolysis of water,11 hydrogen storage,12 degradation of pollutants13 and so on. Generally, there are two kinds of methods to synthesize Ni foam-based electrode materials. One is the spontaneous deposition method, in which a precious metal replaces parts of Ni in the Ni foam and forms a composite electrode through displacement reaction. For example, a Pd-modified Ni foam electrode was prepared by a spontaneous deposition method and used as anodes for the oxidation of methanol, ethanol, ethylene glycol, and glycerol in basic media.14 Ni foams modified with Rh and Pt were synthesized by a spontaneous deposition method and used for catalytic partial oxidation of methane–hydrogen.15 The other is an electrodeposition method. For example, a 3D hierarchical-structured Pd electrode has been successfully fabricated by directly electrodepositing Pd nanoparticles (NPs) onto the Ni foam for direct ethanol fuel cells.16 Yang et al. also prepared a nanostructured Ag/Ni foam cathode by using an electrodeposition method for an aluminum-hydrogen peroxide fuel cell.3
To date, electrochemical sensors based on the Ni foam modified electrode were rarely reported. To the best of our knowledge, only Lu et al.17 recently reported the first use of commercially available 3D porous Ni foam as a novel electrochemical sensing platform for sensitive and selective nonenzymatic glucose detection. However, Ni foam used in the construction of an H2O2 sensor has no related reports. H2O2 is a kind of very common disinfectant, and widely applied for disinfection treatment of the water pools, food and beverage packaging.18 At the same time, it is also an essential mediator in biochemistry, food, pharmaceutical, clinical, and environmental analysis.19 Therefore, efficient and accurate detection of trace amounts of H2O2 is greatly important. So far, various techniques have been developed for the determination of H2O2, including chemiluminescence,20 fluorescence spectroscopy,21 spectrophotometry22 and electrochemical method.23,24 Among them, the electrochemical method has attracted a great deal of interest in recent years due to its low cost, simple operation, good stability, easy miniaturization and automation.25 The electrochemical H2O2 biosensors based on an enzyme modified electrode have obtained comprehensive development, owing to their good sensitivity and selectivity towards electrocatalytic reduction of H2O2.26–29 However, an enzyme is expensive and easily loses activity in the immobilization process, which restricts the development and application of enzyme H2O2 sensors. Therefore, it is significant to develop a nonenzymatic platform for the detection of trace amounts of H2O2.
Pt NPs have been widely used in the construction of electrochemical sensors due to their strong surface plasmon resonance,30 high electron transfer,31 and superior electrocatalytic activity.32 For example, a Prussian blue@Pt NP/carbon nanotube composite material modified glassy carbon electrode (GCE) was used for efficient determination of H2O2.33 Controlled synthesis of a Pt NP array through electroreduction of cisplatin bound to a nucleobases terminated surface and application for H2O2 and glucose sensing were reported by Ji and co-workers.34 All these conventional modified electrodes can achieve a lower detection limit, but the construction process is complex and the sensitivity is not good enough.
Based on the above discussion, this work intends to share the unique advantages of Pt NPs and Ni foam, and construct a new nonenzymatic platform for the detection of H2O2. Pt NPs were deposited onto the Ni foam to form the Pt NP–Ni foam composite by UV-irradiation, and then directly used as electrodes to detect H2O2. This sensor showed high sensitivity and low detection limit. And the preparation method is simple, efficient, cheap and easy for mass production, and accordingly provides a new platform for nonenzymatic detection of H2O2.
2. Experimental
2.1 Materials
Ni foam with a purity of ≥99.6% was purchased from Changsha Lyrun Material Co., Ltd., China. Chloroplatinic acid (H2PtCl6) was purchased from Sigma-Aldrich. Sodium dihydrogen phosphate (NaH2PO4), disodium hydrogen phosphate (Na2HPO4) and 30% H2O2 were provided by the Beijing Chemical Company (Beijing, China). All reagents were of analytical grade and used without further purification. Phosphate buffer solution (PBS, 0.2 M) was prepared by mixing the solution of 0.2 M Na2HPO4 and 0.2 M NaH2PO4 at various volume ratios. All solutions were prepared with ultra-pure water which was purified by a Millipore-Q System (18.2 MΩ cm−1).2.2 Apparatus
Scanning electron microscopy (SEM), and X-ray energy dispersive spectroscopy (EDS) measurements were performed on an XL30 ESEM FEG scanning electron microscope equipped with an energy dispersive X-ray analyzer at an accelerating voltage of 10 kV.All electrochemical measurements were performed with a CHI 660A electrochemical workstation at room temperature. The experiments were based on a conventional three-electrode system composed of modified Ni foam as a working electrode, a platinum plate as an auxiliary electrode and a saturated calomel electrode (SCE) as a reference electrode. Cyclic voltammetric (CV) experiments were carried out in a quiescent solution. The amperometric experiments were performed in a continuous stirring solution using a magnetic stirrer. 10 mL of 0.2 M PBS (pH 7.4) was employed as the supporting electrolyte solution. And it was purged with high purity nitrogen for 20 minutes prior to experiments and blanketed with nitrogen during electrochemical experiments.
2.3 Preparation of the Pt NP–Ni foam electrode
Ni foam (approximately 0.5 cm × 0.6 cm) was carefully cleaned with 6 M HCl solution in an ultrasound bath for 20 min in order to remove the NiO layer on the surface, and then rinsed with ultra-pure water and absolute ethanol, respectively. The Ni foam was immersed into 1 mM H2PtCl6, and then the UV-irradiation was performed with a 15 W UV lamp for different times without agitation (irradiation line: 253.7 nm and intensity: 30 μW cm−2).3. Results and discussion
3.1 Characteristics of the Pt NP–Ni foam electrode
The SEM technique was used to characterize the Pt NPs deposited onto the Ni foam under the UV-irradiation for 20 min. Fig. 1A shows a large-scale SEM image of the composite materials. It clearly indicated that the Ni foam was a 3D cross-linked grid structure, which provided a high specific surface area and high porosity. The pore size was about a few hundred microns. Fig. 1B and C show different magnification SEM images of the composite materials, indicating that the Pt NPs deposited onto the surface of the Ni foam were uniform and dense. EDS was used to study the composition of the Pt NP–Ni foam electrode (Fig. 1D). It revealed that the composite material was mainly composed of Ni and Pt elements, which further proved that the Pt NPs were successfully deposited onto the Ni foam.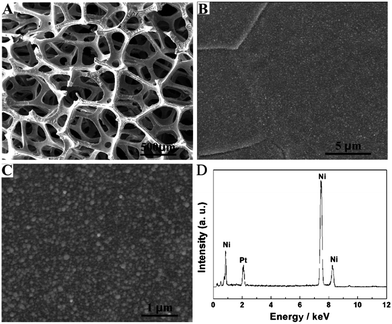 | ||
| Fig. 1 (A) Low- and (B and C) high-magnified SEM images of Pt NP–Ni foam, and (D) the corresponding EDS of Pt NP–Ni foam. UV irradiation time: 20 min. | ||
The morphologies of the Pt NP–Ni foam composite electrode could be controlled by different UV-irradiation times. The SEM technique was used to characterize the morphology of Pt NPs on the surface of the Ni foam under different UV-irradiation times (varied from 5 to 60 min). In the absence of UV-irradiation (Fig. 2A), the surface of the Ni foam was smooth and there was no Pt NPs attached onto it. When the UV-irradiation time is 5 min (Fig. 2B), the Ni foam surface was uniformly covered with many small Pt NPs. As the UV-irradiation time was increased from 10 to 30 min (Fig. 2C–E), the diameter of the Pt NPs gradually increased and the surface of Ni foam became relatively rough. After the UV-irradiation time was increased to 60 min (Fig. 2F), the surface of Ni foam was covered with layers of Pt NPs and thus resulted in a compact Pt NP film.
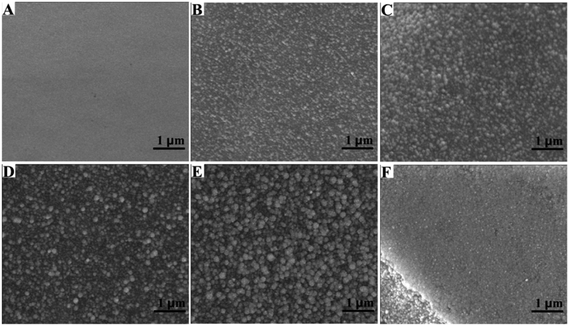 | ||
| Fig. 2 SEM images of Pt NP–Ni foam obtained under different UV irradiation times: (A) 0 min, (B) 5 min, (C) 10 min, (D) 20 min, (E) 30 min and (F) 60 min. | ||
The diameter of the Pt NPs deposited onto the surface of Ni foam under different UV-irradiation times was summarized in Fig. 3A–D. When the UV-irradiation time was 5 min (Fig. 3A), the diameter of the Pt NPs was distributed between 40 and 80 nm, and the average diameter of which was about 58 nm. When the UV-irradiation time was increased to 10 min (Fig. 3B), the average diameter of Pt NPs was also increased to 77 nm. In both cases, the diameter of the Pt NPs was uniform. However, when the UV-irradiation time was increased to 20 min (Fig. 3C), the diameter of Pt NPs was mainly concentrated around 85 nm, and some parts of the Pt NPs were increased to 110–130 nm in diameter. When the UV-irradiation time was 30 min (Fig. 3D), the aggregation further occurred. As a result, the Pt NPs were mainly distributed between 120 and 150 nm, and the average diameter was increased to 143 nm.
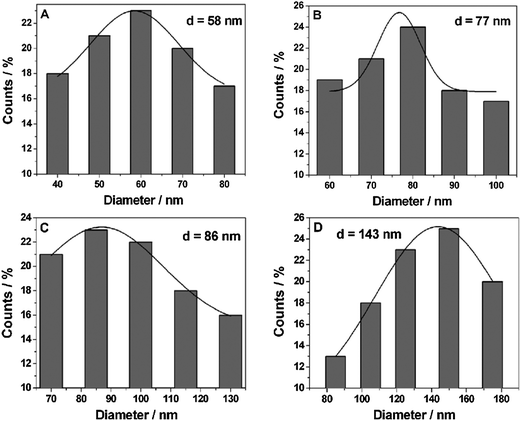 | ||
| Fig. 3 The particle size distribution of Pt NPs obtained under different UV irradiation times: (A) 5 min, (B) 10 min, (C) 20 min and (D) 30 min. | ||
According to the above results and previous conclusion, the growth of Pt NPs on the Ni foam could be expressed as follows.35 At first, the H2PtCl6 was reduced into a Pt atom under UV-irradiation. And then the Pt atom adsorbed onto the Ni foam and formed Pt nuclei. With the increase of UV-irradiation time, a large number of Pt atoms covered the whole Ni foam surface. To further increase the UV-irradiation time, newly formed Pt atoms adsorbed onto Pt nuclei to form small Pt NPs. Subsequently, the small Pt NPs aggregated gradually and grew into big Pt NPs. So the average diameter of Pt NPs increased gradually. Finally, when the UV-irradiation time was increased to 60 min, Pt NPs coalesced and covered the whole surface of the Ni foam and turned into a compact Pt NP layer.
3.2 Electrocatalytic behaviors of H2O2 on the Pt NP–Ni foam electrode
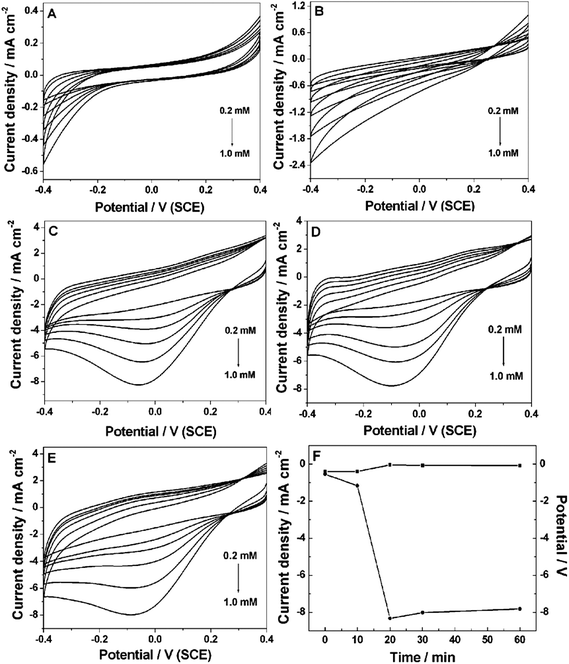
The electrochemical behaviors of the Pt NP–Ni foam electrode obtained under different UV-irradiation times were investigated by CVs in 0.2 M PBS (pH 7.4). Fig. 4A shows the Pt NP–Ni foam electrode without UV-irradiation toward the catalytic reduction of H2O2. The reduction started at about −0.2 V and maximized at −0.4 V. However, in the entire potential window (+0.4 V to −0.4 V), no redox peak was observed. When the UV-irradiation time was increased to 10 min (Fig. 4B), the result was similar to the above one with only higher catalytic current. Fig. 4C shows the Pt NP–Ni foam electrode obtained under UV-irradiation of 20 min toward the catalytic reduction of H2O2. It clearly showed that the catalytic current started at 0.2 V and a significant reduction peak appeared at −0.05 V. Compared with that under 10 min of UV-irradiation, the catalytic current was dramatically increased with the increase of H2O2 concentration. It was noticeable that the current of the electric double layer became very large. It could be ascribed to the fact that a large number of Pt NPs loaded onto the Ni foam further increased the surface area of the electrode. As shown in Fig. 4D and E, with further increase in the UV-irradiation time, no obvious change of catalytic current occurred. The catalytic potential showed a negative shift and the electric double layer current slightly decreased. It might be because the Pt NPs were aggregated and formed a compact surface, which resulted in the decrease of the effective specific surface area of the electrode under a long UV-irradiation time. Fig. 4F shows the peak currents and peak potentials for H2O2 catalytic reduction versus the UV-irradiation time. It clearly showed that the optimum time of UV-irradiation was 20 min. Under this condition, the composite electrode for the reduction of H2O2 showed lower catalytic potential and higher current.3.3 Amperometric response of the Pt NP–Ni foam electrode to H2O2
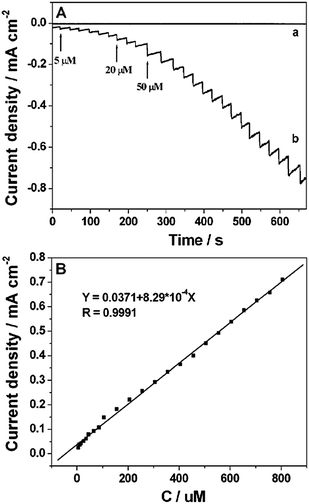
Amperometric measurements were carried out by successive injection of H2O2 (curve b in Fig. 5A) into 0.2 M PBS (pH 7.4) under stirring at 0 V on the Pt NP–Ni foam electrode which was obtained under the UV-irradiation time of 20 min. It clearly showed that the reduction current reached a maximum steady-state value within 5 s. The linear range of the H2O2 detection was from 5 μM to 850 μM (R = 0.9991) with a sensitivity of 829 μA cm−2 mM−1. And the detection limit was estimated to be 0.3 μM based on the criterion of a signal-to-noise ratio of 3 (S/N = 3) (Fig. 5B). For comparison, the amperometric response of the bare Ni foam electrode towards the reduction of H2O2 was also investigated. As shown by curve a in Fig. 5A, there was no obvious amperometric response at the bare Ni foam electrode. The sensing performance of the Pt NP–Ni foam electrode was also better than that of the Pt NP–Ni layer electrode because the large surface area and high porosity of the Ni foam could improve the electrochemical property of the composite by increasing the loaded amount of Pt NPs. A comparison of the H2O2 assay performance of this sensor with those of other Pt-based sensors36–44 was shown in Table 1. Taking the Pt/TeO2-nanowire electrode as an example,43 the sensitivity (130.6 μA cm−2 mM−1) and the detection limit (0.6 μM) were worse than those of the as-prepared Pt NP–Ni foam electrode, although the linear range was wider (0.002–16 mM). By comparing, it can be clearly seen that the Pt NP–Ni foam electrode exhibited a reasonable linear range, the highest sensitivity among these sensors, and the lowest detection limit except for Pt–SnO2@C/GCE which exhibited a narrow linear range. The good performance might be due to the special properties of the Pt NP–Ni foam composite material, such as the large surface area, good electrical conductivity, 3D porous structure and good catalytic reduction activity toward the reduction of H2O2.| Sensor | Sensitivity (μA cm−2 mM−1) | Linear range (mM) | Detection limit (μM) | Reference |
|---|---|---|---|---|
| a Graphene. b Poly(3,4-ethylenedioxythiophene). c Screen printed carbon electrode. d Multi-walled carbon nanotubes. e Polyaniline. f Multi-walled carbon nanotube clusters. g Screen printed gold nanofilm electrode. h Poly(vinyl alcohol). i Polydiallyldimethylammonium chloride. j Graphene oxide. k Nanowires. | ||||
| GNa–Pt/GCE | — | 0.002–0.71 | 0.5 | 36 |
| Pt nanoflower/Au electrode | — | 0.10–0.90 | 60 | 37 |
| PEDOTb–Pt NP/SPCEc | 19.29 | 0.50–6.0 | 1.6 | 38 |
| Pt/MWCNTd–PANIe/GCE | 748.4 | 0.007–2.5 | 2.0 | 39 |
| Pt NP/MWCNTCf/SPGFEg | — | 0.005–2.0 | 1.23 | 40 |
| PVAh–MWCNT–Pt NP/GCE | 122.63 | 0.002–3.8 | 0.7 | 41 |
| PDDAi/t-GOj–Pt/GCE | 353.86 | 0.001–5.0 | 0.65 | 42 |
| Pt/TeO2-NWk electrode | 130.6 | 0.002–16 | 0.6 | 43 |
| Pt–SnO2@C/GCE | 241.1 | 0.001–0.17 | 0.1 | 44 |
| Pt NP–Ni foam electrode | 829 | 0.005–0.85 | 0.3 | This work |
3.4 Reproducibility and stability of the Pt NP–Ni foam electrode
The reproducibility and stability of the as-prepared sensor were also investigated. After the sensor was stored in the inverted beaker at room temperature for 30 days, the current response to 0.2 mM H2O2 was decreased by 4.2%. To evaluate the reproducibility of the same sample, the same sensor was used to detect 0.2 mM H2O2 5 times and a relatively standard deviation (RSD) of 4.7% was obtained. To test the electrode-to-electrode reproducibility, five sensors were prepared under the same condition. The responses of the five sensors toward 0.2 mM H2O2 were measured with a RSD of 9.6%. The good reproducibility of the results indicated the reliability of the sensors.4. Conclusions
In this paper, Pt NPs were deposited onto the Ni foam by using UV-irradiation for the first time to construct a new nonenzymatic platform for the detection of H2O2. The Pt NP–Ni foam composite electrode shared the high electric conductivity, large surface area, high porosity of Ni foam and the good electrocatalytic activity of Pt NPs. So the detection of H2O2 showed a low detection limit, high sensitivity, reasonable linear range, good reproducibility and long-term stability. In addition, the sensor preparation method was simple, rapid, cheap and easy for mass production, and accordingly provided a new platform for nonenzymatic detection of H2O2. The sensing performance of the Pt NP–Ni foam electrode was better than that of the Pt NP–Ni layer electrode because the large surface area and high porosity of Ni foam could improve the electrochemical property of the composite by increasing the loaded amount of Pt NPs.Acknowledgements
This work was financially supported by the National Natural Science Foundation of China (21165010 and 21101146), the Young Scientist Foundation of Jiangxi Province (20122BCB23011), the Foundation of Jiangxi Educational Committee (GJJ13244), the Open Project Program of Key Laboratory of Functional Small organic molecule, Ministry of Education, Jiangxi Normal University (no. KLFS-KF-201214; KLFS-KF-201218) and the Innovation Foundation for graduate student of Jiangxi Normal University.References
- G. W. Yang, C. L. Xu and H. L. Li, Chem. Commun., 2008, 6537–6539 RSC.
- D. R. Rolison, J. W. Long, J. C. Lytle, A. E. Fischer, C. P. Rhodes, T. M. McEvoy, M. E. Bourg and A. M. Lubers, Chem. Soc. Rev., 2009, 38, 226–252 RSC.
- W. Yang, S. Yang, W. Sun, G. Sun and Q. Xin, J. Power Sources, 2006, 160, 1420–1424 CrossRef CAS PubMed.
- W. Yang, S. Yang, W. Sun, G. Sun and Q. Xin, Electrochim. Acta, 2006, 52, 9–14 CrossRef CAS PubMed.
- E. Verlato, S. Cattarin, N. Comisso, P. Guerriero, M. Musiani and L. Vázquez-Gómez, Electrochem. Commun., 2010, 12, 1120–1123 CrossRef CAS PubMed.
- F. Bidault, D. J. L. Brett, P. H. Middleton, N. Abson and N. P. Brandon, Int. J. Hydrogen Energy, 2009, 34, 6799–6808 CrossRef CAS PubMed.
- D. Cao, Y. Gao, G. Wang, R. Miao and Y. Liu, Int. J. Hydrogen Energy, 2010, 35, 807–813 CrossRef CAS PubMed.
- Y. Cheng, Y. Liu, D. Cao, G. Wang and Y. Gao, J. Power Sources, 2011, 196, 3124–3128 CrossRef CAS PubMed.
- F. Bidault, D. J. L. Brett, P. H. Middleton, N. Abson and N. P. Brandon, Int. J. Hydrogen Energy, 2010, 35, 1783–1788 CrossRef CAS PubMed.
- Y. Yamauchi, M. Komatsu, A. Takai, R. Sebata, M. Sawada, T. Momma, M. Fuziwara, T. Osaka and K. Kuroda, Electrochim. Acta, 2007, 53, 604–609 CrossRef CAS PubMed.
- H. He, H. Liu, F. Liu and K. Zhou, Surf. Coat. Technol., 2006, 201, 958–964 CrossRef CAS PubMed.
- J. M. Skowroński, A. Czerwiński, T. Rozmanowski, Z. Rogulski and P. Krawczyk, Electrochim. Acta, 2007, 52, 5677–5684 CrossRef PubMed.
- B. Yang, G. Yu and D. Shuai, Chemosphere, 2007, 67, 1361–1367 CrossRef CAS PubMed.
- E. Verlato, S. Cattarin, N. Comisso, A. Gambirasi, M. Musiani and L. Vázquez-Gómez, Electrocatalysis, 2011, 3, 48–58 CrossRef PubMed.
- S. Cimino, L. Lisi, G. Mancino, M. Musiani, L. Vázquez-Gómez and E. Verlato, Int. J. Hydrogen Energy, 2012, 37, 17040–17051 CrossRef CAS PubMed.
- Y.-L. Wang, Y.-Q. Zhao, C.-L. Xu, D.-D. Zhao, M.-W. Xu, Z.-X. Su and H.-L. Li, J. Power Sources, 2010, 195, 6496–6499 CrossRef CAS PubMed.
- W. Lu, X. Qin, A. M. Asiri, A. O. Al-Youbi and X. Sun, Analyst, 2013, 138, 417–420 RSC.
- N. A. Sitnikova, A. V. Borisova, M. A. Komkova and A. A. Karyakin, Anal. Chem., 2011, 83, 2359–2363 CrossRef CAS PubMed.
- D. Ye, Y. Xu, L. Luo, Y. Ding, Y. Wang, X. Liu, L. Xing and J. Peng, Colloids Surf., B, 2012, 89, 10–14 CrossRef CAS PubMed.
- B. Li, Z. Zhang and Y. Jin, Sens. Actuators, B, 2001, 72, 115–119 CrossRef CAS.
- Y.-Z. Li and A. Townshend, Anal. Chim. Acta, 1998, 359, 149–156 CrossRef CAS.
- K. Sunil and B. Narayana, Bull. Environ. Contam. Toxicol., 2008, 81, 422–426 CrossRef CAS PubMed.
- S. Liu, J. Tian, J. Zhai, L. Wang, W. Lu and X. Sun, Analyst, 2011, 136, 2037–2039 RSC.
- Y. Zhang, S. Liu, L. Wang, X. Qin, J. Tian, W. Lu, G. Chang and X. Sun, RSC Adv., 2012, 2, 538–545 RSC.
- J. Tian, Y. Luo, H. Li, W. Lu, G. Chang, X. Qin and X. Sun, Catal. Sci. Technol., 2011, 1, 1393–1398 CAS.
- J. Song, J. Xu, P. Zhao, L. Lu and J. Bao, Microchim. Acta, 2010, 172, 117–123 CrossRef.
- S. Xu, X. Zhang, T. Wan and C. Zhang, Microchim. Acta, 2010, 172, 199–205 CrossRef.
- L. Zhang, Biosens. Bioelectron., 2008, 23, 1610–1615 CrossRef CAS PubMed.
- J. Huang, J. Zheng and Q. Sheng, Microchim. Acta, 2011, 173, 157–163 CrossRef CAS.
- M. C. Daniel and D. Astruc, Chem. Rev., 2004, 104, 293–346 CrossRef CAS PubMed.
- J. Jia, B. Wang, A. Wu, G. Cheng, Z. Li and S. Dong, Anal. Chem., 2002, 74, 2217–2223 CrossRef CAS.
- W. Yang, X. Wang, F. Yang, C. Yang and X. Yang, Adv. Mater., 2008, 20, 2579–2587 CrossRef CAS.
- J. Zhang, J. Li, F. Yang, B. Zhang and X. Yang, Sens. Actuators, B, 2009, 143, 373–380 CrossRef PubMed.
- S. Ji, Q. Guo, Q. Yue, L. Wang, H. Wang, J. Zhao, R. Dong, J. Liu and J. Jia, Biosens. Bioelectron., 2011, 26, 2067–2073 CrossRef CAS PubMed.
- J. Ma, A. Habrioux, M. Pisarek, A. Lewera and N. Alonso-Vante, Electrochem. Commun., 2013, 29, 12–16 CrossRef CAS PubMed.
- F. Xu, Y. Sun, Y. Zhang, Y. Shi, Z. Wen and Z. Li, Electrochem. Commun., 2011, 13, 1131–1134 CrossRef CAS PubMed.
- J. Wan, W. Wang, G. Yin and X. Ma, J. Cluster Sci., 2012, 23, 1061–1068 CrossRef CAS PubMed.
- L. C. Chang, H. N. Wu, C. Y. Lin, Y. H. Lai, C. W. Hu and K. C. Ho, Nanoscale Res. Lett., 2012, 7, 319 CrossRef CAS PubMed.
- H. Zhong, R. Yuan, Y. Chai, Y. Zhang, C. Wang and F. Jia, Microchim. Acta, 2012, 176, 389–395 CrossRef CAS.
- X. Niu, H. Zhao, C. Chen and M. Lan, Electrochim. Acta, 2012, 65, 97–103 CrossRef CAS PubMed.
- Y. Fang, D. Zhang, X. Qin, Z. Miao, S. Takahashi, J.-I. Anzai and Q. Chen, Electrochim. Acta, 2012, 70, 266–271 CrossRef CAS PubMed.
- J.-M. You, D. Kim and S. Jeon, Electrochim. Acta, 2012, 65, 288–293 CrossRef CAS PubMed.
- M. R. Guascito, D. Chirizzi, C. Malitesta, T. Siciliano and A. Tepore, Talanta, 2013, 115, 863–869 CrossRef CAS PubMed.
- H. Lu, S. Yu, Y. Fan, C. Yang and D. Xu, Colloids Surf., B, 2013, 101, 106–110 CrossRef CAS PubMed.
| This journal is © The Royal Society of Chemistry 2014 |

