Quantitative analysis of thiram based on SERS and PLSR combined with wavenumber selection
Weng
Shizhuang
ab,
Chen
Sheng
ab,
Li
Miao
*b,
Zeng
Xinhua
b,
Zheng
Shouguo
b,
Zhang
Jian
b,
Chen
Jin
c and
Chen
Lei
b
aUniversity of Science and Technology of China, Hefei, 230026, China
bHefei Institute of Intelligent Machine, Chinese Academy of Sciences, Hefei, 230031, China. E-mail: mli@iim.ac.cn
cSchool of Chemistry & Chemical Engineering, Anhui University, Hefei, 230601, China
First published on 25th November 2013
Abstract
Surfaced-enhanced Raman spectroscopy (SERS) is a novel analytical technology mainly for quick, simple and ultrasensitive analysis. In this study, SERS and partial least squares regression (PLSR) were used for the quantitative analysis of thiram combined with a wavenumber selection method based on the adaptive genetic algorithm (AGA). The conventional genetic algorithm (CGA) was also used for wavenumber selection and the effects of the two were contrasted. Moreover, the impact on individual analytical results was evaluated of different numbers of subintervals included in the wavenumber selection. We achieved the best results (root mean square error of cross-validation = 0.2957 μM, R = 0.9995) by PLSR using an AGA with 5-subintervals. The experiments indicated that the proposed AGA-based wavenumber selection was superior to the CGA and the effect of multi-subintervals on wavenumber selection was better than that of a single subinterval.
1 Introduction
Thiram, a nonsystemic dithiocarbamate fungicide, is widely used as a protectant on foliage and fruits to control a variety of fungal diseases, such as rust, scab, anthracnosis, botrytis, fusarium, monilia and so on.1 The residue of thiram is harmful to aquatic organisms, birds, and mammals.2 Thus, the quantitative and qualitative analysis of thiram in environmental materials is important. Although the conventional analytical methods such as ELISA, HPLC, LC-MS/MS are accurate, they are time consuming, laborious, costly and are not suitable for fast detection or analysis.3–5Surface-enhanced Raman spectroscopy (SERS) is a novel analytical method providing ultrasensitive, simple and rapid detection of organic chemicals.6 SERS overcomes the low sensitivity of traditional Raman spectroscopy by tremendous enhancement of scattering signals via absorption of analytes onto the rough surface of noble metals (gold, silver and so on). Besides, SERS technology has the excellent characteristics of high speed, low cost and its ability to record spectra of analytes without pretreatment. Therefore, SERS is suitable for fast and accurate analysis of thiram.
While of long standing fundamental importance, SERS as a quantitative analytical tool has only recently begun to be used.7–9 Chemometrics methods such as principal component regression (PCR), partial least squares regression (PLSR) and support vector machine regression (SVR) are generally employed to process data in quantitative analysis. Meanwhile, some studies have proved that proper wavelength or wavenumber selection can improve the results before using the chemometrics methods.10–13 In general, the methods used for wavenumber selection can be divided into manual and automated procedures. The manual methods are based on the selection of the spectra near characteristic peaks of the analytes; the automatic methods mainly depend on optimization algorithms. In comparison, the latter methods are carried out without human intervention, and are simple and easy to operate. It has been proved that the optimization algorithms such as the genetic algorithm (GA),14,15 simulated annealing (SA),16 and ant colony optimization (ACO)17 can effectively select appropriate wavenumber regions. Since the GA is simple and easy to realize, it was used for wavenumber selection in this research. In the method of GA-based wavenumber selection, a combination of spectral variables or subintervals is assigned to a chromosome. Through continuous crossover, mutation and selection, chromosomes of high fitness value are obtained with high predictive accuracy of the corresponding regression models. As the rate of mutation and crossover is fixed in CGA, the algorithm usually has the shortcomings of easily falling into local optimization and destruction of the excellent individuals.18 One possible way of avoiding this problem is the use of the adaptive genetic algorithm AGA so that the rate of mutation and crossover can be adjusted by the fitness value of the individuals. The corresponding crossover and mutation rates of the individuals with high fitness value are low in AGA, hence they can be saved and optimized further with the AGA. But for individuals with a low fitness value, it is highly probable that they are eliminated because of their high mutation rate. The selection unit of wavenumber selection can be divided into spectral variables and spectral subintervals.19 The resultant analysis results tend to be better in the latter for taking into account the high correlation of the spectral variables.
In this study, SERS and PLSR were used for the quantitative analysis of thiram combined with AGA-based wavenumber selection methods. Different GA-based wavenumber selection methods (AGA, CGA) were compared by 10-fold cross-validation on the basis of the correlation coefficient (Rp) and the root mean square error of cross-validation (RMSECV) of the corresponding regression models. Furthermore, the effects of the single subinterval and multi-subintervals on wavenumber selection were also assessed. The details are shown in below.
2 Materials and methods
2.1 Samples preparation
Ag nitrate, and trisodium citrate were purchased from Sinopharm Chemical Reagent Co., Ltd. (Shanghai, China). All the chemicals used were of analytical grade or better and were used without further purification. Preparation of Ag nanoparticles: silver nanoparticles were synthesized by adding 10 mL 10−2 mol L−1 Ag nitrate to 90 mL distilled water in a 250 mL three-necked flask.20 The solution was heated to boiling and then 3 mL 1% trisodium citrate solution was added followed by heating for 40 min. After cooling to room temperature, the solution was finally centrifuged to obtain a sol solution of the nanoparticles. The concentration of the thick Ag colloidal suspension was approximately 1 M. Commercial thiram was obtained from YuanDa (Beijing, China). It was dissolved in ethanol (99%, V/V) to obtain solutions of concentrations of 0.1, 0.5, 1, 5, 10, and 50 μM.2.2 SERS measurement
Silver nanoparticles were selected as SERS-active substrates because of their excellent performance in enhancing the signal intensity.21Ultrasonic dispersed Ag nanoparticles, were placed into a centrifuge tube. Then thiram solutions of different concentrations (the same volume) were added to the Ag sol, followed by mixing using ultrasonic dispersion for 10 min.22 Then, the mixed solution was dropped onto a silicon wafer which acted as the enhancing substrate. After evaporation of the solvent at room temperature the SERS spectra were recorded. The spectra were acquired using a LabRAM HR800 Raman spectrometer equipped with a 532 nm diode laser source. All the spectra were recorded with a 50× microscope objective and 200 mW laser power. For each original spectrum, 10 scans were performed at sampling points of 710 over the range of 400–1600 cm−1 with an integration time of 10 s. For each sample, 10 original spectra were recorded taking into account the location of the sampling points. And 100 spectra were collected with sampling once a week. A single original spectrum was not suitable for quantitative analysis because of the poor reproducibility of the SERS signal. To solve this problem, the mean of 30 spectra, randomly selected from 100 original spectra, was used for the analysis spectroscopy and 50 analysis spectra were acquired by cyclic operation 50 times. The baseline of each spectrum, which was caused by the fluorescence background, was approximated by a seventh-order polynomial fit and subtracted using NGSLabSpec software (Jobin Yvon).
2.3 Data analysis methods
| X = TPT + E, Y = TQT + F | (1) |
 | (2) |
 is the covariance of X. So far, the relationship between X and Y is derived.
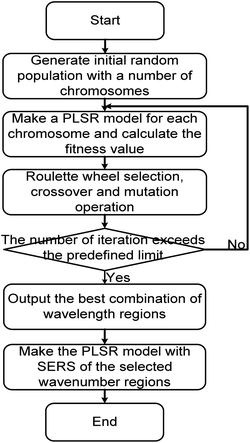
First, chromosomes are randomly generated to form the initial population. Then, to find the best combination of the wavenumber subintervals, the calculations for the fitness values, selection of chromosomes, crossover, and mutation are repeated until the number of iterations exceeds the predefined limit. In this study, one subinterval in a spectrum is represented by two integer values. The first value denotes the starting wavenumber of a subinterval, and the second value denotes the finishing wavenumber. If the range of the represented region exceeds the full spectral range or two regions overlap, the excess or redundant parts are ignored.
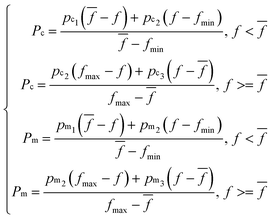
Two objectives are considered when designing the fitness function of chromosomes. One is to maximize Rp, and the other is to minimize RMSECV. So the fitness function was designed as: Rp/(1 + RMSECV). And the fitness values of chromosomes were calculated by PLSR using the SERS spectra of the selected wavenumber regions. Other operators were set as follows: the number of iterations was 500; the size of the population was 20. The number of subintervals in each chromosome was 1 (single subinterval) or 5 (multi-subintervals). The crossover rate was 0.6 and the mutation rate was 0. 1 in CGA; but for AGA, the crossover rate (Pc) and the mutation rate (Pm) were set as following:
 | (3) |
![[f with combining macron]](https://www.rsc.org/images/entities/i_char_0066_0304.gif) , fmin are the maximum fitness value, the average fitness value and the minimum fitness value of the individuals in each generation. And pc1 > pc2 > pc3, pm1 > pm2 > pm3 were assigned by the value of 0.0–1.0. The corresponding rate of crossover and mutation of the individuals with low fitness is high in eqn (3), the individuals can be washed out during the iteration. For the individuals with high fitness, the rate of crossover and mutation is small, and the individuals are inherited and further optimized. But in CGA, the fixed rate of crossover and mutation may cause the individuals with low fitness not to be washed out quickly; the individuals with high fitness are not more likely to be inherited, and the better individual is not conducive to being obtained.
, fmin are the maximum fitness value, the average fitness value and the minimum fitness value of the individuals in each generation. And pc1 > pc2 > pc3, pm1 > pm2 > pm3 were assigned by the value of 0.0–1.0. The corresponding rate of crossover and mutation of the individuals with low fitness is high in eqn (3), the individuals can be washed out during the iteration. For the individuals with high fitness, the rate of crossover and mutation is small, and the individuals are inherited and further optimized. But in CGA, the fixed rate of crossover and mutation may cause the individuals with low fitness not to be washed out quickly; the individuals with high fitness are not more likely to be inherited, and the better individual is not conducive to being obtained.
All the computation and chemometric methods were implemented in MATLAB 2011b (The Mathworks Inc., Natick, MA, USA). The PLSR or GA algorithms were carried out by ourselves.
3 Results and discussion
3.1 SER spectra of thiram
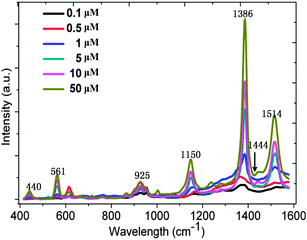
The SERS spectra recorded for thiram solutions of different concentrations (0.1, 0.5, 1, 5, 10, and 50 μM) are shown in Fig. 2. The peak at 1386 cm−1 is the strongest and is due to the CN stretching mode and symmetric CH3 deformation mode. The other peaks, such as the peak at 440 cm−1, which is due to the CH3NC deformation and C![[double bond, length as m-dash]](https://www.rsc.org/images/entities/char_e001.gif) S stretching modes, the peak at 561 cm−1, which is associated with the S
S stretching modes, the peak at 561 cm−1, which is associated with the S![[double bond, length as m-dash]](https://www.rsc.org/images/entities/char_e001.gif) S stretching mode, the peak at 925 cm−1, which is due to the stretching CH3N and C
S stretching mode, the peak at 925 cm−1, which is due to the stretching CH3N and C![[double bond, length as m-dash]](https://www.rsc.org/images/entities/char_e001.gif) S modes, are all clearly identifiable. From Fig. 2, we can also find that the CN stretching mode and rocking CH3 mode occurs at 1150 cm−1; the CN stretching mode occurs at 1444 cm−1 as well as the rocking CH3 mode.26 At the same time, the CN stretching mode and the deformation, rocking mode of CH3 can be observed at 1514 cm−1. All the intensities of these peaks are stronger while the concentrations are higher. The phenomenon partially indicates that quantitative analysis of SERS is possible.
S modes, are all clearly identifiable. From Fig. 2, we can also find that the CN stretching mode and rocking CH3 mode occurs at 1150 cm−1; the CN stretching mode occurs at 1444 cm−1 as well as the rocking CH3 mode.26 At the same time, the CN stretching mode and the deformation, rocking mode of CH3 can be observed at 1514 cm−1. All the intensities of these peaks are stronger while the concentrations are higher. The phenomenon partially indicates that quantitative analysis of SERS is possible.
Spectral wavenumber regions for the establishment of the regression model have a significant influence on the performance of the mode, and the conventional methods directly select the spectra near characteristic peaks. Although all characteristic information of the spectra is used to develop the model in these methods, introduction of some information has a negative effect on the results and the non-characteristic information rather than a positive effect. Thus, the optimization algorithms (CGA, AGA) were used to identify which few wavenumber regions to use in this study.
3.2 Quantitative analysis of thiram
| Data set | Method | RMSECV | R |
|---|---|---|---|
| a Without wavenumber selection algorithms. | |||
| SER spectra of 400–1600 cm−1 | 0.4666 | 0.9934 | |
| CGA1 | 0.4597 | 0.9953 | |
| AGA1 | 0.3908 | 0.9977 | |
| CGA5 | 0.3642 | 0.9986 | |
| AGA5 | 0.2957 | 0.9995 | |
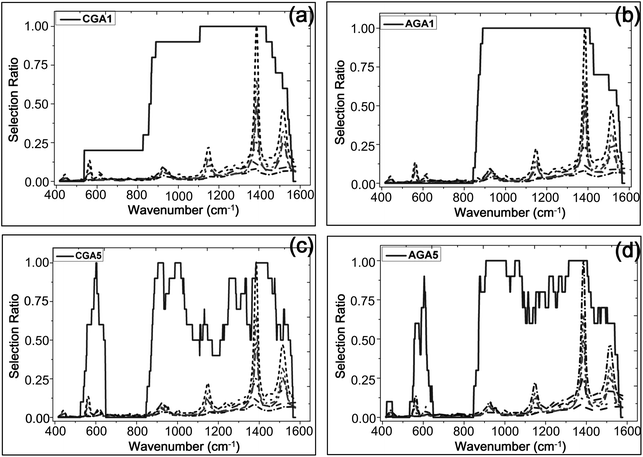
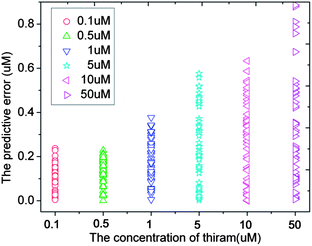
Fig. 4 shows the PCA plot of the PLSR scores of the spectra selected by AGA5/CGA5. It is found that the PLSR scores of the samples of the same concentration are more centred in AGA5, which means that the deviation between the samples of the same class is reduced. Thus the performance of the corresponding model is improved. The predictive error of the model which was built with the selected spectral wavenumbers in AGA5 is shown as Fig. 5. The analysis results are generally accurate, but the relative deviation for the low-concentration solution (0.1 μM) is too big to appear to be a mistake.
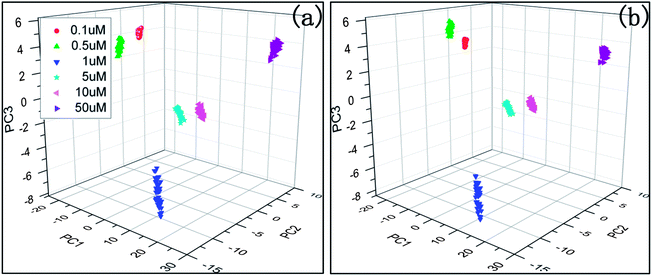 | ||
| Fig. 4 PCA scores plot of PLSR latent variables of the thiram spectra selected by CGA5/AGA5; (a) CGA5, (b) AGA5. | ||
3.3 Reliability of SERS for quantitative analysis
SERS is widely used as a rapid and accurate technology for both qualitative and quantitative analyses of trace amounts of contaminants. When SERS are measured, they can be affected by laser frequency, the surface of the substrate and the molecular structures of the analytes.6 So it is very challenging to apply SERS for quantitative analysis because of the difficulty in obtaining reproducible spectra. To avoid the problem, the experimental conditions and the preparation of SERS-active substrates were strictly controlled, and each analysis spectrum was the mean of 30 original spectra. Through such processing, the SERS deviation of samples of the same concentration became small and were available for quantitative analysis. In future, we believe SERS for quantitative analyses will certainly be used in more and more research fields with the aid of the rapid development of microscopy Raman spectrometers and substrates.4 Conclusions
Firstly, the experiments prove that the SERS spectra of thiram which are acquired under controlled experimental conditions and statistical methods are available for quantitative analysis. Then it is known that the wavenumber selection prior to the analysis is necessary by contrasting the performance of the corresponding models. The CGA/AGA–based wavenumber selection methods were used to select spectral wavenumbers in this study. As the local optimum can be effectively avoided and the excellent individuals can easily be saved and optimized further in AGA, the effect of wavenumber selection is better. Additionally, the influence of methods with different subintervals on the wavenumber selection was also evaluated. And the methods with 5-subintervals were found to be more suitable in this aspect because of their flexibility. The best analysis results were obtained using the model based on PLSR combined with AGA5 (RMSECV = 0.2957 uM, R = 0.9995). Finally, we hope that the results obtained by us will help further chemometric investigations (wavenumber selection) and investigations in the sphere of vibrational spectroscopy (Near infrared, Mid-infrared and Raman) of multi-component systems.Acknowledgements
This study was supported by the National High Technology Research and Development Program of China (no. SS2013AA100302).References
- S. Walia, R. K. Sharma and B. S. Parmar, Bull. Environ. Contam. Toxicol., 2009, 83, 363–368 CrossRef CAS PubMed.
- C. Cereser, S. Boget, P. Parvaz and A. Revol, Toxicology, 2001, 162, 89–101 CrossRef CAS.
- L. Queffelec, F. Boisde, J. P. Larue, J. P. Haelters, B. Corbel, D. Thouvenot and P. Nodet, J. Agric. Food Chem., 2001, 49, 1675–1680 CrossRef PubMed.
- C. Fernández, A. J. Reviejo, L. M. Polo and J. M. Pingarrbn, Talanta, 1996, 43, 1341–1348 CrossRef.
- S. B. Ekroth, B. Ohlin and B. G. Osterdahl, J. Agric. Food Chem., 1998, 46, 5302–5304 CrossRef CAS.
- F. Zhai, Y. Huang, C. Li, X. Wang and K. Lai, J. Agric. Food Chem., 2011, 59, 10023–10027 CrossRef CAS PubMed.
- W. E. Smith, K. Faulds and D. Graham, Top. Appl. Phys., 103, 381–396 CrossRef CAS.
- C. L. Haynes, C. R. Yonzon, X. Zhang and R. P. V. Duyne, J. Raman Spectrosc., 2005, 36, 471–484 CrossRef CAS.
- S. C. Pinzaru, I. Pavel, N. Leopold and W. Kiefer, J. Raman Spectrosc., 2004, 35, 338–346 CrossRef CAS.
- C. H. Spiegelman, M. J. Mcshane, M. J. Goetz, M. Motamedi, Q. L. Yue and G. L. Cote, Anal. Chem., 1998, 70, 35–44 CrossRef CAS PubMed.
- B. Nadler and R. R. Coifman, J. Chemom., 2005, 19, 107–118 CrossRef CAS.
- W. Fan, H. Li, Y. Shan, H. Lv, H. Zhang and Y. Liang, Anal. Methods, 2011, 3, 1872–1876 RSC.
- G. Nasser and D. Shahsavani, Anal. Methods, 2012, 4, 3733–3738 RSC.
- R. Leardi and L. Nørgaard, J. Chemom., 2004, 18, 486–497 CrossRef CAS.
- X. Zou, J. Zhao, X. Huang and Y. Li, Chemom. Intell. Lab. Syst., 2007, 87, 43–51 CrossRef CAS PubMed.
- U. Hörchner and J. H. Kalivas, Anal. Chim. Acta, 1995, 311, 1–13 CrossRef.
- M. Shamsipur, V. Zare-Shahabadi, B. Hemmateenejad and M. Akhond, J. Chemom., 2006, 20, 146–157 CrossRef CAS.
- R. Balamurugan, C. V. Ramakrishnan and N. Singh, Appl. Soft Comput., 2008, 8, 1607–1624 CrossRef PubMed.
- M. Arakawa, Y. Yamashita and K. Funatsu, J. Chemom., 2011, 25, 10–19 CrossRef CAS.
- P. Li, X. Zhou, H. Liu, L. Yang and J. Liu, J. Raman Spectrosc., 2013, 44, 999–1003 CrossRef CAS.
- A. Michota and J. Bukowska, J. Raman Spectrosc., 2003, 34, 21–25 CrossRef CAS.
- K. Qian, L. Yang, Z. Li and J. Liu, J. Raman Spectrosc., 2013, 44, 21–28 CrossRef CAS.
- K. C. Weber, K. M. Honório, A. T. Bruni, A. D. Andricopulo and A. B. da Silva, Struct. Chem., 2006, 17, 307–313 CrossRef CAS.
- T. Mehmood, K. H. Liland, L. Snipen and S. Sæbø, Chemom. Intell. Lab. Syst., 2012, 118, 62–69 CrossRef CAS PubMed.
- W. Patrick, R. Pell and E. Comas, Chemom. Intell. Lab. Syst., 2009, 98, 108–114 CrossRef PubMed.
- B. Saute and R. Narayanan, Analyst, 2011, 136, 527–532 RSC.
| This journal is © The Royal Society of Chemistry 2014 |

