DOI:
10.1039/C3AY41279B
(Paper)
Anal. Methods, 2014,
6, 170-177
Optimisation of the solvent extraction of bioactive compounds from Lophatherum gracile Brongn. using response surface methodology and HPLC-PAD coupled with pre-column antioxidant assay
Received
30th July 2013
, Accepted 9th October 2013
First published on 9th October 2013
Abstract
Lophatheri Herba was demonstrated to be rich in flavonoid glycosides, therefore, it is of great importance to explore the high-value utilization. In this regard, these constituents own significant antioxidant capacities to protect the human body from the aforementioned health problems. The aim of the article was to optimize and screen the main antioxidative components in ethanol extraction of Lophatheri Herba. Response surface methodology (RSM) was used for the enhanced recovery of total flavonoid content (TFC), combined with two in vitro methodologies of measuring antioxidant activities, 2,2-di-phenyl-1-picrylhydrazyl (DPPH) free radical-scavenging activity and 2,2′-azinobis (3-ethylbenzothiazoline-6-sulfonic acid) diammonium salt (ABTS) free radical-scavenging activity, and HPLC-PAD coupled with pre-column DPPH assay. Plackett–Burman design and Box-Behnken design (BBD) were employed to optimize the ethanol concentration (x1: 50%), powder particle size (x2: 80–100 mesh) and extraction times (x3: 3 times), obtaining ethanol extracts from Lophatheri Herba with high total flavonoid contents and high antioxidants. Based on the reduced or disappeared HPLC chromatogram peaks of the mixture extracts compared to the original ones, sixteen possessing potential antioxidant active compounds were deduced as flavonoids, five of them were identified as isoorientin, orientin, swertiajaponin, vitexin and luteolin-7-O-β-D-glu, respectively. The combined method could optimize the extraction process of the bioactive compounds. It is a high-throughput methodology to identify the natural antioxidants in complex mixtures.
1. Introduction
Increasing public attention has been paid to search for antioxidants in natural plants. The results of a lot of research indicate that oxidative stress may enhance pathological processes of many chronic health problems such as angiocardiopathy, metabolic disease, respiratory disease, neurodegenerative disease, urinary system diseases, digestive diseases, tumors, cancer and aging senescence.1 Reactive derived free radicals, such as superoxide anion, hydroxyl radical and peroxy radical2 may cause injury of biomembrane, protein denaturation, damage of the nucleic acid structure, the attack of mercapto amino acids, the injury of mitochondria and the destruction of cell function structure, lipid peroxidation, the influence of the signal transduction and gene expression.3,4 Dietary antioxidants could counteract these deleterious processes effectively. Many natural antioxidants have been identified from bamboo leaves,5 ginkgo biloba leaves,6 teas,7 and so on. Lophatheri Herba is also a good and readily available source of natural antioxidants,8 which has attracted some attention both as food and medicine.
Flavonoids are omnipresent bioactive compounds belonging to secondary metabolites and are ubiquitous in higher plants. In this regard, these constituents own significant antioxidant capacities to protect the human body from the aforementioned health problems.9
Lophatheri Herba is the stem and leaf of Lophatherum gracile Brongn. belonging to the family Gramineae. Lophatheri Herba has been demonstrated to be rich in antioxidants and other potential health promoting compounds,10–12 such as phenolic acids, flavonoid glycosides, terpenoid, polyose and so on. Therefore, it is of great importance to explore the high-value utilization of Lophatheri Herba, however, limited information has been reported about systematic quality evaluation of the herb.
Despite this there are many methods in the extraction of antioxidants from Chinese medicinal herbs, the method used currently is cumbersome, time-consuming, and less efficient for screening antioxidants from the herb, thus could not be used in a processing plant scale. Furthermore, during the extraction, isolation and purification processes, the activities of some natural antioxidants are often decreased or changed because of their decomposition.
The aim of the article is to optimize and screen the main antioxidative components in ethanol extraction of Lophatheri Herba. Response surface methodology was used for the enhanced recovery of total flavonoid content (TFC), combined with two in vitro methodologies of measuring antioxidant activities, 2,2-di-phenyl-1-picrylhydrazyl (DPPH) free radical-scavenging activity and 2,2′-azinobis (3-ethylbenzothiazoline-6-sulfonic acid) diammonium salt (ABTS) free radical-scavenging activity, and HPLC-PAD coupled with pre-column DPPH assay.
2. Materials and methods
2.1 Materials
One batch of 10 kg of Lophatherum gracile Brongn. which was purchased from a medicine purchasing station in Shaoyang (Hunan province, China), has been identified by Professor Qi-nan Wu (School of Pharmacy, Nanjing University of Chinese Medicine, Nanjing, China).
DPPH and ABTS were purchased from Sigma-Aldrich (St. Louis, MO, USA). All chemicals (analytical grade) used in the experiment were purchased from Shanghai Chemical Co. (Shanghai, China). The water used was purified by an ultra-pure water purification system (Nanjing EPED Co., Ltd., China).
An ultrasonic device (KH300SP, Kunshan Ultrasonic Instrument Co. Jiangsu, China) was used for ultrasonic extraction, a PowerWave X 340 microplatereader (Bio-Tekinstruments, Ins. Co., USA) and a 2501 UV-Vis spectrometer (Shimadzu, Kyoto, Japan) was used for measuring the absorbance of samples.
2.2 Preparation of Lophatheri Herba extracts
2.2.1 Screening of important impact factors using Plackett–Burman design.
The extract methods were screened for seven variables at two levels, maximum and minimum using Plackett–Burman design for 12 runs and 7 two-level factors to identify significant impact factors.13 The design and levels of each variable are shown in Table 1. Ethanol concentration, temperature, time, solid–liquid ratio, extraction times and powder particle size as factors all have two levels. “−1” represents a low level and “1” represents a high level, like 50% and 90% were the two different concentration levels of the ethanol, and so on. As the factor G ∼ L were vacancies, they were virtual items.
Table 1 Coding level and results of Plackett–Burman design by ultrasonic extraction
| Std Order |
Factor levels |
Response |
|
A-Ethanol concentration (%) |
B-Temperature (°C) |
C-Time (min) |
D-Solid–liquid ratio |
E-Extraction times (times) |
F-Powder particle size (mesh size) |
G ∼ L-Virtual items |
TFC (mg g−1) |
| 1 |
1 (90%) |
1 (40 °C) |
−1 (30 min) |
1 (1![[thin space (1/6-em)]](https://www.rsc.org/images/entities/char_2009.gif) :30, w/v) :30, w/v) |
1 (2) |
1 (80) |
−1 |
10.6140 |
| 2 |
−1 |
1 |
1 |
−1 |
1 |
1 |
1 |
11.1036 |
| 3 |
1 |
−1 |
1 |
1 |
−1 |
1 |
1 |
7.3285 |
| 4 |
−1 |
1 |
−1 |
1 |
1 |
−1 (60) |
1 |
8.6623 |
| 5 |
−1 (50%) |
−1 (30 °C) |
1 (60 min) |
−1 (1:20, w/v) |
1 |
1 |
−1 |
11.8098 |
| 6 |
−1 |
−1 |
−1 |
1 |
−1 |
1 |
1 |
9.2505 |
| 7 |
1 |
−1 |
−1 |
−1 |
1 |
−1 |
1 |
3.3358 |
| 8 |
1 |
1 |
−1 |
−1 |
−1 |
1 |
−1 |
7.2197 |
| 9 |
1 |
1 |
1 |
−1 |
−1 (1) |
−1 |
1 |
4.2118 |
| 10 |
−1 |
1 |
1 |
1 |
−1 |
−1 |
−1 |
7.3580 |
| 11 |
1 |
−1 |
1 |
1 |
1 |
−1 |
−1 |
4.5902 |
| 12 |
−1 |
−1 |
−1 |
−1 |
−1 |
−1 |
−1 |
5.3365 |
The extraction temperature was maintained at the desired value by circulating external water from a thermostatic water bath into the cleaner. The sample centrifugal tubes were immersed into the ultrasonic cleaner for irradiation under different extraction conditions, with ultrasonic frequency of 25 kHz and ultrasonic power of 300 W. All samples were prepared and analyzed in triplicate.
2.2.2 Single factor experiment.
The ultrasonic cleaner used as an ultrasound source was a rectangular container, with 25 and 40 kHz transducers annealed at the bottom. The cleaner power rating was 300 W on the scale of 50% to 100%. Based on the significant factors identified by Plackett–Burman design, ultrasonic frequency, ultrasonic power, particle size and ethanol concentration were detected, respectively, in order to define the extraction parameters, range and center point value.
2.3 Determination of total flavonoid content (TFC)
The determination of total flavonoid was performed according to the colorimetric assay.14,15 Six millilitres of distilled water were added to 0.5 ml of the extract. 5% (w/v) sodium nitrite solution (1.0 ml) and 10% (w/v) aluminium chloride solution (1.0 ml) were added into the volumetric flasks incubated at room temperature for 6 min respectively. Then 10 ml of 1 M NaOH was added to each mixture. The volume of reaction mixture was made up to 25 ml with distilled water. The mixture was thoroughly vortexed, after reaction at ambient temperature for 15 min; the absorbance was measured at 510 nm.
2.4 Antioxidant activities determination
2.4.1 DPPH assay.
The 2,2-diphenyl-1-picrylhydrazyl (DPPH) free radical-scavenging activity of the extracts (pre-diluted at a ratio of 1:6) was determined.16 Aliquots of each extract (0.1 ml) were added to 3 ml of ethanolic DPPH solutions (0.1 mM). Samples were measured at 517 nm after incubation for 45 min at room temperature in the dark. The %DPPH which was scavenged (%DPPHsc) was calculated using the formula:| | | %DPPHsc = (Acont − Asample) × 100/Acont | (1) |
where Acont was defined as absorbance of the control, meanwhile Asample was defined as absorbance of the sample.
2.4.2 ABTS assay.
2,2′-Azinobis(3-ethylbenzothiazoline-6-sulfonic acid)diammonium salt (ABTS) assay was carried out.17 The ABTS radical action (ABTS˙+) solution was prepared by mixing 7 mM ABTS and 2.45 mM potassium persulfate and incubated in the dark at room temperature for 16 h. The ABTS˙+ solution was then diluted with PBS solution (pH 7.4) to obtain an absorbance of 0.700 ± 0.005 at 734 nm. ABTS˙+ solution (3.9 ml) was added to 0.1 ml of the test sample (pre-diluted at a ratio of 1:40) and mixed vigorously. The reaction mixture was allowed to stand at room temperature for 30 min and the absorbance at 734 nm was immediately recorded. The %ABTS which was scavenged (%ABTSsc) was calculated using the formula:| | | %ABTSsc = (Acont − Asample) × 100/Acont | (2) |
where Acont was defined as absorbance of the control, meanwhile Asample was defined as absorbance of the sample.
2.5 Experimental design
The extraction parameters were optimised using response surface methodology. A Box-Behnken design (BBD) was employed in the regard.18 Ethanol concentration (x1), powder particle size (x2), and extraction times (x3) were chosen for independent variables. The range and center point values of three independent variables presented in Table 3a were based on the results of preliminary experiments. TFC, %DPPHsc and %ABTSsc were selected as the responses for the combination of the independent variables given in Table 3b. According to this design, there were 17 runs, while numeric factor was 3. The mean values of three experiments of each experimental design point were stated as observed responses. Experimental runs were randomised, to minimise the effects of unexpected variability in the observed responses. Multiple linear regression was performed based on the results of Table 3b using the following quadratic polynomial model eqn (3).| | 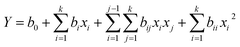 | (3) |
where Y is the predicted response, b0 is the model constant, bi, bii and bij are the linear, quadratic and interactive coefficients of the model, xi and xj are the levels of the independent variables, respectively. Analysis of the experimental design data and calculation of predicted responses were carried out using Design Expert software (Version 8.0.5b, Stat-Ease, Inc., Minneapolis, MN). In Table 3b, “−1” represents a low level, “0” represents a middle level and “1” represents a high level. Y1 meant the observed responses, and Y0 meant the predicted values.
2.6 Statistical analysis
The one-way ANOVA test was used to calculate the significance of the differences of TFC, %DPPHsc and %ABTSsc. The significant differences among treatments were determined at p-values < 0.05 levels using Duncan's multiple range tests.
2.7 Chromatographic condition
2.7.1 HPLC condition.
The HPLC system Waters 2695 series was equipped with a Waters 2996 series PAD detector and Empower chromatographic workstation software (Waters Co., USA). All separations were carried out on an Elite SinoChrom BP C18 column (4.6 mm × 250 mm, 5 μm) from Dalian Elite Co., Ltd. (China). A linear gradient elution of acetonitrile (A) and 1.0% acetic acid aqueous solution (v/v, B) was used as the mobile phase, using a gradient program of 8.0–8.0% A in 0–5 min, 8.0–11.8% A in 5–30 min, 11.8–12.2% A in 30–55 min, 12.2–18.0% A in 55–80 min, held for 5 min, 18.0–20.0% A in 85–95 min, and 20.0–30.0% A in 95–105 min, then linear gradient to 8.0% A in 5 min. It was followed by a 5 min equilibrium period prior to the injection of the next sample. The solvent flow rate was 1.0 ml min−1 and the injection volume was 25 μl. The chromatograms were recorded at 311 nm. The column temperature was maintained at 30 °C. All samples were filtered through a 0.45 μm filter before analysis.
2.7.2 HPLC-PAD coupled with pre-column DPPH.
The extract with the best antioxidative activity was further screened by HPLC-PAD coupled with a pre-column DPPH assay.19–21 0.5 ml sample and 2 ml DPPH (0.1 mM) solution mixed to react for 30 min. The reaction mixtures and the original sample diluted five times were analyzed by HPLC-PAD under the same chromatographic conditions. Subsequently, comparing the chromatograms, some peaks decreasing or disappearing in height in the chromatograms of the mixture could be considered as the antioxidant peaks. The antioxidant peaks were identified by the standard substance and the UV wavelength absorption figures.
3. Results and discussion
3.1 Optimization of independent variables
3.1.1 Optimization of variables using Plackett–Burman design.
Plackett–Burman design was constructed to determine the impact factors for total flavonoid content. The influence of seven factors namely ethanol concentration, temperature, time, solid–liquid ratio, extraction times, powder particle size was investigated in 12 runs represented in Table 1, and the corresponding response for TFC varied from 3.34 to 11.81%. Table 2a illustrates the order of significance of the variables influencing TFC. Among the variables screened, the significant influencing factors in the order of powder particle size, ethanol concentration, extraction times and temperature were identified and selected for further optimization. In Table 2a, Lenth's ME meant a single factor confidence limit of about 95%, and Lenth's SME meant a simultaneous confidence limit. Lenth22 suggested that a factor the absolute value larger than SME was active, smaller than ME was inactive, and the one between SME and ME should be further discussed. Based on the results in Table 2a, powder particle size needs further research. Statistical analysis in Table 2b demonstrates that the model F value of 24.97 and p value of 0.0003 < 0.05 were significant. Regression analysis was performed on the results and first order polynomial equation was derived representing TFC as a function of the independent variables. The value of the factors indicated the level of significance of the variable on TFC of Lophatheri Herba.| | | TFC = 7.57 − 1.35A + 0.63B + 0.78E + 1.99F | (4) |
Table 2 (a) Significant differences of partial regression coefficient and influence factor. (b) Variance analysis of regression model
| (a) |
| Term |
Effect |
Sum of squares |
Contribution (%) |
Importance order |
|
Intercept
|
|
A-ethanol concentration |
−2.703 |
21.926 |
25.189 |
2 |
|
B-temperature |
1.253 |
4.710 |
5.411 |
4 |
|
C-time |
0.331 |
0.328 |
0.376 |
9 |
|
D-solid–liquid ratio |
0.798 |
1.909 |
2.193 |
6 |
|
E-extraction times |
1.568 |
7.380 |
8.479 |
3 |
|
F-powder particle size |
3.972 |
47.328 |
54.372 |
1 |
|
G-G
|
−0.506 |
0.768 |
0.882 |
7 |
|
H-H
|
0.101 |
0.031 |
0.035 |
11 |
|
J-J
|
0.111 |
0.037 |
0.043 |
10 |
|
K-K
|
0.390 |
0.456 |
0.524 |
8 |
|
L-L
|
−0.851 |
2.172 |
2.495 |
5 |
| Lenth's ME |
2.815 |
|
|
|
| Lenth's SME |
6.029 |
|
|
|
| (b) |
| Source |
Sum of squares |
Degree of freedom |
Mean square |
F-value |
p-Value |
|
|
TFC
|
| Model |
81.3443 |
4 |
20.3361 |
24.9730 |
0.0003 |
Significant |
|
A
|
21.9260 |
1 |
21.9260 |
26.9255 |
0.0013 |
|
B
|
4.7103 |
1 |
4.7103 |
5.7843 |
0.0471 |
|
E
|
7.3802 |
1 |
7.3802 |
9.0630 |
0.0196 |
|
F
|
47.3277 |
1 |
47.3277 |
58.1192 |
0.0001 |
| Residual |
5.7002 |
7 |
0.8143 |
|
|
| Cor total |
87.0446 |
11 |
|
|
|
Hence, statistically significant variables were further researched to find the optimal range of these variables.
3.1.2 Effect of ultrasonic frequency.
Sample of 2 g was extracted with 40 ml of 50% ethanol at 25 and 40 kHz. Other conditions were: ultrasonic power at 300 W, temperatures at 30 °C, solvent to solid ratio of 20 ml g−1, extraction time of 30 min and particle size of 80–100 mesh. The results (Fig. 1a) show that 25 kHz gave higher extraction yields than 40 kHz. Hence, 25 kHz was chosen as the ultrasonic frequency.
 |
| | Fig. 1 The effect of ultrasonic frequency (a), ultrasonic power (b), particle size (c), ethanol concentration (d) on the yields of TFC from Lophatheri Herba extracts. | |
3.1.3 Effect of ultrasonic power.
The effect of ultrasonic power was explored with six different ultrasonic powers of 150, 180, 210, 240, 270 and 300 W, respectively. Other conditions were fixed as mentioned previously, sample of 2 g, temperature at 30 °C, 50% ethanol at solvent to solid ratio of 20 ml g−1, extraction time of 30 min and particle size of 80–100 mesh, ultrasonic frequency of 25 kHz. The results shown in Fig. 1b clearly indicate that the extraction yields of the total flavonoid was increased when the ultrasonic power was increased from 150 to 180 W, but there is no significant differences while the power was increased from 180 to 270 W. The highest extraction yields of the total flavonoid were not detected until the power was increased to 300 W. Thus, an ultrasonic power of 300 W should be optimum to extraction power.
3.1.4 Effect of particle size.
Particle size was one of the most important parameters in the extraction process. An amount of 0.5 g sample was extracted at the conditions of 10 ml of 50% ethanol, 30 °C, 25 kHz, 300 W and 30 min at different particle sizes of 30–60, 60–80, 80–100, 100–120 and 120–200 mesh, respectively. As shown in Fig. 1c, the extraction yields of the total flavonoid were increased to a higher peak at 60–80 mesh, then declined at 80–100 mesh, but increased again at particle size from 100 to 120 and 120 to 200 mesh. The results indicate that the particle size of powder had both positive and negative influences on the extraction yield.23,24 Considering the results, the optimum particle size was set at 60–80 mesh.
3.1.5 Effect of ethanol concentration.
Four different solvent concentrations of 30%, 50%, 70% and 90% ethanol have been used for extracting, while particle size of 60–80 mesh, solvent to solid ratio of 20 ml g−1, extraction time of 30 min at 30 °C, ultrasonic frequency of 25 kHz and ultrasonic power of 300 W. Data shown in Fig. 1d indicate an obvious decline of the extraction yields of total flavonoids when the ethanol concentration was increased from 50% to 90%. Hence, 50% ethanol was chosen as the center solvent in the following extraction experiments.
3.2 Model fitting
Based on the results of Table 3b, Table 4 shows the results of fitting quadratic models to the data. The results of analysis of variance (ANOVA) indicate that the contribution of the quadratic model was significant. The significance of each coefficient was determined using the F-test and p-value, the greater absolute F-value and the p-value, the more significant the corresponding variables. The fitted quadratic models for TFC, %DPPHsc and %ABTSsc in coded variables are given in eqn (5)–(7), respectively. Otherwise, lack of fit was also shown to check the quality of the fitted models in Table 4.| | | TFC = 10.72 − 0.056x1 + 1.71x2 + 1.78x3 − 0.20x1x2 + 0.010x1x3 + 0.16x2x3 − 0.51x12 − 1.33x22 − 0.84x32 | (5) |
| | | %DPPHsc = 56.40 + 1.71x1 + 9.39x2 + 7.16x3 + 1.03x1x2 − 1.68x1x3 + 1.14x2x3 − 1.83x12 − 4.04x22 − 2.44x32 | (6) |
| | | %ABTSsc = 59.36 − 3.80x1 + 7.71x2 + 10.38x3 − 2.91x1x2 + 0.00x1x3 + 1.17x2x3 − 2.32x12 − 4.85x22 − 4.21x32 | (7) |
Table 3 (a) Experimental domain of Box-Behnken design (BBD). (b) BBD with the observed responses and predicted values for TFC, %DPPHsc and %ABTSsc
| (a) |
|
x
i
|
Factor levels |
| −1 |
0 |
1 |
| Ethanol concentration (%) |
30 |
50 |
70 |
| Powder particle size (mesh size) |
30–60 |
60–80 |
80–100 |
| Extraction times (times) |
1 |
2 |
3 |
| (b) |
| Std Order |
Coded variable levels |
Observed (Y1) |
Predicted (Y0) |
|
x
1
|
x
2
|
x
3
|
TFC (mg g−1) |
%DPPHsc (%) |
%ABTSsc (%) |
TFC (mg g−1) |
%DPPHsc (%) |
%ABTSsc (%) |
| 1 |
−1 |
−1 |
0 |
7.19 |
38.87 |
44.35 |
7.03 |
40.45 |
45.37 |
| 2 |
1 |
−1 |
0 |
7.16 |
42.76 |
43.39 |
7.32 |
41.83 |
43.58 |
| 3 |
−1 |
1 |
0 |
11.01 |
56.25 |
66.80 |
10.86 |
57.18 |
66.61 |
| 4 |
1 |
1 |
0 |
10.20 |
64.25 |
54.22 |
10.35 |
62.67 |
53.19 |
| 5 |
−1 |
0 |
−1 |
7.55 |
42.76 |
47.53 |
7.66 |
41.58 |
46.25 |
| 6 |
1 |
0 |
−1 |
7.73 |
47.03 |
39.09 |
7.53 |
48.36 |
38.64 |
| 7 |
−1 |
0 |
1 |
11.00 |
60.59 |
66.56 |
11.20 |
59.26 |
67.01 |
| 8 |
1 |
0 |
1 |
11.22 |
58.16 |
58.12 |
11.11 |
59.34 |
59.40 |
| 9 |
0 |
−1 |
−1 |
5.18 |
34.91 |
33.12 |
5.22 |
34.51 |
33.38 |
| 10 |
0 |
1 |
−1 |
8.28 |
50.76 |
44.98 |
8.33 |
51.01 |
46.46 |
| 11 |
0 |
−1 |
1 |
8.51 |
46.80 |
53.26 |
8.47 |
46.55 |
51.79 |
| 12 |
0 |
1 |
1 |
12.26 |
67.23 |
69.82 |
12.21 |
67.63 |
69.57 |
| 13 |
0 |
0 |
0 |
10.44 |
59.15 |
57.64 |
10.72 |
56.40 |
59.36 |
| 14 |
0 |
0 |
0 |
10.76 |
59.15 |
59.24 |
10.72 |
56.40 |
59.36 |
| 15 |
0 |
0 |
0 |
11.00 |
58.23 |
57.01 |
10.72 |
56.40 |
59.36 |
| 16 |
0 |
0 |
0 |
10.60 |
52.44 |
60.99 |
10.72 |
56.40 |
59.36 |
| 17 |
0 |
0 |
0 |
10.80 |
53.05 |
61.94 |
10.72 |
56.40 |
59.36 |
Table 4 ANOVA for response surface quadratic model: estimated regression model of relationship between response variables and independent variables (x1, x2, x3)
| Source |
Sum of squares |
Degree of freedom |
Mean square |
F-value |
p-value |
|
The coefficient of determination (r2) of the model was 0.9938.
The coefficient of determination (r2) of the model was 0.9560.
The coefficient of determination (r2) of the model was 0.9838.
|
|
TFC
(mg g
−1
)
|
| Model |
61.7827 |
9 |
6.8647 |
123.8539 |
<0.0001 |
|
x
2
|
23.5048 |
1 |
23.5048 |
424.0749 |
<0.0001 |
|
x
3
|
25.4149 |
1 |
25.4149 |
458.5365 |
<0.0001 |
|
x
1
2
|
1.0923 |
1 |
1.0923 |
19.7073 |
0.0030 |
|
x
2
2
|
7.4064 |
1 |
7.4064 |
133.6271 |
<0.0001 |
|
x
3
2
|
2.9718 |
1 |
2.9718 |
53.6176 |
0.0002 |
| Residual |
0.3880 |
7 |
0.0554 |
|
|
| Lack of fit |
0.2088 |
3 |
0.0696 |
1.5544 |
0.3316 |
| Cor total |
62.1707 |
16 |
|
|
|
| |
|
%DPPH
sc
(%)
|
| Model |
1279.5759 |
9 |
142.1751 |
16.8972 |
0.0006 |
|
x
2
|
705.9861 |
1 |
705.9861 |
83.9051 |
<0.0001 |
|
x
3
|
410.6559 |
1 |
410.6559 |
48.8056 |
0.0002 |
|
x
2
2
|
68.7101 |
1 |
68.7101 |
8.1661 |
0.0244 |
| Residual |
58.8987 |
7 |
8.4141 |
|
|
| Lack of fit |
13.5388 |
3 |
4.5129 |
0.3980 |
0.7625 |
| Cor total |
1338.4746 |
16 |
|
|
|
| |
|
%ABTS
sc
(%)
|
| Model |
1710.0629 |
9 |
190.0070 |
47.2254 |
<0.0001 |
|
x
1
|
115.6265 |
1 |
115.6265 |
28.7384 |
0.0011 |
|
x
2
|
475.9202 |
1 |
475.9202 |
118.2878 |
<0.0001 |
|
x
3
|
861.9842 |
1 |
861.9843 |
214.2423 |
<0.0001 |
|
x
1
x
2
|
33.7805 |
1 |
33.7805 |
8.3960 |
0.0231 |
|
x
1
2
|
22.7185 |
1 |
22.7185 |
5.6466 |
0.0492 |
|
x
2
2
|
99.071373 |
1 |
99.0714 |
24.6237 |
0.0016 |
|
x
3
2
|
74.7616 |
1 |
74.7616 |
18.5817 |
0.0035 |
| Residual |
28.1639 |
7 |
4.0234 |
|
|
| Lack of fit |
10.3437 |
3 |
3.4479 |
0.7739 |
0.5662 |
| Cor total |
1738.2268 |
16 |
|
|
|
3.2.1 TFC.
The linear terms of powder particle size (x2) and extraction times (x3) showed the much larger effect (p < 0.05) than the others on TFC (Table 4), followed by the quadratic term of powder particle size (x22), extraction times (x32) and ethanol concentration (x12). The linear terms of ethanol concentration (x1) and all other interaction terms of x1x2, x1x3 and x2x3 were not significant (p > 0.05). The coefficient of determination (r2) of the predicted models in this response was 0.9938 and p-value for lack of fit was 0.3316. These values would give a relatively good fit to the mathematical model in eqn (5).
3.2.2 Antioxidant activities (%DPPHsc and %ABTSsc).
In the case of antioxidant activities, it can be seen that the variable with the significant effect on extraction yield was the linear terms of powder particle size (x2) and the linear terms of extraction times (x3), followed by the linear terms of ethanol concentration (x1), the quadratic term of ethanol concentration (x12), powder particle size (x22), extraction times (x32) and the interaction terms of x1x2 (p < 0.05), whereas other terms were not significant (p > 0.05). The coefficient of determination (r2) of the predicted models in %DPPHsc and %ABTSsc were 0.9560 and 0.9838, respectively, whereas p-values for lack of fit were 0.7625 and 0.5662. The predicted models can reasonably represent the observed values. Hence, the responses were sufficiently explained by the models.
3.3 Interpretation of response surface models
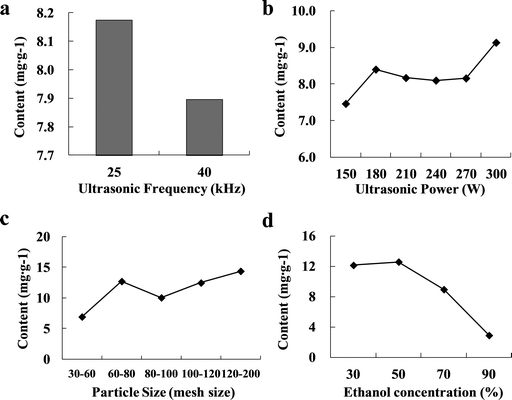
The 3D response surfaces of TFC, %DPPHsc and %ABTSsc as a function of powder particle size and extraction times are given in Fig. 2. As the results show in Table 4, ethanol concentration did not significantly affect the responses in TFC and %DPPHsc. Thus, 3D plots showed patterns of the effects of powder particle size and extraction times with the fixed level of ethanol concentration at 46.92% in each individual response.
 |
| | Fig. 2 Three-dimensional response surfaces and contour plots for (a) TFC, (b) %DPPHsc, (c) %ABTSsc and (d) desirability as a function of powder particle size and ethanol concentration. | |
3.3.1 TFC.
The 3D response surfaces shown in Fig. 2a indicated the changes in TFC values as a function of powder particle size and extraction times. Results show that the region of tinier powder particle size (80–100 mesh size) and more extraction times (3 times) would give a higher TFC yield (∼12.257 mg g−1), compared to larger powder particle size and less extraction times. As these parameters increased, TFC yield also increased from 5.178 to 12.257 mg g−1.
3.3.2 Antioxidant activities (%DPPHsc and %ABTSsc).
Fig. 2b about the 3D response surfaces of %DPPHsc showed that the tinier powder particle size (80–100 mesh size) and more extraction times (3 times) would increase the %DPPHsc value from 34.908 to 67.226%, as well as the results of %ABTSsc value shown in Fig. 2c changing from 33.121 to 69.825%.
3.4 Verification of predictive models
RSM is an efficient experimental method to determine optimal conditions for a system comprising many variables to calculate the combined effect of selected variables.25 The 3D response surfaces described by the regression model were drawn to illustrate the effects of the independent variables. The 3D response surfaces of desirability pattern shown in Fig. 2d demonstrate that the optimal conditions were 46.92% ethanol (x1), particle size of 78.52 mesh size (x2) for 3 times (x3). Hence, the model predicted values were TFC 12.29 mg g−1, %DPPHsc 67.23% and %ABTSsc 70.55%.
According to the above research, an optimisation study was performed to evaluate the optimal operating conditions of individual response as well as combination of all responses. An amount of 2 g sample was extracted at the conditions of 80–100 mesh powder with 50% ethanol for 40 ml, per 30 min for 3 times, 30 °C, 25 kHz, 300 W. The experimental values of TFC, %DPPHsc and %ABTSsc were 12.26 mg g−1, 67.23% and 69.82%, consistent with the predicted values. Thus, the model can be used to optimise the process of bioactive compounds extraction from Lophatherum gracile B.
3.5 HPLC-PAD coupled with pre-column DPPH and ABTS assay for screening of antioxidants
The extract of Run.5 (R5) was subjected to the HPLC-PAD coupled with pre-column DPPH assay using the optimized chromatographic conditions. Comparison of the HPLC chromatograms of untreated and DPPH-treated samples (Fig. 3a and b) indicate that at least five known structures and eleven unknown structure flavonoids, as well as the other unknown compounds, decreased in the chromatogram of the reaction mixture of R5 and DPPH, comparing to the original chromatogram of R5. Based on the five standard chromatographs in Fig. 3c, the five known flavonoids were isoorientin, orientin, swertiajaponin, vitexin and luteolin-7-O-β-D-glu. Compared with the ultra-violet absorption curve with the two characteristic conjugated ultraviolet absorption peaks of flavonoids, eleven unknown structure compounds were referred to as flavonoids.
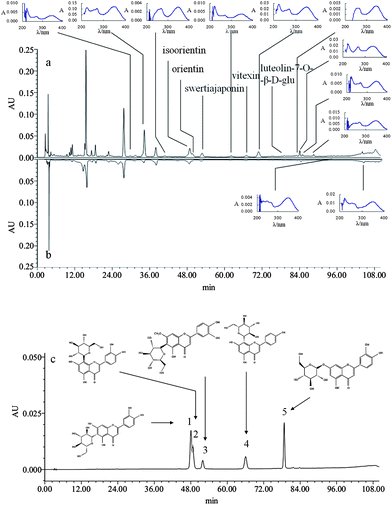 |
| | Fig. 3 HPLC-PAD chromatograms of extract and standards monitored at 311 nm. (a) Original extract sample before reaction; (b) extract after reaction with DPPH free radicals; (c) five standards: (1) isoorientin; (2) orientin; (3) swertiajaponin; (4) vitexin; (5) luteolin-7-O-β-D-glu. | |
4. Conclusions
The large portion of contents and compositions of bioactive compounds such as antioxidants in Lophatheri Herba still unknown and underutilized. Response surface methodology was used to determine the optimum process parameters that yield high antioxidant contents and activities. ANOVA indicated that the effects of powder particle size and extraction times were significant in TFC yield and antioxidant activities. Quadratic models were used to predict the responses. The optimal operating conditions of individual and combination of all responses were determined. The experimental values were according to the predicted values, not significant.
A simple, low-cost and efficient method using DPPH radical assay followed by HPLC-PAD analysis was used to screen antioxidants from Lophatheri Herba, and five antioxidants were identified structurally, and eleven antioxidants were concluded as flavonoids.
The response surface methodology methods established could be used to optimise the process of bioactive compounds extraction from Lophatheri Herba. HPLC-PAD coupled with pre-column antioxidant assay could be developed to a high-throughput method for antioxidants screening and identification in Lophatheri Herba, furthermore, it could be widely used in the search for principal bioactive components in complex mixtures.
Acknowledgements
This work was financially supported by 2013 Project for Jiangsu Province Ordinary University Postgraduates Innovation Research Program (no. CXZZ13_0630), High-Tech Industry Development Program from Jiangsu Province Office of Education (no. JHB04-039 to Q.N.W.), Project for Research Findings Industrialization Promoting of Jiangsu Universities (no. JHZD09-11 to Q.N.W.) and 2011 Project for Outstanding Scientific and Technological Innovation Team on Traditional Chinese Medicine Resource Chemistry of Colleges and Universities of Jiangsu Province (2011).
References
- E. Mariani, M. C. Polidori, A. Cherubini and P. Mecocci, J. Chromatogr., B: Anal. Technol. Biomed. Life Sci., 2005, 827, 65–75 CrossRef CAS PubMed.
- G. M. Williams and A. M. Jeffrey, Regul. Toxicol. Pharmacol., 2000, 32, 283–292 CrossRef CAS PubMed.
- I. Fridovich, Science, 1978, 201, 875–880 CAS.
- J. E. Kinsella, E. Frankel, B. German and J. Kanner, J. Food Technol., 1993, 47, 85–89 CAS.
- D. Wu, J. Y. Chen, B. Y. Lu, L. N. Xiong, Y. He and Y. Zhang, Food Chem., 2012, 135, 2147–2156 CrossRef CAS PubMed.
- L. Zahradnikova, S. Schmidt, S. Sekretar and L. Janac, J. Food Nutr. Res., 2007, 46, 15–19 CAS.
- A. S. G. Costa, M. A. Nunes, I. M. C. Almeida, M. R. Carvalho, M. F. Barroso, R. C. Alves and M. B. P. P. Oliveira, LWT–Food Sci. Technol., 2012, 49, 324–328 CrossRef CAS PubMed.
- Y. Shao, Q. N. Wu, J. Zhou, W. Yue and J. G. Chao, Chin. Pharmacol. Bull., 2013, 29, 241–247 Search PubMed.
- K. Robards, P. D. Prenzler, G. Tucker, P. Swatsitang and W. Glover, Food Chem., 1999, 66, 401–436 CrossRef CAS.
- J. Zhang, Y. Wang, X. Q. Zhang, Q. W. Zhang and W. C. Ye, Chin. J. Nat. Med., 2009, 7, 428–431 CrossRef CAS.
- T. Y. Liu, Y. H. Lu, D. Z. Wei and W. Y. Zhou, Chin. Tradit. Pat. Med., 2009, 31, 96–100 Search PubMed.
- Y. Shao, Q. N. Wu, Y. P. Tang, R. Chen and M. Liu, Instrum. Sci. Technol., 2011, 39, 419–431 CrossRef CAS.
- K. Karthikeyan, K. Nanthakumar, K. Shanthi and P. Lakshmanaperumalsamy, Iran. J. Microbiol, 2010, 2, 213–222 CAS.
- D. O. Kim, S. W. Jeong and C. Y. Lee, Food Chem., 2003, 81, 321–326 CrossRef CAS.
- H. F. Lu, H. Q. Lou, H. Zheng, Y. Hu and Y. Li, Food Bioprocess Technol., 2011, 5, 2586–2595 CrossRef.
- C. Y. Gan and A. A. Latiff, Food Chem., 2011, 124, 1277–1283 CrossRef CAS PubMed.
- X. S. Wang, Q. N. Wu, Y. F. Wu, G. Y. Chen, W. Yue and Q. L. Liang, Molecules, 2012, 17, 6769–6783 CrossRef CAS PubMed.
- M. J. Prakash, S. Manikandan, K. Thirugnanasambandham, N. C. Vigna and R. Dinesh, Carbohydr. Polym., 2013, 92, 604–611 CrossRef PubMed.
- J. Y. Qiu, L. L. Chen, Q. J. Zhu, D. J. Wang, W. L. Wang, X. Sun, X. Y. Liu and F. L. Du, Food Chem., 2012, 135, 2366–2371 CrossRef CAS PubMed.
- L. Q. Sun, X. P. Ding, J. Qi, H. Yu, S. A. He, J. Zhang, H. X. Ge and B. Y. Yu, Food Chem., 2012, 132, 759–765 CrossRef CAS PubMed.
- H. Yao, Y. Chen, P. Y. Shi, J. Hu, S. G. Li, L. Y. Huang, J. H. Lin and X. H. Lin, Food Chem., 2012, 135, 2802–2807 CrossRef CAS PubMed.
- R. V. Lenth, Technometrics, 1989, 31, 469–473 CrossRef.
- U. Salgin, J. Supercrit. Fluids, 2007, 39, 330–337 CrossRef CAS PubMed.
- M. K. Khan, M. Abert-Vian, A. Fabiano-Tixier, O. Dangles and F. Chemat, Food Chem., 2010, 119, 851–858 CrossRef CAS PubMed.
-
R. H. Myers and D. C. Montgomery, Response surface methodology: Process and product optimization using designed experiments, 1995 Search PubMed.
|
| This journal is © The Royal Society of Chemistry 2014 |
Click here to see how this site uses Cookies. View our privacy policy here. 


