A fast LC-MS/MS assay for methotrexate monitoring in plasma: validation, comparison to FPIA and application in the setting of carboxypeptidase therapy
Régis
Bouquié
*ab,
Guillaume
Deslandes
a,
Blanca
Nieto Bernáldez
ac,
Christian
Renaud
a,
Eric
Dailly
ad and
Pascale
Jolliet
ab
aClinical Pharmacology Department, Nantes University Hospital, France. E-mail: regis.bouquie@chu-nantes.fr
bEA 4275 Biostatistique, Pharmaco-épidémiologie et Mesures Subjectives en Santé, University of Nantes, France
cCSIC/Universidad de Salamanca, Centro de Investigación del Cancer, Salamanca, Spain
dThérapeutiques cliniques et expérimentales des infections, EA 3826, Nantes, France
First published on 4th October 2013
Abstract
High-dose methotrexate remains a mainstay in the treatment of acute lymphoblastic leukaemia, osteosarcoma and non-Hodgkin lymphoma. Therapeutic drug monitoring of plasma MTX is important to monitor efficacy and adverse events. The authors aimed at developing a liquid chromatography tandem mass spectrometry (LC-MS/MS) method with online extraction to determine MTX and 7-OH-MTX in plasma for therapeutic drug monitoring. The analysis combined straightforward sample preparation, consisting of protein precipitation with methanol/ZnSO4, with a 4-minute run time consisting of an on-line enrichment by a flush/back-flush cycle (Poros column, R1/20, 2.1 mm × 30 mm) before the second dimension chromatography (Phenomenex Luna 5 μm Phenyl Hexyl, 2 mm × 50 mm column). Samples were analysed using an HPLC Agilent 1200 Series and ABSciex API 3200. The electrospray was operated in positive ionization mode monitoring the following mass transitions: m/z 455.11 → 308.3 for MTX, 471.14 → 324.3 for 7-OH-MTX and m/z 459.1 → 312.3 for internal standard (MTX13C2H3). The method was linear up to 50 μmol L−1, and intra-day and inter-day quality control CVs were below 8.3% for MTX and 11.71% for 7-OH-MTX. Average recovery was 24% for MTX and 57% for 7-OH-MTX. The lower limit of quantitation was 25 nmol L−1 for the 2 analytes. For MTX and 7-OH-MTX the standard line slope CV percentage was <3% and the slope difference <6%, indicating that our analytical method is almost free from a significant relative matrix effect. Method comparison with the Abbott TDx fluorescent polarization immunoassay (FPIA) showed excellent agreement: LC-MS/MS = 0.0011 + 1.0334 (FPIA). Because of antibody cross-reactivity between DAMPA and MTX, none of the immunoassays can be used after carboxypeptidase administration. The goal of our work was to develop a specific LC-MS/MS method to monitor both MTX and 7-OH-MTX plasma concentrations within the clinically relevant range. It's expected that the LC-MS/MS method for MTX monitoring after carboxypeptidase administration will be very rarely used since it concerns only exceptional cases. Therefore, the geographically balanced distribution of University Hospital able to ensure follow-up of these patients, within 24 hours of collection, can draw a reliable solution for the security of the patients. We develop a fast and reliable LC-MS/MS method for both routine TDM of MTX as in the setting of carboxypeptidase therapy.
Introduction
Methotrexate (MTX) is the main folate antagonist and one of the most widely used antimetabolites in cancer chemotherapy. Folates are essential for DNA synthesis and cell division. MTX follows folate pathway: MTX is actively taken up into the cells by the reduced folate carrier and then converted to polyglutamates, which are retained in the cells and inhibit dihydrofolate reductase which converts first the folate to dihydrofolate and then to tetrahydrofolate.1–3High-dose methotrexate (HDMTX) remains a mainstay in the treatment of acute lymphoblastic leukaemia, osteosarcoma and non-Hodgkin lymphoma. HDMTX is defined as MTX dose >1 g m−2 administered by intravenous infusion in many different doses and schedules.4 For example to treat children's osteosarcoma, a MTX dose of 8–12 g m−2 is administered by 3 hour intravenous infusion.5
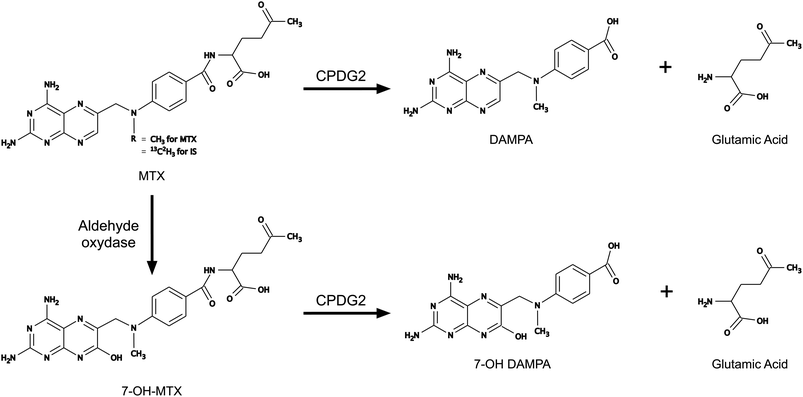
MTX is poorly metabolized; only a few percentage of doses are converted to 7-hydroxy-methotrexate (7-OH-MTX), and most of the dose is found unchanged in urine.4 Common unwanted effects include bone marrow depression and mucositis, but acute nephrotoxicity induced by MTX and 7-OH-MTX precipitations in renal tubules is dreadful. However, toxicity incidence can be alleviated through diverse measures. HDMTX-induced nephrotoxicity is prevented through substantial hydration and alkalinisation of urine to enhance elimination.6,7 Folinic acid rescue, to restore intracellular folate concentration, is guided by plasma creatinine and MTX concentration monitoring. Nevertheless, renal impairment causes delayed MTX elimination and ineffective folinic acid rescue. As a last resort, hydrolysis of MTX and 7-OH-MTX by carboxypeptidase (CPDG2) can be used. A single administration of this enzyme can inactivate more than 95% of MTX to 2,4-diamino-N10-methylpteroic acid (DAMPA) and around 50% of 7-OH-MTX8 (Fig. 1). In France, CPDG2 administration is recommended for patients whose plasma MTX concentration is >10 μmol L−1 48 hours after the beginning of infusion or for patients whose plasma creatinine is >1.5 times the basal level and plasma MTX concentration is >3 μmol L−1 48 hours after the beginning of infusion.7,9,10
Thus, MTX concentration monitoring is crucial for detection of a poor MTX elimination as quickly as possible. Plasma MTX concentrations are routinely monitored by fluorescence polarization immunoassay (FPIA) after HDMTX administration. Unfortunately, MTX concentrations following carboxypeptidase administration can only be monitored by a chromatographic method, because of DAMPA cross-reactivity with antibodies used by immunoassays.11–13 In order to monitor MTX concentrations after CPDG2 administration, we have developed a liquid chromatography-tandem mass spectrometry method (LC-MS/MS) for MTX and 7-OH-MTX measurements.
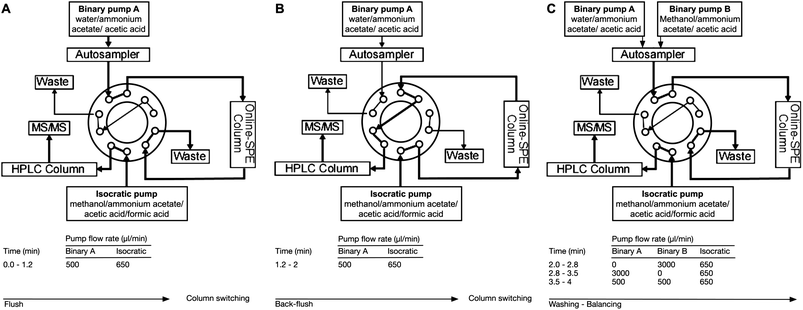
While HPLC methods were published in the past year, only a few authors describe a method able to quantify rapidly both MTX and 7-OH-MTX.14–16 Most of the above-mentioned methods have not been developed in human patients' plasma, with a wide range of possible cross-reactivities, and a wide amplitude of concentration.14,17 Begas et al. developed an SPE offline-LC-MS/MS with specificity and sensibility close to our method but for MTX alone and with a run of 16 min (Fig. 2).16
The goal of our method was to develop a specific LC-MS/MS method to monitor both MTX and 7-OH-MTX plasma concentrations within the clinically relevant range.
Materials and methods
Patients
All patient samples tested in this work derived from an ongoing drug-monitoring program and were reported in accordance with ethical guidelines. Indeed an informed consent was not required.Chemicals, reagents and standard solutions
All solvents and reagents were of HPLC-grade and were purchased from VWR International (Fontenay-sous-Bois, France). MTX solution was purchased from Mylan (Saint Priest, France), DAMPA was purchased from Schircks laboratories (Jona, Switzerland), 7-OH-MTX was purchased from Alphachimica laboratories (Châtenay-Malabry, France) and 13C2H3-MTX, used as the internal standard (IS), was purchased from Alsachim (ILLKIRCH, France).MTX plasma multilevel calibrators and quality controls (QC) were provided by Abbott Diagnostics (Abbott Park, IL) and were used for fluorescent polarization immunoassay. Homemade quality controls and plasma multilevel calibrators, containing both MTX and 7-OH-MTX, were used for all LC-MS/MS assays.
Protein precipitation solution was a mixture of methanol and 0.2 M ZnSO4 (80![[thin space (1/6-em)]](https://www.rsc.org/images/entities/char_2009.gif) :
:![[thin space (1/6-em)]](https://www.rsc.org/images/entities/char_2009.gif) 20, vol/vol) containing IS (1 μmol L−1) and stored at −20 °C. The different lots of drug-free plasma samples originated from our laboratory.
20, vol/vol) containing IS (1 μmol L−1) and stored at −20 °C. The different lots of drug-free plasma samples originated from our laboratory.
LC-MS/MS assay
Protein precipitation was carried out in 1.5 mL polypropylene tubes (Eppendorf, Le Pecq, France). A volume of 50 μL of calibrator, QC or patient sample was mixed with 100 μL of precipitation solution. The mixture was vortex-mixed for 5 min, and centrifuged at 15![[thin space (1/6-em)]](https://www.rsc.org/images/entities/char_2009.gif) 300 g at 4 °C for 10 min. Subsequently the supernatant was transferred into a polypropylene tube with pierceable membrane screw caps, and 20 μL were injected into the chromatographic system.
300 g at 4 °C for 10 min. Subsequently the supernatant was transferred into a polypropylene tube with pierceable membrane screw caps, and 20 μL were injected into the chromatographic system.
The instrument setup is shown in Fig. 2. The chromatographic system consists of Agilent 1200 Series components (Palo Alto, USA) including a binary pump, an isocratic pump, a column oven, and an auto-sampler. The hardware configuration included an ABSciex API 3200 (Toronto, Canada) equipped with a turboionspray source. Two-dimension chromatography was performed. First dimension chromatography is an on-line enrichment performed by a perfusion column (POROS R1/20, 2.1 mm × 30 mm, ABSciex, Foster City, USA). The binary pump supplied water–ammonium acetate (10 mM)–acetic acid (0.1%), for enrichment of analytes and IS on the Poros column. A back-flush elution was performed using the isocratic pump (methanol–ammonium acetate (10 mM)–acetic acid (0.1%)–formic acid (0.2%)). The second dimension chromatography was performed using a Phenomenex Luna 5 μm Phenyl Hexyl, 2 mm × 50 mm column housed in an oven at 60 °C (Torrance, USA). Positive ion electrospray, schedule MRM mode was used for analytes and IS (Table 1). The procedure was performed using the Analyst 1.5.2 software package.
| Compound | Precursor ion (m/z) | Product ion (m/z) | RT (min) | EP | CEP | CE (eV) | CXP |
|---|---|---|---|---|---|---|---|
| a Retention times (RT), entrance potential (EP), cell entrance potential (CEP), collision energy (CE) cell exit potential (CXP) for API 3200, and for the phenyl–hexyl HPLC column. | |||||||
| MTX | 455.11 | 308.3 | 1.7 | 8.5 | 18 | 27 | 4 |
| 7-OH-MTX | 471.14 | 324.3 | 1.7 | 6 | 20 | 19 | 6 |
| 13C2H3-MTX | 458.10 | 312.3 | 1.7 | 10.5 | 16 | 41 | 10 |
Fluorescent polarization immunoassay (FPIA)
The assay is performed according to manufacturers' instructions (Abbott Diagnostic, Abbott Park, IL). Calibrators, controls, or patient plasma samples (100 μL) were transferred into reaction cells and submitted to a TDxFLx instrument for automated analysis. The range of the methotrexate calibration curve was 0.00 to 1.00 μmol L−1, and samples containing methotrexate at higher concentrations were diluted. The limit of quantitation was 0.03 μmol L−1.Standard line slope assays for matrix effect assessment
Stock solutions in water were prepared as follows: MTX and 7-OH-MTX at a concentration of 1000 μmol L−1. These stock solutions were diluted with an adequate volume of drug-free plasma samples. Five different lots of plasma sample were used for spiking all standard curve samples for the post-extraction addition assay.LC-MS/MS validation procedures
Triplicates of a dilution of the low QC determined the lowest limit of quantification (LLOQ) of MTX and 7-OH-MTX. The lowest concentration that can be measured with an imprecision and inaccuracy below <20% each defines the LLOQ.
The “cross-talk” between MRM transition used for monitoring analytes and IS were evaluated by analysing of MTX or 7-OH-MTX calibrator samples spiked with MTX or 7-OH-MTX or DAMPA.
Stability
Manufacturers provided the stability studies of analytes and IS. The storage stability of human plasma and the influence of the freeze–thaw cycle were also examined by processing a set of QC and patient samples.Data analysis, interpretation and statistics
Chromatographic data processing was performed using the Analyst 1.5.2 software package (ABSciex, Foster City, USA). Linear regression analyses and statistical analyses were performed with Prism software (Graphpad Software, La Jolla, USA). The Passing and Bablok test was used for method comparison.Results
LC-MS/MS method validation
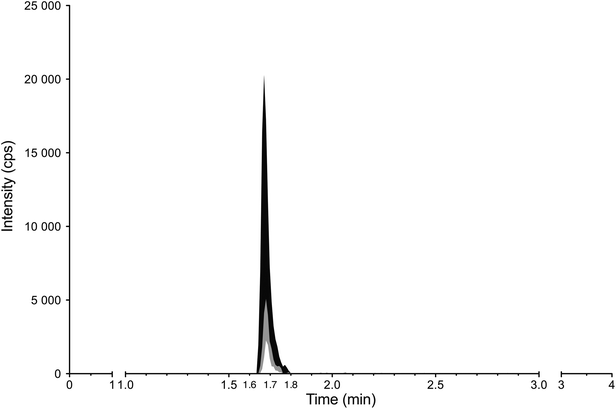
This method was validated in human plasma over the concentration range of 0.05 to 50 μmol L−1 for MTX and 7-OH-MTX. The accuracy and precision, determined for both intra- and inter-runs, are summarized in Table 2. Intra-day and inter-day QC CVs were below 8.3% for MTX and 11.71% for 7-OH-MTX. The intra-day accuracy was found to be between −0.05% and +1.61% for MTX and −1.1% and 11.0% for 7-OH-MTX of the nominal concentration while inter-day performance was between 3.92% and 4.87% for MTX and <1.58% for 7-OH-MTX. The accuracy and precision at the LLOQ are summarized in Table 2.The LLOQ were 0.025 μmol L−1 for the 2 analytes, with accuracy and CV <20% of the nominal concentration. −20 °C frozen MTX QC, 7-OH-MTX QC and patient samples remained stable over 1 month. Fig. 3 shows the representative chromatogram obtained from the standard.| Analyte | QC concentration (μmol L−1) | Intra-day (n = 3) | Inter-day (n = 3) | ||
|---|---|---|---|---|---|
| CV (%) | Mean accuracy (%) | CV (%) | Mean accuracy (%) | ||
| a The following abbreviations were used: QC: quality control, LLOQ: lower limit of quantification, CV: coefficient of variation. | |||||
| MTX | 0.025 (LLOQ) | 6.11 | 12.68 | 16.54 | 9.84 |
| 0.08 | 4.64 | 1.61 | 7.6 | 4.87 | |
| 0.80 | 3.52 | −0.05 | 6.64 | 4.58 | |
| 25 | 7.22 | 2.28 | 8.3 | 3.92 | |
| 7-OH-MTX | 0.025 (LLOQ) | 3.46 | 13.4 | 4.37 | 6.12 |
| 0.08 | 1.02 | 11.0 | 11.71 | 1.13 | |
| 0.80 | 2.27 | −1.10 | 5.33 | 1.58 | |
| 20 | 4.50 | 6.32 | 3.01 | 0.25 | |
Selectivity and cross-talk
Assessment of selectivity needs to be confirmed in the presence of metabolites of the analytes. Some metabolites may be converted into the parent drug during sample preparation and undergo partial fragmentation in the ion sources at high temperatures, giving the same molecular ion as for the parent drug. Because methotrexate polyglutamate forms were only found in red or white blood cells, the main metabolites of MTX found in plasma are 7-OH-MTX and DAMPA after carboxypeptidase infusion.In this work, the cross-talk phenomenon among MS/MS channels was evaluated injecting MTX, 7-OH-MTX and DAMPA separately, at the concentrations of 10 μmol L−1, and monitoring the response in the other channels including the IS one. Samples spiked with the IS alone were also injected to monitor its interference potential on other drug channels. From these experiments no “cross-talk” was observed.
Moreover, the assay selectivity and interferences were also assessed by analysing extracts from the five different blank plasma samples used to assess the matrix effect; endogenous peaks at the retention time of the analytes of interest were not observed in any of the plasma samples evaluated.
Extraction recovery
Extraction recovery was evaluated for all analytes using standards spiked at the concentration mentioned in Materials and Methods. The mean recovery of MTX and 7-OH-MTX were 24 ± 3% and 57 ± 14%, respectively. Extraction of analytes was consistent over the entire range of the standard curve used (Table 3).| Concentrations (μmol L−1) | MTX | 7-OH-MTX | 13C2H3-MTX (mean) |
|---|---|---|---|
| 0.05 | 26 | 75 | 25 |
| 0.25 | 24 | 47 | 28 |
| 0.5 | 23 | 61 | 26 |
| 1 | 21 | 41 | 25 |
| 10 | 28 | 55 | 28 |
| Mean ± SD | 24 ± 3 | 57 ± 14 | 26 ± 1 |
Matrix effect assessment
| Analyte (IS) | Slopes CV (%) | % Slope difference | Measurement performance | Peak area CV (%) | ||
|---|---|---|---|---|---|---|
| % Precision CV range | % Accuracy mean ± SD | Analyte (range) | Internal standard | |||
| MTX | 2.38 | 5.70% | 5.61–10.96 | 100.7 ± 7.95 | 3.04–10.98 | 7 |
| 7-OH-MTX | 2.47 | 5.85% | 2.87–9.29 | 100.6 ± 6.72 | 5.31–14.21 | |
MTX assay method comparison
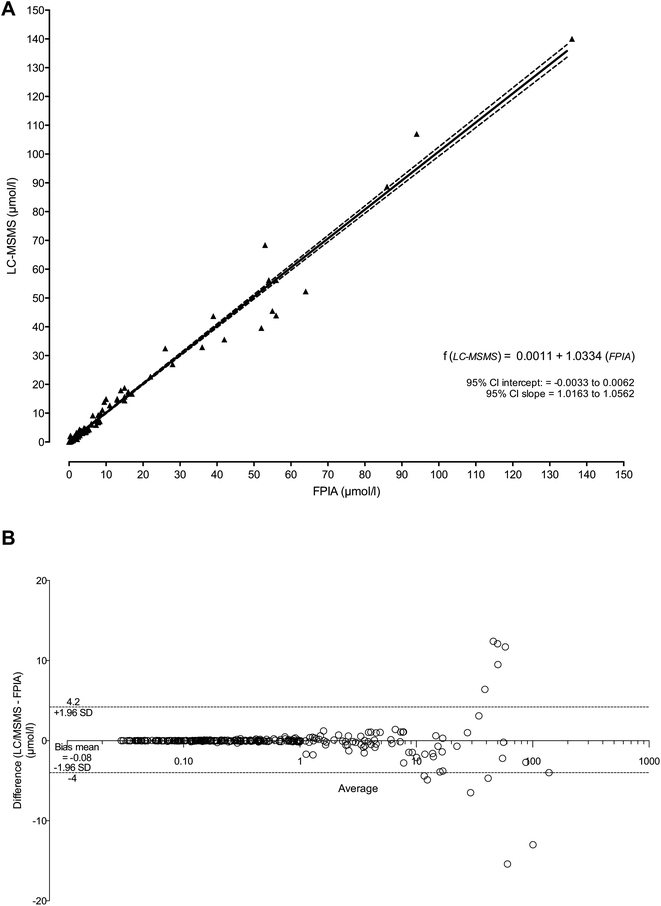
We compared FPIA versus LC-MS/MS analysis for 276 patient plasma samples. A highly significant correlation was found between FPIA and LC-MS/MS with a correlation coefficient of r = 0.991 (95% confidence interval from 0.987 to 0.993). The Passing and Bablok method comparison test (P&B) showed no difference between the two methods with no significant deviation from linearity (Fig. 4A). Fig. 4B shows the Bland–Altman systematic difference between the two methods. The average bias was 0.1 μmol L−1, with a 95% confidence interval from −4 to 4.2.Application to MTX delayed elimination and carboxypeptidase rescue
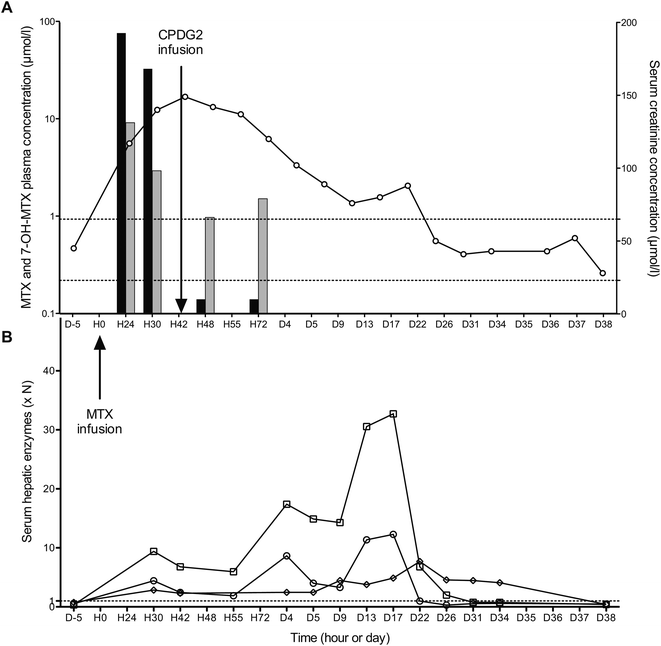
On May 10, 2011, a 9 years old young boy, suffering from osteoblastic osteosarcoma, was hospitalized for a first cure of neo-adjuvant chemotherapy based on HD-MTX. 12 g of MTX were infused over 4 h. MTX plasma concentration monitored by FPIA indicated 76 μmol L−1 and 32 μmol L−1, respectively, 24 and 30 hours after administration. In view of this delayed elimination, it was decided to treat the patient with carboxypeptidase G2. 6 and 30 hours after CPDG2 administration, the MTX plasma concentration monitored by LC-MS/MS was 0.14 μmol L−1. Although salvage therapy was effective, this delayed MTX elimination caused serious disturbance in renal and hepatic functions. As shown in Fig. 5A, the level of serum creatinine increased rapidly after MTX infusion, peaked at H42, and slowly decreased to reach normal values on day 26. The consequences of MTX intoxication on liver function were delayed (Fig. 5B). Hepatic cytolysis reached a peak around 20 ± 2 days after, with 1276, 627 and 147 IU L−1 for aspartate aminotransferase (reference range 0–39 IU L−1), alanine aminotransferase (reference range 0–51 IU L−1), and γ-GT (reference range 0–19 IU L−1), respectively.As expected, CPDG2 enabled significant reduction in the MTX plasma concentration and probably attenuation of renal impact. Strangely, carboxypeptidase performances seem to be less effective on 7-OH-MTX than on MTX. 33% of 7-OH-MTX plasma concentrations remained intact where more than 99% of MTX were destroyed. This result seems in line with the only human study to date.8 Nevertheless, this raises questions about in vivo carboxypeptidase activity on 7-OH-MTX; an in vitro study could confirm this observation.
Discussion
We describe the performance of an LC-MS/MS method for simultaneous quantification of plasma MTX and 7-OH-MTX concentrations. The main objective of this paper was to proceed to a complete validation of our method in order to be able to monitor MTX after carboxypeptidase infusion.Assessment of intra- and inter-day variability was ≤12% for all concentrations tested and <17% for LLOQ (Table 2). The method accuracy was found to be within ±15% for intra-run and inter-run. No “cross-talk” from metabolites or endogenous compounds was observed. For all analytes, the signal in the blank matrix was widely inferior to the first standard curve point as well as the LLOQ.
The overall performance of our method was a LLOQ of 25 nmol mL−1 for MTX and 7-OH-MTX, with an initial plasma sample volume of 50 μL. These performances are consistent with TDM of MTX in both children and adults.9,21,22
For MTX and 7-OH-MTX, the standard line slope CV percentage was <3% and the slope difference <6%, indicating that our analytical method is almost free from a significant relative matrix effect. These results seem to point to the absence of a significant relative matrix effect, as described by Matuszewski et al.18,20
HDMTX has been associated with severe toxicities in as much as 10% of patients, with a mortality rate estimated between 4.6 and 6% in the 1970s.6 Renal dysfunction induced by HDMTX has been estimated to occur in 1.8% of patients; among them 4.4% would die.6 MTX-induced renal dysfunction seems to be mediated by the precipitation of MTX and its metabolites in the renal tubules and probably via a direct toxic effect of MTX on the renal tubules. If MTX is poorly soluble at acidic pH, 7-OH-MTX and DAMPA are six- to tenfold less soluble than MTX.6 Increasing the urine pH higher than 7.0 results in a greater solubility of these molecules. This finding underlies the recommendation of intravenous hydration and urine alkalinisation. Nonetheless, MTX-induced nephrotoxicity can appear, and a vicious cycle is then initiated: impaired renal function leads to even more delayed clearance of MTX, with further impairment of renal function and high sustained MTX blood levels. In this case, folinic acid rescue is ineffective, with an enhancement of MTX's other toxicities, especially bone marrow suppression and mucositis. Serum creatinine and plasma MTX monitoring are essential for early diagnosis of MTX-induced nephrotoxicity. Patients whose, 48 hours after the beginning of the HDMTX infusion, MTX concentration is >10 μmol L−1 or plasma creatinine is >1.5 times the basal level plus plasma MTX concentration is >3 μmol L−1 required carboxypeptidase administration.6,9,21 When CPDG2 is infused, initial dramatic reductions of plasma MTX concentrations (>97%) are achieved, and at the same time the DAMPA concentration reaches a peak. Unfortunately, because of antibody cross-reactivity between DAMPA and MTX, none of the immunoassays can be used to monitor MTX concentration within 48 h after CPDG2 administration. After 48 h, because the DAMPA half-life is around 5 to 9 hours, the immunoassay can be used again. In the meantime, MTX concentration can only be reliable by a chromatographic method. In our hospital, HDMTX-induced toxicities in patients with delayed clearance due to impaired renal function are exceptional: only 3 patients required CPDG2 administration in the past five years.
Despite the striking efficacy of carboxypeptidase, MTX monitoring is required in this patient because it's the sole early criterion for assessing the real importance of the efficiency. Indeed, Widemann et al. emphasized that recovery of renal function, defined as serum creatinine within normal limits, occurred at a median of 22 days.6
Thus, because of delayed clinical improvement and lack of simple and early biological markers able to assess carboxypeptidase efficiency, there is a feeling of helplessness. This may lead us to consider additional CPDG2 dose, which did not result in additional benefits, neither for MTX plasma concentration additional decreases nor for clinical outcome, and is financially misguided (close to 28![[thin space (1/6-em)]](https://www.rsc.org/images/entities/char_2009.gif) 000 € per administration).7,9
000 € per administration).7,9
It's expected that this LC-MS/MS method for MTX monitoring after carboxypeptidase administration will be very rarely used since it concerns exceptional cases only. Nevertheless, given the seriousness of the disease, it seemed to be rational and justified to monitor, as quickly as possible, MTX residue. Obviously, because of the nonavailability of suitable equipment, lack of experience in the use of analytical techniques such as chromatography and the exceptional nature of recourse to this technique, a number of laboratories can't offer this monitoring. Therefore, the geographically balanced distribution of University Hospital able to ensure follow-up of these patients, within 24 hours of collection, can draw a satisfactory, if not optimal, solution for the security of the patients.
Conclusion
FPIA is used by a number of laboratories to follow MTX plasma concentrations. However, because of antibody cross-reactivity between DAMPA and MTX, none of the immunoassays can be used after carboxypeptidase administration. Given the seriousness of the MTX delayed elimination, it seemed to be rational and justified to monitor, as quickly as possible, MTX residue. It's why we needed to develop a specific, simple and fast LC-MS/MS method to monitor MTX plasma concentration within the clinically relevant LOQ (25 nmol L−1 to 50 μmol L−1).References
- I. D. Goldman and L. H. Matherly, The cellular pharmacology of methotrexate, Pharmacol. Ther., 1985, 28, 77–102 CrossRef CAS.
- M. G. Rots, et al. Role of folylpolyglutamate synthetase and folylpolyglutamate hydrolase in methotrexate accumulation and polyglutamylation in childhood leukemia, Blood, 1999, 93, 1677–1683 CAS.
- T. A. de Beaumais and E. Jacqz-Aigrain, Intracellular Disposition of Methotrexate in Acute Lymphoblastic Leukemia in Children, Curr. Drug Metab., 2012, 13, 822–834 CrossRef.
- J. D. Borsi, E. Sagen, I. Romslo and P. J. Moe, Comparative study on the pharmacokinetics of 7-hydroxy-methotrexate after administration of methotrexate in the dose range of 0.5–33.6 g m−2 to children with acute lymphoblastic leukemia, Med. Pediatr. Oncol., 1990, 18, 217–224 CrossRef CAS.
- J. Ritter and S. S. Bielack, Osteosarcoma, Ann. Oncol., 2010, 21, vii320–vii325 CrossRef PubMed.
- B. C. Widemann and P. C. Adamson, Understanding and Managing Methotrexate Nephrotoxicity, Oncologist, 2006, 11, 694–703 CrossRef CAS PubMed.
- B. C. Widemann, et al. Glucarpidase, Leucovorin, and Thymidine for High-Dose Methotrexate-Induced Renal Dysfunction: Clinical and Pharmacologic Factors Affecting Outcome, J. Clin. Oncol., 2010, 28, 3979–3986 CrossRef CAS PubMed.
- B. C. Widemann, et al. Carboxypeptidase-G2, thymidine, and leucovorin rescue in cancer patients with methotrexate-induced renal dysfunction, J. Clin. Oncol., 1997, 15, 2125–2134 CAS.
- H. Blasco, et al. The need for a better definition of therapeutic indications of carboxypeptidase in delayed elimination of methotrexate, Therapie, 2008, 63, 19–28 CrossRef.
- S. Schwartz, et al. Glucarpidase (Carboxypeptidase G2) Intervention in Adult and Elderly Cancer Patients with Renal Dysfunction and Delayed Methotrexate Elimination After High-Dose Methotrexate Therapy, Oncologist, 2007, 12, 1299–1308 CrossRef CAS PubMed.
- V. S. Kumar, T. Law & M. Kellogg, in Clinical Applications of Mass Spectrometry, 2010, pp. 359–363 Search PubMed.
- K. Fotoohi, T. Skärby, S. Söderhäll, C. Peterson and F. Albertioni, Interference of 7-hydroxymethotrexate with the determination of methotrexate in plasma samples from children with acute lymphoblastic leukemia employing routine clinical assays, J. Chromatogr., B: Anal. Technol. Biomed. Life Sci., 2005, 817, 139–144 CrossRef CAS PubMed.
- E. Klapkova, et al. The influence of 7-OH methotrexate metabolite on clinical relevance of methotrexate determination, Clin. Lab., 2011, 57, 599–606 CAS.
- G. Rule, M. Chapple and J. Henion, A 384-Well Solid-Phase Extraction for LC/MS/MS Determination of Methotrexate and Its 7-Hydroxy Metabolite in Human Urine and Plasma, Anal. Chem., 2001, 73, 439–443 CrossRef CAS.
- P. Guo, et al. Determination of methotrexate and its major metabolite 7-hydroxymethotrexate in mouse plasma and brain tissue by liquid chromatography-tandem mass spectrometry, J. Pharm. Biomed. Anal., 2007, 43, 1789–1795 CrossRef CAS PubMed.
- E. Begas, et al. Simple and Reliable HPLC Method for the Monitoring of Methotrexate in Osteosarcoma Patients, J. Chromatogr. Sci., 2013 DOI:10.1093/chromsci/bmt081.
- E. Den Boer, et al. A U-HPLC-ESI-MS/MS-based stable isotope dilution method for the detection and quantitation of methotrexate in plasma, Ther. Drug Monit., 2012, 34, 432–439 CrossRef CAS PubMed.
- Committee for Medicinal Products for Human Use (CHMP), Guideline on Bioanalytical Method Validation, EMA, http://www.ema.europa.eu/ema/pages/includes/document/open_document.jsp?webContentId=WC500109686 Search PubMed.
- Food And Drug Administration, Guidance for Industry on Bioanalytical Method Validation, Federal Register, 23 May 2001, vol. 66(100), p. 28526 Search PubMed.
- B. K. Matuszewski, Standard line slopes as a measure of a relative matrix effect in quantitative HPLC-MS bioanalysis, J. Chromatogr., B: Anal. Technol. Biomed. Life Sci., 2006, 830, 293–300 CrossRef CAS PubMed.
- C. Le Guellec, H. Blasco, I. Benz and A. Hulin, Therapeutic drug monitoring of methotrexate after its administration in high-dose protocols, Therapie, 2010, 65, 163–169 CrossRef PubMed.
- L. Holmboe, A. M. Andersen, L. Mørkrid, L. Slørdal and K. S. Hall, High dose methotrexate chemotherapy: pharmacokinetics, folate and toxicity in osteosarcoma patients, Br. J. Clin. Pharmacol., 2012, 73, 106–114 CrossRef CAS PubMed.
| This journal is © The Royal Society of Chemistry 2014 |

