Simultaneous and highly sensitive quantification of five bioactive components in Fructus Psoraleae and in rat plasma by HPLC with fluorescence detection
Ying
Chen
,
Qiuyue
Xiang
and
Zilin
Chen
*
Key Laboratory of Combinatorial Biosynthesis and Drug Discovery (Ministry of Education), School of Pharmaceutical Sciences, Wuhan University, Wuhan, 430071, P.R. China. E-mail: chenzl@whu.edu.cn; Fax: +86-27-68759850; Tel: +86-27-68759893
First published on 27th November 2013
Abstract
Psoralea corylifolia L. is an important medicinal herb that produces biologically active components. A simple and sensitive high performance liquid chromatography with fluorescence (HPLC-FL) method has been developed for the simultaneous quantification of five bioactive compounds including psoralen, isopsoralen, bavachin, bavachinin and bakuchiol in Fructus Psoraleae. The chromatographic separation was carried out on a C18 column with gradient elution. The fluorescence properties of these five compounds were investigated. At the optimum detection wavelength (λex/λem = 280/405 nm), the analytes provided good fluorescence signals, and simultaneous and highly sensitive determination of these five components was achieved. The limits of detection (signal to noise ratio at 3) of five analytes were 0.8 ng mL−1 for psoralen, 2.5 ng mL−1 for isopsoralen, 1.2 ng mL−1 for bavachin, 2.1 ng mL−1 for bavachinin and 2.4 ng mL−1 for bakuchiol, which were lower than those for most of the current methods. Recoveries for all studied compounds in Fructus Psoraleae were between 93.7% and 108.2%. The proposed method was further applied to the analysis of rat plasma samples after oral administration of Fructus Psoraleae extraction. The results show that the developed HPLC-FL method is a very useful tool for the quality control of herbal medicine Psoralea corylifolia L., and for pharmacokinetics studies.
1. Introduction
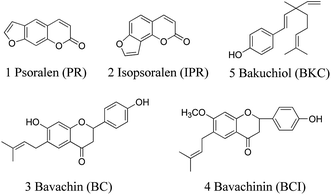
The dried ripe fruit of Psoralea corylifolia L., Fructus Psoraleae, known as 'Buguzhi' in Chinese and native from India to southeastern Asian countries, is a rich source of biologically active components used for the treatment of various diseases. It has been used as a medicinal herb for alleviating asthma, checking diarrhea, treating vitiligo and alopecia areata.1 Recently, various biological activities of Fructus Psoraleae have been confirmed, such as antibacterial,2 antioxidant,3 osteoblastic proliferation stimulating4 and estrogen-like5 activities. The main active components in this herb include coumarins, flavonoids, benzofuran glycosides and meroterpene, such as psoralen (PR), isopsoralen (IPR), bavachin (BC), psoralidin, isobavachalcone (IBC), corylifol A, bavachinin (BCI), bakuchiol (BKC), etc.6,7 PR and IPR are typical coumarin components, while BC and BCI are typical flavonoid components and BKC is the typical meroterpene in Fructus Psoraleae. Their chemical structures are shown in Fig. 1. Clinical studies have shown that PR and IPR are effective against cutaneous T-cell lymphoma and other autoimmune diseases8 and BC can stimulate bone formation.9 In addition, BKC exhibits a variety of bioactivities, such as antitumor, anti-inflammatory and antipyretic.10,11 Recently, BCI has been found to exhibit anti-angiogenic and anti-tumor activities by targeting hypoxia-inducible factor-1α.12 For the quality control of Fructus Psoraleae as well as pharmacological and clinical studies, it is necessary to develop a qualitative and quantitative method for determination of these components.A variety of analytical methods have been developed to determine the bioactive components of Fructus Psoraleae including fluorometric methods,13 high-performance liquid chromatography with ultraviolet detection (HPLC-UV),14–16 mass spectrometry (HPLC-MS)17,18 or electrochemical detection (HPLC-ECD),19 microemulsion electrokinetic chromatography (MEKC),20 and capillary electrophoresis coupled with mass spectrometry (CE-MS).21 Most of the current methods mainly focused on the determination of one or two bioactive components in plants or crude formulations, and the pharmacokinetics studies of PR and IPR by HPLC-MS/MS22,23 and SPE-HPLC-UV,24 BCI by SPE-HPLC-UV25 and BKC by UHPLC-MS/MS.26 These proposed methods have their own advantages and provide extensive choices for analysts. However, in general, the methods mentioned above suffer from the limited number of analytes, insufficient detection limits for biological samples, or complex pretreatments (SPE or pre-column derivatization).
Nowadays, fluorescence detection is considered as an attractive alternative to conventional detectors such as UV-vis due to its high sensitivity. The combination of HPLC and fluorescence detection has been successfully applied in the analysis of traditional Chinese medicines and biological samples.27–29 Since PR, IPR, BC, BCI and BKC contain fluorophores and can generate native fluorescence without the need for derivatization, fluorescence detection is expected to provide an inexpensive, direct, simple, sensitive and specific determination of these five compounds in crude herbal medicines as well as in biological samples.
In recent years, our group has been working on the development of analytical methods for quantification of bioactive components in Fructus Psoraleae. We have successfully developed novel methods for highly sensitive detection of BC and IBC by HPLC-ECD,19 simultaneous determination and quantification of BC, IBC, BCI and BKC by HPLC-UV, ECD and MS,30 chiral separation of BCI by HPLC-MS31 and isomeric separation of BC and IBC by CE-MS.21 The aim of this study is to develop an HPLC-FL method for simultaneous and highly sensitive quantification of PR, IPR, BC, BCI and BKC in Fructus Psoraleae. To the best of our knowledge, this is the first report for fluorescence detection of BC, BCI and BKC, and simultaneous analysis of these five compounds by the HPLC-FL method. The fluorescence properties of the analytes were also studied and the applications of the proposed method were evaluated. The results show that the proposed HPLC-FL method is sensitive, accurate and can be a useful tool for quality control analysis of herbal medicines and has good potential for application in pharmacokinetics studies of PR, IPR, BC, BCI and BKC in vitro and in vivo.
2. Experimental
2.1. Reagents and chemicals
PR (purity ≥99%), IPR (purity ≥99%), BC (purity ≥99%), BCI (purity ≥99%) and BKC (purity ≥99%) were purchased from Shanghai Shunbo Bio-engineering Technology Co., Ltd (Shanghai, China). The ripe seed of Psoralea corylifolia L. was purchased from Liuyouyu Drugstore in Wuhan (Hubei, China). Methanol and acetonitrile (HPLC grade) was obtained from Tedia Chemical (Fairfield, OH, USA). Deionized water (18.25 MΩ cm, Milli-Q Water System, Millipore) was used throughout. All other reagents used in the experiment were of analytical grade unless otherwise mentioned.2.2. Measurement of fluorescence properties
A Luminescence LS55 spectrometer (PerkinElmer, USA) was used for recording fluorescence spectra. The fluorescence spectra of PR, IPR, BC, BCI and BKC in methanol were measured. The stock solutions of these five compounds were diluted to 10 μg mL−1 by methanol.2.3. HPLC instrumentation and conditions
HPLC analysis was carried out using an LC-20AD HPLC system (Shimadzu, Japan) equipped with an RF-10AXL fluorescence detector (Shimadzu, Japan), and a manual injector equipped with a 20 μL sample loop. The separation was performed on a WondaSil C18-WR herbal medicine column (250 × 4.6 mm, 5 μm; GL Science, Tokyo, Japan). Gradient elution was used for the separation. Elution was performed at a flow rate of 1.0 mL min−1. Solvents used were methanol (A) and water (B). The applied gradient elution was as follows: mobile phase A started from 50% and increased linearly to 60% in 10.0 min, and increased linearly to 85% from 10.0 min to 30.0 min. After finishing the run, the gradient was set back to 50% A and the system was allowed to equilibrate. The injection volume was 20 μL and the wavelength of fluorescence detection was set at λex/λem = 280/405 nm. All analysis was performed at 25 °C. The mobile phase was filtered through 0.45 μm nylon filter membranes (Millipore, Milford, MA, USA) and degassed in an ultrasonic bath before being used.2.4. Standard solutions and calibration
Stock standard solutions of PR, IPR, BC, BCI and BKC were prepared in methanol at a concentration of 0.5 mg mL−1 for PR and BC, and 1.0 mg mL−1 for IPR, BCI and BKC. Working solutions were obtained by diluting the standard solutions in the same solvent with concentration ranging from 0.005 to 20.0 μg mL−1 for PR and BC, and 0.010 to 40.0 μg mL−1 for IPR, BCI and BKC. Due to their sensitivity to light and heat, precautions were taken to ensure the stability of PR, IPR, BC, BCI and BKC. Immediately after preparation, all solutions were transferred to amber colored volumetric flasks and kept at 4 °C before analysis. Calibration was obtained by plotting peak areas against the corresponding concentrations and linear relationships were obtained for each analyte.2.5. Preparation of the Psoralea corylifolia sample
The fruit of Psoralea corylifolia L. was pulverized into appropriate powder. 50 mg of the powder was weighed accurately and extracted with 10 mL of methanol in an ultrasonic bath at 20 °C for 4 h and then the sample was taken out of the ultrasonic bath and left at room temperature for 30 min. The crude extract was centrifuged at 10![[thin space (1/6-em)]](https://www.rsc.org/images/entities/char_2009.gif) 000 rpm for 10 min, and the supernatant was collected and diluted to 10 mL with extraction solvent and stored in a refrigerator at 4 °C. Prior to analysis, the solution was appropriately diluted and filtered through a 0.22 μm nylon membrane filter (Shanghai Xingya Jinghua Materials Factory, Shanghai, China).
000 rpm for 10 min, and the supernatant was collected and diluted to 10 mL with extraction solvent and stored in a refrigerator at 4 °C. Prior to analysis, the solution was appropriately diluted and filtered through a 0.22 μm nylon membrane filter (Shanghai Xingya Jinghua Materials Factory, Shanghai, China).
2.6. Preparation of the rat plasma sample
All experimental protocols involving animals were reviewed and approved by the Institutional Animal Experimentation Committee of Wuhan University (Wuhan, China). Sprague-Dawley (SD) rats (180–220 g) were obtained from the Experimental Animal Center of Wuhan University. All the SD rats were kept under standard conditions with normal access to water and food.About 1.0 g of Psoralea corylifolia powder was extracted by 30 mL of 70% ethanol in aqueous solution and ultrasonicated for 3 h. The crude extract was evaporated to 4 mL by rotary evaporation below 60 °C under vacuum and was orally administered to a rat. Blood samples (0.3 mL) were obtained from the caudal vein before dosing and also at 50 min after a single oral dose of 4 mL of extracts, and then the blood samples were transferred to Eppendorf tubes containing 5 μL of 0.25 IU mL−1 heparin and centrifuged at 4000 rpm for 10 min. Plasma samples obtained were mixed with double volumes of methanol, followed by vortex-mixing for 60 s and centrifuged for 15 min at 10![[thin space (1/6-em)]](https://www.rsc.org/images/entities/char_2009.gif) 000 rpm. The supernatant was separated and filtered through 0.22 μm nylon membrane filters and frozen at −20 °C before analysis. Ultimately 20 μL of the deproteinized plasma sample was injected into the HPLC system.
000 rpm. The supernatant was separated and filtered through 0.22 μm nylon membrane filters and frozen at −20 °C before analysis. Ultimately 20 μL of the deproteinized plasma sample was injected into the HPLC system.
3. Results and discussion
3.1. Characteristics of fluorescence spectrometry of five analytes
In order to achieve highly sensitive and simultaneous determination of PR, IPR, BC, BCI and BKC, the fluorescence spectra of these five compounds in methanol were first investigated to estimate the feasibility of this method. All analytes exhibit typical excitation and emission spectra (Fig. 2). The emission curves of IPR, BCI and BKC show a mirror image of their excitation curves. The maximum excitation wavelengths of PR, IPR, BC, BCI and BKC were obtained at 295 nm, 297 nm, 332 nm, 329 nm, and 264 nm, and the maximum emission wavelengths were observed at 430 nm, 428 nm, 401 nm, 395 nm and 332 nm, respectively. All compounds provide sufficient fluorescence to be detected and quantified. As a result, in the present study, the native fluorescence of analytes could be directly detected without the need for fluorescence derivatization.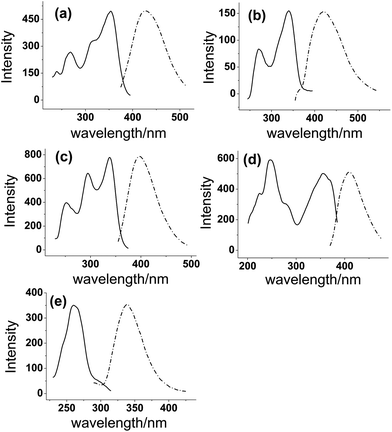 | ||
| Fig. 2 Fluorescence spectra of (a) PR, (b) IPR, (c) BC, (d) BCI, and (e) BKC. Excitation spectra (solid line) and emission spectra (dashed line) in methanol. | ||
3.2. Optimization of HPLC conditions
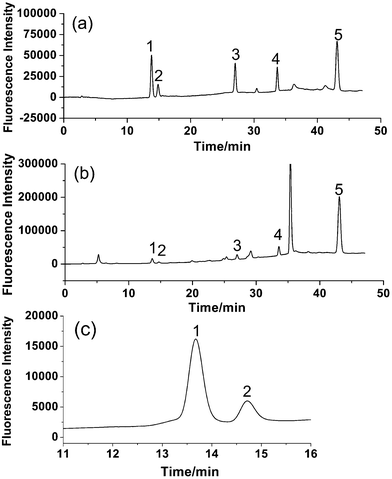
Different columns, mobile phases and fluorescence detection wavelengths were chosen to optimize HPLC systems. Since the separation of bioactive components in Fructus Psoraleae has been performed successfully on C18 columns according to previous reports, in this study, several C18 columns including WondaSil C18-WR herbal medicine (250 mm), Sepax amethyst C18-P (250 mm) and Sepax amethyst C18-P columns (150 mm) were examined and the WondaSil C18-WR herbal medicine column was found to be the most suitable for good peak separation.The most common mobile phase solvents, acetonitrile and methanol, were compared for their performance in separation and it was found that the fluorescence intensities of all five analytes were higher when applying methanol as the mobile phase. As a result, methanol was selected for the further study. For the separation of multiple components, it was the key to obtain good resolution between PR 1 and IPR 2, which have similar structures and the same molecular weights and are difficult to separate by LC. In addition, chromatographic retention behaviors of BC 3, BCI 4 and BKC 5 vary greatly and long analysis time is necessary for a complete separation under isocratic elution. The problem was solved under appropriate gradient elution. Gradient elution was used as follows: 50–60% methanol (10 min) was to obtain a good resolution (over 2.0) between PR 1 and IPR 2, and 60–85% methanol (30 min) was to reduce the retention time of BC 3, BCI 4 and BKC 5. With a sharp gradient, the base-line separation of five components could be realized; however, a flat gradient was required for separation of most of the compounds in the real sample with a more stable baseline. A good separation was achieved under above eluting conditions.
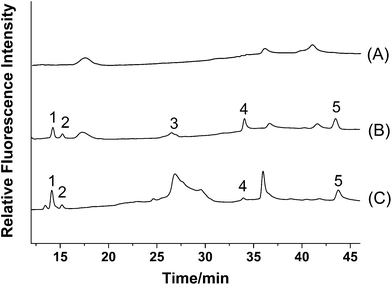
According to the fluorescence spectra of these five compounds, the wavelengths for fluorescence detection in the HPLC system were evaluated. Maximum summations of peak areas and heights of these five compounds were obtained at 280 nm for excitation wavelength and 405 nm for emission wavelength. Based on the results, an optimized HPLC set-up was designed. A tandem UV detector was also used for the determination, and wavelength for UV detection was set at 246 nm according to the literature.16 The typical chromatograms of five analytes with fluorescence and UV detection are shown in Fig. 3. It is obvious that fluorescence detection (Fig. 3A) is more sensitive than UV detection (Fig. 3B) for all analytes.
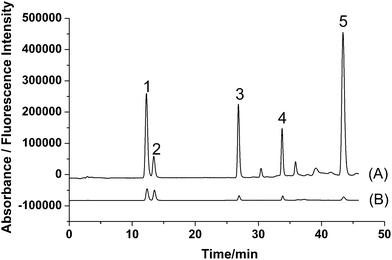 | ||
| Fig. 3 Typical chromatograms of standards of (1) PR, (2) IPR, (3) BC, (4) BCI, and (5) BKC obtained by (A) fluorescence detection (λex/λem = 280/405 nm) and (B) UV detection (246 nm). | ||
3.3. Sample pretreatment
For the Psoralea corylifolia sample, methanol was used as the extraction solvent with the aid of ultrasonication according to our previous reports.19,21 While, 70% ethanol in aqueous solution was used as the extraction solvent for oral administration, and the crude extraction was further concentrated by rotary evaporation to an appropriate volume. Good sensitivity, acceptable recovery and clear supernatant were obtained by using double volumes of methanol as the plasma protein precipitating reagent compared with other reagents such as acetonitrile, acetone and diethyl ether.3.4. Linearity, limits of detection and reproducibility
A test mixture of PR, IPR, BC, BCI and BKC at different concentrations was analyzed. The linear calibration ranges, regression equations, correlation factors, limits of detection (LODs) and limits of quantification (LOQs) are listed in Table 1. Peak areas of these five compounds were linear to their concentrations. The method shows good linearity, with correlation coefficients higher than 0.99 for all compounds. LODs defined at S/N of 3 are 0.8 ng mL−1 for psoralen, 2.5 ng mL−1 for isopsoralen, 1.2 ng mL−1 for bavachin, 2.1 ng mL−1 for bavachinin and 2.4 ng mL−1 for bakuchiol, which are lower than those for most of the existing methods. The repeatability was investigated at a concentration of 5 μg mL−1 for PR and BC, and 10 μg mL−1 for IPR, BCI and BKC. Assays were repeated five times within the same day and during the following three days to determine the repeatability. The relative standard deviations (RSDs) for relative peak areas of the five analytes are shown in Table 1. Intra-day precisions range from 1.68% and 2.71% and inter-day precisions are from 1.44% to 2.89%. These results illustrated that this method showed good precision and reproducibility for the determination of PR, IPR, BC, BCI and BKC.| Analytes | Calibration range (μg mL−1) | Regression equationa | R 2 | LODb (ng mL−1) | LOQc (ng mL−1) | RSD (%, n = 5) | |
|---|---|---|---|---|---|---|---|
| Intra-day | Inter-day | ||||||
| a X: concentration of analyte, μg mL−1. b S/N = 3. c S/N = 10. | |||||||
| PR | 0.005–20 |
Y = 97![[thin space (1/6-em)]](https://www.rsc.org/images/entities/char_2009.gif) 818 + 609 818 + 609![[thin space (1/6-em)]](https://www.rsc.org/images/entities/char_2009.gif) 327X 327X |
0.9938 | 0.8 | 2.7 | 2.5 | 2.9 |
| IPR | 0.010–40 |
Y = 72![[thin space (1/6-em)]](https://www.rsc.org/images/entities/char_2009.gif) 409 + 188 409 + 188![[thin space (1/6-em)]](https://www.rsc.org/images/entities/char_2009.gif) 556X 556X |
0.9982 | 2.5 | 8.5 | 2.6 | 2.5 |
| BC | 0.005–20 |
Y = 57![[thin space (1/6-em)]](https://www.rsc.org/images/entities/char_2009.gif) 856 + 766 856 + 766![[thin space (1/6-em)]](https://www.rsc.org/images/entities/char_2009.gif) 839X 839X |
0.9914 | 1.2 | 4.0 | 2.7 | 2.0 |
| BCI | 0.010–40 |
Y = 58![[thin space (1/6-em)]](https://www.rsc.org/images/entities/char_2009.gif) 038 + 262 038 + 262![[thin space (1/6-em)]](https://www.rsc.org/images/entities/char_2009.gif) 593X 593X |
0.9976 | 2.1 | 7.0 | 1.7 | 1.4 |
| BKC | 0.010–40 |
Y = 61![[thin space (1/6-em)]](https://www.rsc.org/images/entities/char_2009.gif) 337 + 431 337 + 431![[thin space (1/6-em)]](https://www.rsc.org/images/entities/char_2009.gif) 246X 246X |
0.9974 | 2.4 | 7.8 | 2.5 | 2.7 |
3.5. Selectivity
The selectivity of the HPLC-FL method was evaluated by following the method described in the literature.32 Briefly, different mixtures of PR, IPR, BC, BCI and BKC at concentrations within the linearity range were prepared and analyzed by the proposed method. The results obtained were compared with the data of standard curves, and the error was lower than 5%, which indicates the high selectivity of the HPLC-FL method for the simultaneous quantification of PR, IPR, BC, BCI and BKC.3.6. Comparison with other analytical methods
As compared with other analytical methods, the specific features of this method are listed in Table 2. It shows that the proposed method in this work has wide linear ranges and low detection limits. For instance, the sensitivity of fluorescence detection for PR is 200 times higher than that obtained by UV detection and comparable with those of MS and MS/MS detection. In addition, it is preferable for simultaneous determination of these five analytes.| Analytical method | Linear range (μg mL−1) | LOD (ng mL−1) | Ref. | ||||||||
|---|---|---|---|---|---|---|---|---|---|---|---|
| PR | IPR | BC | BCI | BKC | PR | IPR | BC | BCI | BKC | ||
| Fluorometry | 0.002–8000 | 0.002–800 | — | — | — | 0.03 | 0.01 | — | — | — | 13 |
| HPLC-MS | 0.001–1.2 | — | — | — | — | 0.7 | — | — | — | — | 18 |
| HPLC-MS/MS | 0.017–54.3 | 0.011–67.7 | — | — | — | 6.0 | 4.0 | — | — | — | 23 |
| HPLC-UV | — | — | — | — | — | 170 | 154 | — | — | 1370 | 14 |
| HPLC-FD | 0.005–20 | 0.010–40 | 0.005–20 | 0.010–40 | 0.010–40 | 0.8 | 2.5 | 1.2 | 2.1 | 2.4 | This work |
3.7. Applications
In order to evaluate the accuracy and reliability of the proposed method, recovery was tested. Accurate amounts of mixed standards were added to the powder of Fructus Psoraleae, and then extracted as described in the preparation of samples and were analyzed. As shown in Table 3, the mean recoveries are in the range of 93.7–108.2%, with RSD less than 3.1%. These results suggest that the proposed method has good accuracy.
| Analytes | Content (μg) | Added (μg) | Found (μg) | Recovery (%) | RSD (%, n = 3) |
|---|---|---|---|---|---|
| PR | 4.9 | 12.0 | 16.2 ± 0.4 | 95.0 | 2.2 |
| IPR | 7.5 | 12.0 | 19.9 ± 0.5 | 103.3 | 2.7 |
| BC | 12.9 | 12.0 | 24.1 ± 0.6 | 93.7 | 2.3 |
| BCI | 43.2 | 40.0 | 86.4 ± 2.7 | 108.2 | 3.1 |
| BKC | 312.0 | 400.0 | 691.6 ± 18.3 | 94.9 | 2.6 |
| Analytes | Rat plasma content (μg mL−1) | Added (μg mL−1) | Found (μg mL−1) | Recovery (%) | RSD (%, n = 3) |
|---|---|---|---|---|---|
| PR | 1.53 | 1.00 | 2.42 ± 0.04 | 89.0 | 1.7 |
| IPR | 0.05 | 0.10 | 0.16 ± 0.01 | 112.0 | 3.3 |
| BC | — | 5.00 | 5.11 ± 0.14 | 102.1 | 2.7 |
| BCI | 0.07 | 0.10 | 0.17 ± 0.01 | 97.0 | 1.5 |
| BKC | 3.10 | 5.00 | 8.27 ± 0.21 | 103.4 | 2.5 |
4. Conclusions
A simple and highly sensitive HPLC-FL method has been developed for simultaneous determination of PR, IPR, BC, BCI and BKC. The method has a good linearity, reproducibility, precision, accuracy and recovery, and can be used for quantitative analysis of these five bioactive compounds in Fructus Psoraleae. The proposed HPLC-FL method has further been successfully applied to the analysis of the rat plasma sample after oral administration of Fructus Psoraleae extracts. This method is a useful tool for the quality control of Chinese traditional medicines and has great potential for application in pharmacokinetics studies and clinical analysis.Acknowledgements
This work was supported by the National Scientific Foundation of China (Grant no: 21375101, 30973672 and 90817103), the Doctoral Fund of Ministry of Education of China (no. 20110141110024), Hubei Provincial Scientific Foundation (no. 2011CDB475) and the Innovation Seed Fund and Translational Medical Research Fund of Wuhan University School of Medicine.References
- The State Pharmacopoeia Commission of PR China, Pharmacopoeia of the People's Republic of China, Chemical Industry Press, Beijing, 2005 Search PubMed.
- S. Yin, C. Q. Fan, Y. Wang, L. Dong and H. M. Yue, Bioorg. Med. Chem., 2004, 12, 4387–4392 CrossRef CAS PubMed.
- J. M. Guo, X. C. Weng, H. Wu, Q. H. Li and K. S. Bi, Food Chem., 2005, 91, 287–292 CrossRef CAS PubMed.
- S. H. Lim, T. Y. Ha, S. R. Kim, J. Ahn, H. J. Park and S. Kim, Br. J. Nutr., 2009, 101, 1031–1039 CrossRef CAS PubMed.
- C. Z. Zhang, S. X. Wang, Y. Zhang, J. P. Chen and X. M. Liang, J. Ethnopharmacol., 2005, 98, 295–300 CrossRef CAS PubMed.
- R. W. K. Wong and A. B. M. Rabie, Phytother. Res., 2010, 24, S155–S160 CrossRef PubMed.
- Q. Xu, Y. Pan, L. T. Yi, Y. C. Li, S. F. Mo, F. X. Jiang, C. F. Qiao, H. X. Xu, X. B. Lu, L. D. Kong and H. F. Kung, Biol. Pharm. Bull., 2008, 31, 1109–1114 CAS.
- X. Wang, Y. Q. Wang, J. P. Yuan, Q. L. Sun, J. H. Liu and C. C. Zheng, J. Chromatogr., A, 2004, 1055, 135–140 CrossRef CAS PubMed.
- D. W. Wang, F. M. Li and Z. M. Jiang, Planta Med., 2001, 67, 748–749 CrossRef CAS PubMed.
- H. Matsuda, S. Kiyohara, S. Sugimoto, S. Ando, S. Nakamura and M. Yoshikawa, Biol. Pharm. Bull., 2009, 32, 147–149 CAS.
- K. Y. Oh, J. H. Lee, M. J. Curtis Long, J. K. Cho, J. Y. Kim, W. S. Lee and K. H. Park, Food Chem., 2010, 121, 940–945 CrossRef CAS PubMed.
- M. Nepal, H. Jung Choi, B. Y. Choi, S. Lim Kim, J. H. Ryu, D. Hee Kim, Y. H. Lee and Y. Soh, Eur. J. Pharmacol., 2012, 691, 28–37 CrossRef CAS PubMed.
- Y. Qi, Z. G. Pang and B. Q. Wang, J. Anal. Sci., 1998, 14, 65–67 CAS.
- C. F. Qiao, Q. B. Han, J. Z. Song, S. F. Mo, L. D. Kong, H. F. Kung and H. X. Xu, J. Sep. Sci., 2007, 30, 813–818 CrossRef CAS.
- L. Q. Ouyang, H. L. Wu, J. F. Nie, Y. Zhang, H. Y. Zou, H. Y. Fu and R. Q. Yu, Anal. Chim. Acta, 2009, 650, 160–166 CrossRef CAS PubMed.
- Y. F. Wang, B. Wu, J. Yang, L. M. Hu, Y. F. Su and X. M. Gao, Chromatographia, 2009, 70, 199–204 CAS.
- L. Zhao, C. Huang, Z. Shan, B. Xiang and L. Mei, J. Chromatogr., B: Anal. Technol. Biomed. Life Sci., 2005, 821, 67–74 CrossRef CAS PubMed.
- W. Yang, C. Feng, D. Kong, X. Shi, Y. Cui, M. Liu, Q. Wang, Y. Wang and L. Zhang, J. Chromatogr., B: Anal. Technol. Biomed. Life Sci., 2010, 878, 575–582 CrossRef CAS PubMed.
- Y. Li, F. Wang and Z. L. Chen, J. Sep. Sci., 2011, 34, 514–519 CrossRef CAS PubMed.
- H. G. Zhang, J. H. Zhu, S. D. Qi, X. G. Chen and Z. D. Hu, Biomed. Chromatogr., 2007, 21, 1083–1087 CrossRef CAS PubMed.
- Y. L. Zhang and Z. L. Chen, J. Sep. Sci., 2012, 35, 1644–1650 CrossRef CAS PubMed.
- Y. A. Gu, D. Y. Si, J. Gao, Y. Zeng and C. X. Liu, J. Chromatogr., B: Anal. Technol. Biomed. Life Sci., 2009, 877, 3137–3143 CrossRef CAS PubMed.
- L. Feng, L. Wang and X. H. Jiang, Arch. Pharm. Res., 2010, 33, 225–230 CrossRef CAS PubMed.
- C. Feng, J. L. Ruan and Y. L. Cai, J. Braz. Chem. Soc., 2010, 21, 2272–2277 CrossRef CAS PubMed.
- L. Liu, K. N. Liu, Y. B. Wen, H. W. Zhang, Y. X. Lu and Z. Yin, J. Chromatogr., B: Anal. Technol. Biomed. Life Sci., 2012, 893, 21–28 Search PubMed.
- X. Zhuang, Y. Zhong, M. Yuan and H. Li, J. Pharm. Biomed. Anal., 2013, 75, 18–24 CrossRef CAS PubMed.
- R. N. Rao, P. K. Maurya, D. D. Shinde and S. Khalid, J. Pharm. Biomed. Anal., 2011, 55, 282–287 CrossRef CAS PubMed.
- Q. H. Chen, Y. Zeng, J. C. Kuang, Y. Li, X. H. Li, Y. Zheng, H. Hou and S. X. Hou, J. Pharm. Biomed. Anal., 2011, 55, 161–167 CrossRef CAS PubMed.
- M. Kulp, O. Bragina, P. Kogerman and M. Kaljurand, J. Chromatogr., A, 2011, 1218, 5298–5304 CrossRef CAS PubMed.
- Q. H. Chen, Y. Li and Z. L. Chen, J. Pharm. Anal., 2011, 2, 143–151 CrossRef PubMed.
- J. J. Liu, J. Zhang and Z. L. Chen, J. Pharm. Anal., 2013, 3, 349–353 CrossRef PubMed.
- G. M. Hadad, R. A. Abdel Salam, R. M. Soliman and M. K. Mesbah, Talanta, 2012, 101, 38–44 CrossRef CAS PubMed.
- S. T. Yao, B. Yang and Z. L. Xu, Chin. Pharm. J., 1996, 31, 394–396 CAS.
| This journal is © The Royal Society of Chemistry 2014 |

