Preconcentration and determination of bisphenol A, naphthol and dinitrophenol from environmental water samples by dispersive liquid-phase microextraction and HPLC
Qingxiang
Zhou
*a,
Guoqing
Wang
b and
Guohong
Xie
c
aBeijing Key Laboratory of Oil and Gas Pollution Control, College of Geosciences, China University of Petroleum, Beijing Campus (CUP), Beijing 102249, China. E-mail: zhouqx@cup.edu.cn; Fax: +86-10-89732300; Tel: +86-10-89732300
bDepartment of Petroleum and Chemical Engineering, Puyang Vocational and Technical College, Puyang 457000, China
cCollege of Resources and Environment, Henan Institute of Science and Technology, Xinxiang 453003, China
First published on 15th October 2013
Abstract
This paper describes a new, rapid and reliable determination method for bisphenol A, 1-naphthol, 2-naphthol and 2,4-dinitrophenol using dispersive liquid-phase microextraction prior to high-performance liquid chromatography. In this method chlorobenzene was used as the extraction solvent and acetone was used as the disperser solvent. The parameters, which may influence the extraction efficiency such as the types and volumes of extraction solvent and disperser solvent, extraction time, sample pH, centrifugation time and salting-out effect, have been investigated. Under optimal conditions, there was a good linear relationship in the concentration range 0.25–50, 0.5–100, 0.75–150, and 1.5–300 μg L−1 for 2,4-dinitrophenol, 2-naphthol, 1-naphthol and bisphenol A, respectively. The limits of detection based on the ratio of signal-to-noise were equal to three (LODs, S/N = 3) in the range 0.11–0.62 μg L−1. Precision of the proposed method (RSDs, n = 6) were in the range 2.6–9.3%. The experimental results demonstrated that the present method lowered the LOQs compared to that of most existing methods and provided a simple and rapid analytical procedure. The analysis of real water samples spiked with two different concentrations resulted in good spiked recoveries in the range 86.8–118%. These results indicated that the proposed method would be competitive for the analysis of phenols.
1. Introduction
Phenolic compounds are important precursors for the manufacture of many dyes, drugs, perfumes, insecticides, and surfactants.1 These phenolic compounds have high toxicity to human beings, animals and plants. Because of their persistence in the environment and potential carcinogenicity, some phenols have been included in the list of priority pollutants from the United States Environmental Protection Agency.2 Phenols have also received more attention, volatile phenols have been set a permission concentration of 0.002 mg L−1 in the II category surface water quality standard from the Chinese Environmental Protection Agency.3 The EU Commission has set both a tolerable daily intake for bisphenol A (BPA) and a specific migration limit for BPA from food contact plastic materials, and these are 0.05 mg kg−1 and 600 ng g−1, respectively.4,5 BPA is a synthetic substance, which is widely used in industry in the production of epoxy resins and polycarbonates, and is also often used as an antioxidant in polyvinyl chloride plastics. Bisphenol A has been considered as an important environmental endocrine disruptor, which can mimic the body's own hormones and lead to negative health effects.6 A recent Health Canada study found that the measurable levels of BPA existed in the majority of canned soft drinks.7 BPA was considered as a toxic substance and banned in baby bottles in Canada.8 Naphthol is an intermediate in the production of many products such as dyes, synthetic rubber, and plastics, etc. 1-Naphthol is one the major degradation products of naphthalene and a precursor of carbaryl, which is widely used as a pesticide, 2-naphthol can cause severe systemic toxication and these compounds have been classified as environmental carcinogens.9–12 Therefore it is crucial to develop rapid determination methods for the monitoring of phenolic compounds in the environment.In recent years, many methods have been established for the analysis of phenols such as capillary zone electrophoresis,13 single flow-through optosensor spectrofluorimetric system,11 high performance liquid chromatography fluorescence detection,12 electrochemical sensors,16,17etc. Due to the complex matrices a sample pretreatment technique is needed. Up to now, many successful preconcentration techniques have been developed such as cloud point extraction13 liquid–liquid extraction (LLE),18,19 liquid-phase microextraction (LPME),20,21 headspace liquid-phase microextraction,22 solid-phase extraction,23,24 solid-phase microextraction,25 headspace solid-phase microextraction26,27 and single-drop microextraction.28,29 Recently, dispersive liquid–liquid microextraction (DLLME) was introduced as a novel microextraction technique with advantages such as simplicity, rapidity, low sample volume, low cost, high recovery, and a high enrichment factor.30,31 In this method, it is of great importance to select a suitable extraction solvent with higher density than water to obtain a high extraction capability for target compounds.32 Organic solvents such as chlorobenzene, carbon tetrachloride, tetrachloroethylene are the often-used extraction solvents. They can achieve good extraction performance with a small volume. Meanwhile, in order to obtain tiny organic drops of the extraction solvent, a disperser solvent is needed which can promote the dispersing of the extraction solvent in aqueous solution. The disperser solvent often has good miscibility with water, so methanol, acetone, acetonitrile, and ethanol are popularly used disperser solvents. Our group has developed a dispersive liquid–liquid microextraction with an ionic liquid as the extraction solvent for the determination of 2-chlorophenol, 2-naphthol, 2,4-dinitrophenol and 2,4-dichlorophenol.33 In the developed method the temperature is the driving force for dispersing, which is very different from conventional DLLME. The goal of present study is to develop a new method using conventional DLLME for powerful preconcentration and sensitive detection of bisphenol A, 1-naphthol, 2-naphthol, 2,4-dinitrophenol in water samples.
2. Experimental
2.1 Instrumentation
A high performance liquid chromatography system, which consisted of two LC-10 ATvp pumps and an SPD-10 Avp, ultraviolet detector (Shimadzu, Kyoto, Japan) was used for analysis and separation. A reversed-phase shim-pack VP-ODS C18 column (250 mm × 4.6 mm, particle size 5 μm) was used for separation at ambient temperature and a Chromato Solution Light Chemstation for a LC system was employed to acquire and process chromatographic data. The mobile phase was a mixture of methanol and ultrapure water (containing 1% acetic acid) (55![[thin space (1/6-em)]](https://www.rsc.org/images/entities/char_2009.gif) :
:![[thin space (1/6-em)]](https://www.rsc.org/images/entities/char_2009.gif) 45, v/v). The mobile phase flow-rate was set at 0.8 mL min−1, the injection volume was 20 μL, and the detection wavelength was set at 275 nm.
45, v/v). The mobile phase flow-rate was set at 0.8 mL min−1, the injection volume was 20 μL, and the detection wavelength was set at 275 nm.
2.2 Reagents
1-Naphthol and 2-naphthol (analytical grade) were obtained from Shanghai Chemical Corporation (Shanghai, China). Bisphenol A 2,4-dinitrophenol (guaranteed reagent) were purchased from Merck. Methanol (HPLC grade), acetonitrile (HPLC grade), chlorobenzene and acetone (analytical grade) were obtained from Huaiyin Guoda Chemical Reagent Co., Ltd. (Huaian, China). Ultrapure water was prepared with a SZ-93 twice distilled water purification system which was obtained from Shanghai Yarong Biochemical Instrument Factory (Shanghai, China). The aqueous solutions were prepared daily by diluting the standard mixture with ultra-pure water. 3 mol L−1 of sodium hydroxide was used to adjust the pH value of the water samples. All glassware used in the experiments was cleaned with ultrapure water and then soaked in 6 mol L−1 nitric acid for 24 h.2.3 Dispersive liquid-phase micro-extraction
In this preconcentration procedure, 10 mL ultra-pure water or sample spiked at a set concentration was added to a 10 mL conical tube. Then a mixture 500 μL acetone and 100 μL chlorobenzene was injected rapidly into the sample solution and a cloudy solution was formed. The tube was kept for 2 min to enhance the migration of phenols from the sample solution into the tiny droplets of chlorobenzene. Then the mixture was centrifuged for 3 min at 5000 rpm. The upper aqueous phase was removed with a syringe, and the sedimented phase was blown to dryness and the residue was dissolved in 200 μL methanol and 10 μL was used for HPLC analysis.2.4 Water samples
Snow and tap water samples were obtained from Henan Normal University in Xinxiang City, Henan Province. Lake water was collected from Donghu Lake, Xinxiang City, Henan Province, China. Before use, all the environmental water samples were filtered through 0.45 μm micro-pore membranes and stored in brown glass containers at a temperature of 4 °C.3. Results and discussion
3.1 Effect of choice of extraction and disperser solvent
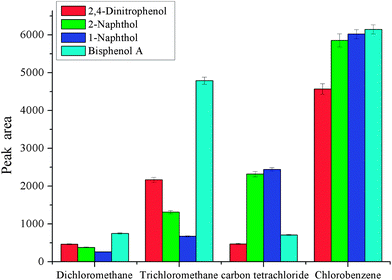
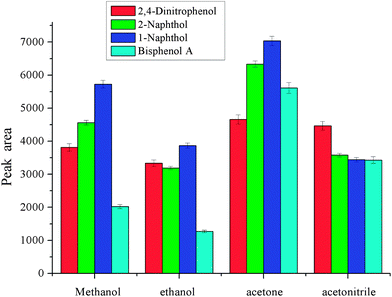
As dispersive liquid liquid microextraction is concerned, the selection of extraction solvent and disperser solvent is of the utmost importance. The extraction solvent should have high solubility for the target analytes and low solubility in water. Meanwhile, it should have a higher density than water for phase separation. As to disperser solvent, it should be miscible with water and have a certain solubility for extraction solvent. These two solvents are closely related. In order to obtain a better extraction solvent and disperser solvent, carbon tetrachloride, chlorobenzene, trichloromethane and dichloromethane were checked for the selection of extraction solvent, and methanol, ethanol, acetonitrile, and acetone were investigated for the selection of disperser solvent. The results are shown in Fig. 1 and 2. From Fig. 1, we can see that the peak areas of the four phenols were very small with dichloromethane and carbon tetrachloride. The polarity of the dichloromethane and carbon tetrachloride is very low, and phenols are polar compounds, which leads to lower solubility of phenols in these solvents. On the other hand, the volatility of dichloromethane is very high, and its sedimented volume is very small. So it is very easy to understand the small peak areas. The performance of trichloromethane and chlorobenzene was better. The solubility of trichloromethane in water is higher than that of chlorobenzene, so chlorobenzene is the best among them for the extraction of selected phenols. Disperser solvent will affect dispersing of the extraction solvent in aqueous solution and further affect the contact area between extraction solvent and the target analytes. Hence, a reasonable disperser solvent is of great importance. Fig. 2 showed that methanol, ethanol, acetonitrile and acetone all have a certain performance for extraction. For methanol and ethanol the recoveries of bisphenol A are very low. The extraction performance with acetonitrile as the disperser solvent is better and the target analytes achieved a higher peak area, but they were lower than that with acetone as the disperser solvent. So acetone was selected as the disperser solvent in further experiments.3.2 Effect of the volumes of extraction and disperser solvents
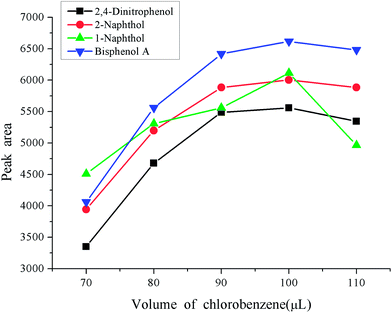
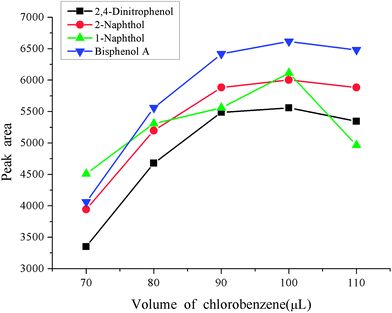
Besides the reasonable extraction solvent and disperser solvent, the volumes also play an important role in the enrichment procedure. A small volume of extraction solvent and disperser solvent will result in an incomplete extraction, which will not reach expectations. If too large volume of solvents are used, this places a heavy pollution risk on the environment due to their toxicity. It will also sacrifice the advantages of a low consumption of organic solvent and a high enrichment factor of the dispersive liquid–liquid microextraction. A series of experiments were designed to optimize the volumes of extraction solvent and disperser solvent. The volume of extraction solvent was investigated in the range 70–110 μL keeping the volume of acetone as 400 μL. The experimental results are shown in Fig. 3. From the figure we can see that the peak areas of the four phenols increased with the increase of the volume of chlorobenzene in the range 70–100 μL, and then decreased with further increases in the volume of chlorobenzene. So, 100 μL was used as the extraction solvent volume. The volume of disperser solvent is also of great importance to obtain a good enrichment performance, which is optimized in the range 300–700 μL. The results are shown in Fig. 4. It was found that the peak areas of the phenols significantly increased with an increase in the volume of acetone in the range 300–500 μL, and markedly decreased when the volume of acetone further increased. Hence 500 μL acetone resulted in the best extraction performance so it was used in the following experiments.3.3 Effect of sample pH
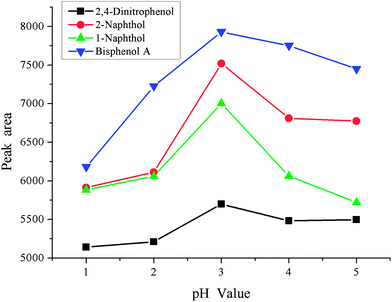
Sample pH is another important factor in the enrichment process, and it is investigated in the range pH 1–5. The results are shown in Fig. 5. It was found that the peak areas of all phenols increased significantly from pH 1–3 and deceased up to pH 5. The reason for this is that phenols are weak acidic compounds and are present as the molecular form under strong acidic conditions. However, phenols would also exist as an addition of [H+] when the acidity of sample solution is too low, which hinders the enrichment process. Due to these facts, pH 3 was used in the following experiments.3.4 Effect of extraction time and centrifugation time
It is also known that extraction time is a vital factor in many of the extraction procedures. In the extraction procedure, a time interval is needed to complete the transfer of the target compounds from aqueous phase to acceptor phase and then to reach an equilibrium. In this experiment, the time interval was optimized in the range 1–20 min, and the experimental data demonstrated that the extraction equilibrium was obtained at 2 min, a longer extraction time would reduce the enrichment efficiency of the analytes. Hence, the extraction time was set at 2 min.The goal of centrifugation is to carry out phase separation, which plays an important role in the DLLME method. The centrifugation time was optimized in the range 1–9 min at 5000 rpm. The peak areas of the analytes increased along with the centrifugation time over the range 1–3 min, when the time was over 3 min, the peak areas decreased. With increased time, more of the extraction organic phase could be completely sedimented, which led to an increase in the peak areas of the analytes. However, a much longer centrifuging time resulted in heat generation,34 which resulted in the transfer of more chlorobenzene into the water phase, and a decrease of the sedimented volume of chlorobenzene. Therefore, 3 min was selected as the centrifuging time.
3.5 Salting-out effect
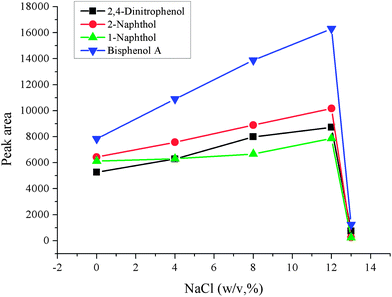
In general, the ionic strength of the sample solution will affect the extraction and cleanup procedure. Usually, addition of a certain amount of salt is the often-used way to change the ionic strength of the sample solution, and NaCl is often used to adjust the ionic strength of the solution. Addition of salt can decrease the solubility of analytes in the aqueous phase and enhance their transfer into the organic phase. However, much more salt can change the physical properties of the Nernst diffusion film, which reduced the rate of diffusion of the analytes into the microdrop. In order to investigate the effect of salt addition, a series of experiments over the NaCl concentration range 0–13%(w/v) were carried out while the other parameters were kept constant. The experimental data is shown in Fig. 6. It can be seen that the peak areas increased with increased NaCl concentration and reached the largest extent at 12% (w/v), and then decreased when the concentration of NaCl exceeded 12% (w/v). The reason for this may be that the increased dynamic viscosity because of high concentration of NaCl inhibits the dispersion of the extraction solvent, and so decreases the contact area of the analytes and extraction solvent, which decrease the extraction efficiency when the concentration of NaCl is over 12%. Hence 12% NaCl was used in further experiments.3.6 Analytical performance
A series of experiments were performed for investigating linear range, precision and detection limits, which are very important parameters for method development. Under optimized experimental conditions, the experimental results showed a good linear relationship over the concentration range 0.25–50 μg L−1, 0.5–100 μg L−1, 075–150 μ gL−1, and 1.5–300 μg L−1 for 2,4-dinitrophenol, 2-naphthol, 1-naphthol and bisphenol A, respectively. The precision was below 9.3% (RSD, n = 6) in six replicate extractions. The experimental results are summarized in Table 1. These results indicated that this method had good reproducibility and linearity with correlation coefficients over the range 0.9995–0.9999 and limit of detection (LODs) in the range 0.11–0.62 μg L−1 (S/N = 3). The enrichment factor was 50. Compared with the existing methods for the determination of naphthols and bisphenol A, we observe that present method provided a good linear range and detection limits (Table 2). The LODs of the present method is similar or better than existing methods and the lower limits of the linear changes of the present method are much lower than the reported methods and the linear range of the present method is much more suitable for the trace determination of such pollutants.| Compound | Precision RSDs (%, n = 5) | Linear range (μg L−1) | Related coefficient (r2) | LODs (μg L−1) |
|---|---|---|---|---|
| 2,4-Dinitrophenol | 2.6 | 0.25–50 | 0.9995 | 0.11 |
| 2-Naphthol | 5.9 | 0.5–100 | 0.9999 | 0.24 |
| 1-Naphthol | 9.3 | 0.75–150 | 0.9987 | 0.61 |
| Bisphenol A | 4.0 | 1.5–300 | 0.9998 | 0.62 |
| Method | Compound | Sample matrix | Linear range (μg L−1) | LODs (μg L−1) | Ref. |
|---|---|---|---|---|---|
| DLLME | 2,4-Dinitrophenol | Water samples | 0.25–50 | 0.11 | Present study |
| 2-Naphthol | 0.5–100 | 0.24 | |||
| 1-Naphthol | 0.75–150 | 0.61 | |||
| Bisphenol A | 1.5–300 | 0.62 | |||
| Capillary electrophoresis-cloud point extraction | 2-Naphthol | River water | 100–5000 | 0.2 | 13 |
| 1-Naphthol | 100–5000 | 0.24 | |||
| Bisphenol A | 200–10![[thin space (1/6-em)]](https://www.rsc.org/images/entities/char_2009.gif) 000 000 |
0.5 | |||
| Flow-through optosensor spectrofluorimetric system | 2-Naphthol | River water samples | 5–20 | — | 14 |
| 1-Naphthol | 10–100 | — | |||
| On-line clean-up column-switching liquid chromatography-fluorescence detection | 2-Naphthol | Human urine | 3–360 | 0.5 | 15 |
| 1-Naphthol | 3–360 | 1.5 |
3.7 Real water sample analysis
Three real water samples were used to evaluate the applicability of proposed method. These samples were directly analyzed and no target analytes were found. In order to realise the real application of the proposed method, the samples were spiked with 10 and 30 μg L−1 for 2,4-dinitrophenol, 20 and 60 μg L−1 for 2-naphthol, 30 and 90 μg L−1 for 1-naphthol, 60 and 180 μg L−1 for bisphenol A, respectively. The results are shown in Table 3 and a typical chromatogram of a spiked snow water sample is shown in Fig. 7. The spiked recoveries were satisfactory in the range 86.8–118%.| Compound | Spiked recoveries (%) | |||
|---|---|---|---|---|
| Name | Spiked (μg L−1) | Snow | Donghu Lake | Tap water |
| a Spiked recovery, mean ± standard deviation (%). | ||||
| 2,4-Dinitrophenol | 10 | 95.6 ± 2.3a | 91.4 ± 4.8 | 106 ± 2.0 |
| 30 | 89.8 ± 3.9 | 93.5 ± 5.5 | 98.7 ± 1.4 | |
| 20 | 94.1 ± 5.3 | 101 ± 6.3 | 91.4 ± 3.8 | |
| 2-Naphthol | 60 | 114 ± 6.1 | 99.9 ± 1.1 | 89.9 ± 0.8 |
| 30 | 93.4 ± 7.0 | 107 ± 5.9 | 87.3 ± 8.5 | |
| 1-Naphthol | 90 | 118 ± 1.3 | 103 ± 8.4 | 86.8 ± 3.3 |
| 60 | 95.2 ± 0.7 | 90.0 ± 8.3 | 97.7 ± 2.8 | |
| Bisphenol A | 180 | 91.7 ± 5.2 | 94.8 ± 3.2 | 97.2 ± 0.4 |
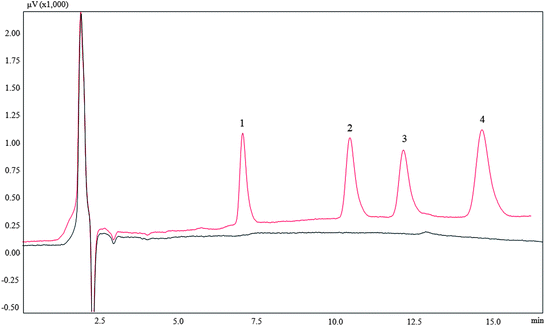 | ||
| Fig. 7 Typical chromatogram of melted snow water. (A): Blank; (B): spiked. Identification peaks: (1) 2,4-dinitrophenol; (2) 2-naphthol; (3) 1-naphthol; (4) bisphenol A. | ||
4. Conclusions
A new, convenient, simple, sensitive, determination method based on dispersive liquid–liquid microextraction in combination with high performance liquid phase chromatography was established for the determination of bisphenol A, 2-naphthol, 1-naphthol and 2,4-dinitrophenol. The proposed method has satisfactory LODs in the range 0.11–0.62 μg L−1 and precision in the range 2.6–9.3% (RSD, n = 6). The proposed method was applied for the analysis of bisphenol A, 2-naphthol, 1-naphthol and 2,4-dinitrophenol in environmental water samples and the spiked recoveries were in the range 86.8–118%. All these results showed that the proposed method had some advantages such as simplicity, ease of operation, low consumption of organic solvents, and increased stability of extraction, and tunable volume of extraction solvent over a relatively wide range. Hence, the method developed is a good analytical tool and will be useful in the routine analysis and monitoring of bisphenol A, 2-naphthol, 1-naphthol and 2,4-dinitrophenol.Acknowledgements
This work was financially supported by the National Natural Science Foundation of China (20877022), Program for New Century Excellent Talents in University (NCET-10-0813) and Science Foundation of China University of Petroleum, Beijing (KYJJ2012-01-15).References
- M. Howe-Grant, Kirk–Othmer Encyclopedia of Chemical Technology, Wiley–Interscience, New York, 4th edn, 1991 Search PubMed.
- US Environmental Protection Agency, Fed. Regist.. 1989, 52, 131 Search PubMed.
- Chinese environmental quality standards for surface water, GB3838–2002, http://kjs.mep.gov.cn/hjbhbz/bzwb/shjbh/shjzlbz/200206/t20020601_66497.htm.
- Opinion of the Scientific Panel on Food Additives, Flavourings, Processing Aids and Materials in Contact with Food (ACF) on request from the Commission related to 2,2-bis(4-hydroxyphenyl)propane (Bisphenol A). Question number EFSA-Q-2005-100, adopted on 29 November 2006, The EFSA Journal 428 (2006) 1.
- Commission Directive 2004/19/EC, of 1March 2004, relating to plastic materials and articles intended to come into contact with foodstuffs (Official Journal of the European Communities L71 8).
- A. C. Gore, Endocrine-disrupting Chemicals: From Basic Research to Clinical Practice, Humana Press Inc., New Jersey, 2007 Search PubMed.
- A. Goodson, W. Summerfield and I. Cooper, Food Addit. Contam., 2002, 19, 796 CrossRef CAS PubMed.
- L. Egan, Canada declares BPA toxic, sets stage for more bans, http://www.theglobeandmail.com/news/national/canada-first-to-declare-bisphenol-a-toxic/article1755272/.
- N. Aktaş, H. Çiçek, A. T. Ünal, G. Kibarer, N. Kolankaya and A. Tanyolaç, Bioresour. Technol., 2001, 80, 29 CrossRef.
- S. Ortega-Algar, N. Ramos-Martos and A. Molina-Díaz, Talanta, 2003, 60, 313 CrossRef CAS.
- S. Zang and B. Lian, J. Hazard. Mater., 2009, 166, 33 CrossRef CAS PubMed.
- W. Zhang, C. Hong, B. Pan, Z. Xu, Q. Zhang and L. Lu, J. Hazard. Mater., 2008, 158, 293 CrossRef CAS PubMed.
- S. Zhong, S. N. Tan, L. Ge, W. Wang and J. Chen, Talanta, 2011, 85, 488 CrossRef CAS PubMed.
- S. Ortega-Algar, N. Ramos-Martos and A. Molina-Díaz, Talanta, 2003, 60, 313 CrossRef CAS.
- R. Preuss and J. Angerer, J. Chromatogr., B: Anal. Technol. Biomed. Life Sci., 2004, 801, 307 CrossRef CAS PubMed.
- X. Huang, G. Zhao, M. Liu, F. Li, J. Qiao and S. Zhao, Electrochim. Acta, 2012, 83, 478 CrossRef CAS PubMed.
- G. Zhu, P. Gai, Y. Yang, X. Zhang and J. Chen, Anal. Chim. Acta, 2012, 723, 33 CrossRef CAS PubMed.
- S. Kjellstrőm and O. N. Jensen, Anal. Chem., 2003, 75, 2362 CrossRef.
- S. X. Peng, C. Henson, M. J. Strojnowski, A. Golebiowski and S. R. Klopfenstein, Anal. Chem., 2000, 72, 261 CrossRef CAS.
- L. W. Chung and M. R. Lee, Talanta, 2008, 76, 154 CrossRef CAS PubMed.
- X. Wang, L. Luo, G. Ouyang, L. Lin, N. F. Y. Tam, C. Lan and T. Luan, J. Chromatogr., A, 2009, 1216, 6267 CrossRef CAS PubMed.
- H. Xu, Y. Liao and J. Yao, J. Chromatogr., A, 2007, 1167, 1 CrossRef CAS PubMed.
- Y. Cai, Y. Cai, S. Mou and Y. Lu, J. Chromatogr., A, 2005, 1081, 245 CrossRef CAS PubMed.
- M. Nichkova and M. P. Marco, Anal. Chim. Acta, 2005, 533, 67 CrossRef CAS PubMed.
- M. N. Sarrioó, F. J. Santos and M. T. Galceran, J. Chromatogr., A, 2002, 947, 155 CrossRef.
- H. P. Ho, R. J. Lee and M. R. Lee, J. Chromatogr., A, 2008, 1213, 245 CrossRef CAS PubMed.
- Y. A. Shi, M. Z. Chen, S. Muniraj and J. F. Jen, J. Chromatogr., A, 2008, 1207, 130 CrossRef CAS PubMed.
- K. Choi, S. J. Kim, Y. G. Jin, Y. O. Jang, J. S. Kim and D. S. Chung, Anal. Chem., 2009, 81, 225 CrossRef CAS PubMed.
- E. Aguilera-Herrador, R. Lucena, S. Cárdenas and M. Valcárcel, Anal. Chem., 2008, 80, 793 CrossRef CAS PubMed.
- S. Berijani, Y. Assadi, M. Anbia, M. R. M. Hosseini and E. Aghaee, J. Chromatogr., A, 2006, 1123, 1 CrossRef CAS PubMed.
- S. Li, S. Cai, W. Hu, H. Chen and H. Liu, Spectrochim. Acta, Part B, 2009, 64, 666 CrossRef PubMed.
- L. He, X. Luo, H. Xie, C. Wang, X. Jiang and K. Lu, Anal. Chim. Acta, 2009, 655, 52 CrossRef CAS PubMed.
- Q. X. Zhou, Y. Y. Gao, J. P. Xiao and G. H. Xie, Anal. Methods, 2011, 3, 653 RSC.
- V. Andruch, I. S. Balogh, L. Kocúrová and J. Šandrejová, J. Anal. At. Spectrom., 2013, 28, 19 RSC.
| This journal is © The Royal Society of Chemistry 2014 |

