Monitoring the mineralisation of bone nodules in vitro by space- and time-resolved Raman micro-spectroscopy†
Adrian
Ghita
a,
Flavius C.
Pascut
a,
Virginie
Sottile
b and
Ioan
Notingher
*a
aSchool of Physics and Astronomy, University of Nottingham, Nottingham, NG7 2RD, UK. E-mail: ioan.notingher@nottingham.ac.uk
bWolfson centre for stem cells, Tissue Engineering and Modelling (STEM), School of Medicine, University of Nottingham, Nottingham, UK. E-mail: virginie.sottile@nottingham.ac.uk
First published on 16th October 2013
Abstract
Raman microscopy was used as a label-free method to study the mineralisation of bone nodules formed by mesenchymal stem cells cultured in osteogenic medium in vitro. Monitoring individual bone nodules over 28 days revealed temporal and spatial changes in the crystalline phase of the hydroxyapatite components of the nodules.
The clinical demand for bone grafts is steadily increasing in many surgical procedures, such as hip replacement, removal of bone tumours, treatment of congenital bone deformities and reconstructive surgery.1 Newer alternative methods to autologous bone grafting are being developed by combining cells, scaffolds and bioreactors in laboratories, in order to produce engineered tissue with optimised properties.2 Mesenchymal stem cells (MSCs) isolated from bone marrow aspirates have been used for bone tissue engineering and for in vitro studies of postnatal osteogenesis.3 However, the information related to the composition of the mineral deposits and their evolution in time is limited. Most of the techniques used for the analysis of the bone nodules, such as Alizarin red or Von Kossa staining, high resolution electron microscopy, X-ray diffraction and spectroscopy, gene expression, have limited chemical specificity, are destructive and can provide only single snap-shots. Therefore, the current understanding of the mineralisation process is mostly based on experimental results obtained at different time-points from parallel cultures. However, one of the difficulties when extrapolating information obtained from single time-point measurements of parallel cultures is related to the biological variability and cell-to-cell heterogeneity. The dynamic patterns and the correlation between the temporal and spatial evolution of the bone nodules is mostly lost in snap-shot assays.
Raman micro-spectroscopy (RMS) is a label-free analytical technique that allows non-invasive time-resolved measurements of cells cultured in vitro with high molecular specificity.4–6 For bone nodules, the frequency and intensity of the symmetric stretching vibration (ν1) of the PO43− group can be used to identify the calcium phosphate (CaP) species.7–9 It was shown that the frequency of the ν1 vibration changes with ionic incorporation and crystallinity of the apatite: 955–958 cm−1 in B-type apatite (carbonate substituted phosphate in apatite lattice), 962–964 cm−1 in nonsubstituted apatite, and 945–950 cm−1 in disordered hydroxyapatite lattice (probably A-type carbonate substitution, i.e. carbonate for hydroxide or amorphous CaP).7,8 More recently, RMS has also been used to study the mineralisation of human MSCs cultured in osteogenic media in vitro and to compare to mineral deposits at different time-points using parallel cultures.10,11
Another important feature of RMS is that it allows in situ time- and spatially-resolved measurements of live cells cultured in vitro, without disturbing the chemical and biological integrity of the cells. Recent studies showed that RMS can be used as a label-free technique to measure chemical changes in apoptotic cells over periods of 35 minutes to 6 hours.4,5 RMS has also been used for time-course experiments over 5–6 days to monitor the cardiac differentiation of human embryonic stem cells grown in purpose-designed micro-bioreactors in vitro.6
Here, we show the feasibility of RMS to study the spatial and temporal development of individual bone nodules in vitro over durations as long as 28 days. The bone nodules were formed by human MSCs cultured in osteogenic medium (medium supplemented with dexamethasone, glycerophosphate and L-ascorbic acid-2-phosphate) and grown in purpose-designed bioreactors (schematic description of the Raman micro-spectrometer is included in the ESI, Fig. S1†).
To account for biological variability of the cells, for each bioreactor seven areas were measured at 2 or 3 days intervals by raster scanning the samples through the laser focus with 3 μm steps size (equivalent to a grid of 70 by 70 points), with acquisition time of 1 s per pixel at each position (laser power 190 mW at sample). Between the Raman spectroscopy measurements the cells were returned in the incubator. At the end of the time-course experiment, the cultures were fixed and stained with Alizarin red to highlight the calcium mineral areas.
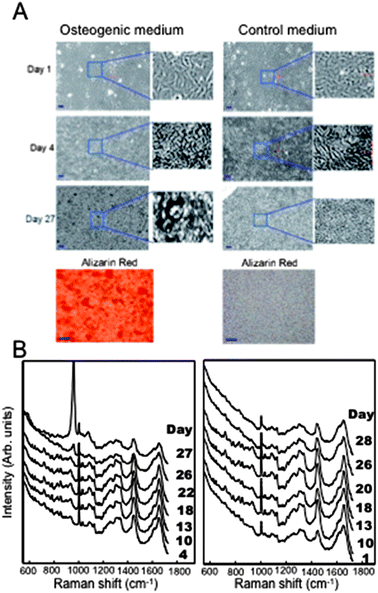
Fig. 1 presents typical time-course phase contrast images and Raman spectra of MSCs grown in osteogenic and control media. At day 1, all cells had a fibroblast-like morphology and covered the entire area of the coverslips forming a compact layer. Significant changes in the morphology and density of the cells cultured in the osteogenic and control media were observed after 4 days (Fig. 1A). These images indicate that the cells grown in the osteogenic medium had a higher proliferation rate compared to cells cultured in the control medium.
Aggregated structures approximately 10 μm in size were observed starting with day 12. The number and size of these structures increased constantly with time, reaching 10–70 μm diameter and a density of ∼7 nodules for areas of 210 μm × 210 μm.11–13 For the cells grown in the control media, no major morphological changes were observed during the 28 days period. Alizarin red staining was carried out at the end of the time-course experiment and confirmed the formation of calcium mineral deposits only for the MSCs cultured in osteogenic medium.
The time-course Raman spectra of the MSCs (Fig. 1B) contain bands corresponding to the main cellular biomolecules (nucleic acids, protein, lipids and carbohydrates)14 and are consistent with previous studies of osteoblasts or other cell types.15 At days 15–20, mineralisation of the bone nodules is indicated by the increase in the intensity of the Raman band at 950–958 cm−1 assigned to the PO43− symmetric stretching of hydroxyapatite. The time-course Raman spectra indicate that the mineralisation started typically after days 15 and 22 of culture (Fig. 1B), in agreement with previous studies,12,13,16 but varied significantly between cultures. The intensity of this band increased with time indicating an increase in the mineral deposition. At the same time, the shape of the PO43− bands changed with time, suggesting temporal changes in the phase of the minerals.
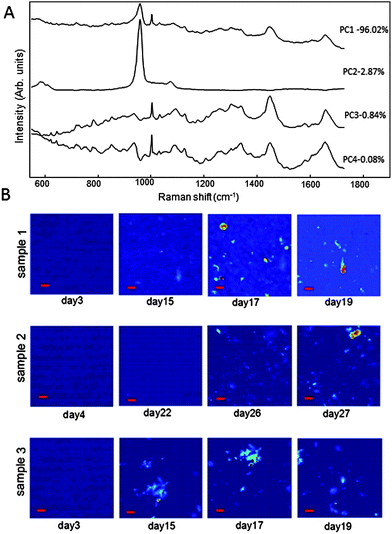
While the average Raman spectra provide information regarding the overall molecular changes of the cells during differentiation and mineralisation, Fig 1A shows that the mineralising cultures are highly heterogeneous. Therefore, principal component analysis (PCA) was used to analyse the time-resolved spectral maps of all measured areas to capture both the temporal and the spatial molecular changes. Fig. 2A presents the loadings corresponding to the first four principal components accounting for most of the spectral variability. The 2nd principal component (PC2) contained an intense band assigned to the PO43− symmetric stretching, indicating mineralisation. Fig. 2B presents the time-course spectral maps corresponding to the PC2 scores for three typical areas of the cell cultures. The results show that the mineralisation occurs in different sizes and shapes, from round to irregular hand-like shapes. The size of the round shapes varied between 10 and 20 μm, whereas the irregular shapes were ∼40 μm.
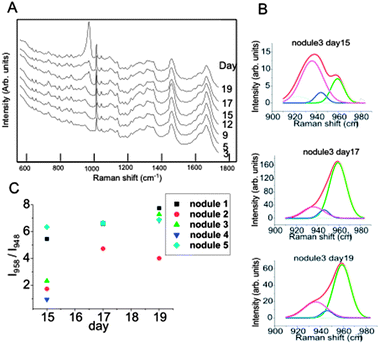
To obtain more insight into the mineralisation of the bone nodules, a more detailed analysis of the spectral region 940–990 cm−1 was carried out. Previous reports indicated that PO43− stretching in crystalline hydroxyapatite produces a sharp peak at 958 cm−1 while the frequency of this vibrational mode is found in the 945–950 cm−1 range for disordered phase hydroxyapatite.7 Using a peak deconvolution algorithm, it was possible to separate the spectral contributions of the disordered and crystalline phases of hydroxyapatite.
As the time-course spectra were recorded from the same bone nodules, it was possible monitor the time-dependent changes related to the minerals for individual bone-nodules (Fig. 3A). Fig. 3B presents the results of the peak deconvolution algorithm for a typical bone nodule in the PO43− symmetric stretching. The results show that the intensity of the Raman band corresponding to crystalline hydroxyapatite (I958) increases with culture time compared to the band corresponding to the amorphous phase (I948). Fig. 3C presents the calculated ratio I958/I948 for five individual bone nodules. The amorphous phase is more abundant in the newly formed bone nodules and evolves towards a more crystalline phase. The results show that the crystalline amorphous ratio for each bone nodule doubles in approximately 4 days after the start of mineralisation. These results obtained at a single bone-nodule level confirm the earlier hypothesis proposed by Posner based X-ray spectroscopy experimental data obtained from bone nodules analysed at different time points.17
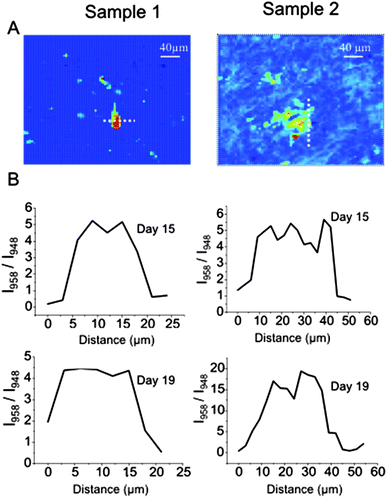
The acquisition of the spectral maps by raster-scanning Raman microscopy combined with the peak deconvolution analysis provided time-resolved information related to the spatial distribution of the amorphous and crystalline phases of hydroxyapatite for individual bone nodules. Fig. 4 presents the line-profiles for the I958/I948 calculated at the start of mineralisation (day 15) and 4 days later for typical round and irregular shaped nodules. The line profiles (Fig. 4B) show that the ratio between crystalline and disordered phase decreases by a factor of 2–3 over a 5 μm distance at the edges of the bone nodules, regardless of the shape of the nodules. The central parts of the bone nodules have a high contribution of crystalline hydroxyapatite while the disordered phase is dominant at the edges.
 | ||
| Fig. 4 (A) PC2 maps for two individual bone nodules. (B) Line profiles at days 15 and 19 (sample 1 on the left and sample 2 on the right). The dash lines in (A) represents the line profile region. | ||
These results suggest that amorphous hydroxyapatite tends to accumulate on the edges of the nodules, followed by a phase transformation in the following days. This suggestion is in agreement with the overall increase in intensity of the Raman band corresponding to the crystalline HA over time (see Fig. 3A).
Conclusion
In this paper we have demonstrated the potential of Raman spectroscopy to perform non-invasive time course experiments on live stem cells over periods as long as four weeks and to measure molecular changes related to in vitro mineralisation. For MSCs cultured in osteogenic medium, spatial and temporal analysis of the Raman spectra indicate that initially the bone nodules consist mainly of amorphous HA that transforms into crystalline HA. Amorphous HA is detected at the edges of the bone nodules even at the late stages of mineralisation, suggesting that during the development of the bone nodules, amorphous hydroxyapatite tends to form at the edges of the nodules, followed by a phase transformation in the following days.This study also highlights the potential of RMS for non-invasive label-free characterisation of bone nodules. Further studies could include, for example, investigations on the pathways/factors regulating the physiological response of stem cells to pro-osteogenic treatments for regenerative medicine applications.
References
- C. J. Damien and J. R. Parsons, J. Appl. Biomater., 1991, 2, 187–208 CrossRef CAS PubMed.
- L. G. Griffith and G. Naughton, Science, 2002, 295, 1009–1014 CrossRef CAS PubMed.
- J. N. Beresford, S. E. Graves and C. A. Smoothy, Am. J. Med. Genet., 1993, 45, 163–178 CrossRef CAS PubMed.
- A. Zoladek, F. C. Pascut, P. Patel and I. Notingher, J. Raman Spectrosc., 2011, 42, 251–258 CrossRef CAS.
- M. Okada, N. I. Smith, A. F. Palonpon, H. Endo, S. Kawata, M. Sodeoka and K. Fujita, Proc. Natl. Acad. Sci. U. S. A., 2012, 109, 28–32 CrossRef CAS PubMed.
- F. C. Pascut, S. Kalra, V. George, N. Welch, C. Denning and I. Notingher, Biochim. Biophys. Acta, 2013, 1830, 3517–3524 CrossRef CAS PubMed.
- C. P. Tarnowski, M. A. Ignelzi Jr and M. D. Morris, J. Bone Miner. Res., 2002, 17, 1118–1126 CrossRef PubMed.
- J. A. Timlin, A. Carden, M. D. Morris, R. M. Rajachar and D. H. Kohn, Anal. Chem., 2000, 72, 2229–2236 CrossRef CAS.
- J. E. Gough, I. Notingher and L. L. Hench, J. Biomed. Mater. Res., Part A, 2004, 68, 640–650 CAS.
- V. V. Pully, A. Lenferink, H. J. van Manen, V. Subramaniam, C. A. van Blitterswijk and C. Otto, Anal. Chem., 2010, 82, 1844–1850 CrossRef CAS PubMed.
- L. L. McManus, G. A. Burke, M. M. McCafferty, P. O'Hare, M. Modreanu, A. R. Boyd and B. J. Meenan, Analyst, 2011, 136, 2471–2481 RSC.
- E. Gentleman, R. J. Swain, N. D. Evans, S. Boonrungsiman, G. Jell, M. D. Ball, T. A. Shean, M. L. Oyen, A. Porter and M. M. Stevens, Nat. Mater., 2009, 8, 763–770 CrossRef CAS PubMed.
- L. L. McManus, F. Bonnier, G. A. Burke, B. J. Meenan, A. R. Boyd and H. J. Byrne, Analyst, 2012, 137, 1559–1569 RSC.
- A. T. Tu, Raman Spectroscopy in Biology: Principles and Applications, Wiley-Blackwell, 1982 Search PubMed.
- I. Notingher and L. L. Hench, Expert Rev. Med. Devices, 2006, 3, 215–234 CrossRef CAS PubMed.
- H. Rashidi, S. Strohbuecker, L. Jackson, S. Kalra, A. J. Blake, L. France, C. Tufarelli and V. Sottile, Cells Tissues Organs, 2012, 195, 484–494 CrossRef CAS PubMed.
- A. S. Posner, Physiol. Rev., 1969, 49, 760–792 CAS.
Footnote |
| † Electronic supplementary information (ESI) available. See DOI: 10.1039/c3an01716h |
| This journal is © The Royal Society of Chemistry 2014 |


