 Open Access Article
LED-based interferometric reflectance imaging sensor for the detection of amyloid-β aggregation†
Xin R.
Cheng
a,
George G.
Daaboul
b,
M. Selim
Ünlü
bcd and
Kagan
Kerman
*a
aDept. of Physical and Environmental Sciences, University of Toronto at Scarborough, 1265 Military Trail, Toronto, ON M1C 1A4, Canada. E-mail: kagan.kerman@utoronto.ca; Tel: +1-416-287-7250
bDept. of Biomedical Engineering, Boston University, 8 Saint Mary's Street, Boston, MA 02215, USA
cDept. of Electrical and Computer Engineering, Boston University, 8 Saint Mary's Street, Boston, MA 02215, USA
dFaculty of Engineering, Bahcesehir University, Istanbul, Turkey
First published on 16th October 2013
Abstract
Self-aggregation of amyloid-β (Aβ) plays an important role in the pathogenesis of Alzheimer's disease (AD). Small molecule inhibitors of Aβ fibril formation reduce the Aβ-mediated neurotocixity. In this report, the interaction of amyloid-β (Aβ) with well-described modulators, (−)epigallocatechin-3-gallate (EGCG) and Zn(II), was detected using a LED-based interferometric reflectance imaging sensor (LED-IRIS) in a high-throughput and real-time format. Nucleation-based fibril growth strategy was employed, as the “seeds” of Aβ were prepared in the presence of EGCG and Zn(II). The seeds were then covalently immobilized on the chip surface. Using microfluidics, Aβ oligomers were exposed onto the seeds resulting in the elongation of fibrils, which was detected as the increase in the spot height. Monitoring the changes on the chip surface enabled to detect the efficacy of modulators to inhibit or facilitate the growth of Aβ fibrils. The proof-of-concept study reported here introduces a novel platform to facilitate the screening of small molecules towards the discovery of promising AD therapeutics.
Introduction
Amyloid-β (Aβ) peptide is the major component of amyloid deposits and senile plaques of Alzheimer's disease (AD). AD is a complex neurodegenerative condition characterized by decline in cognitive ability, irreversible memory loss and impairment of judgment and reasoning.1 The neuropathological hallmarks of AD, other than the neurotransmitter depletion of acetylcholine, also include the deposition of two abnormal protein aggregates: intracellularly occurring neurofibrillary tangles composed of Tau protein2 and extracellular insoluble Aβ aggregates.3 The spontaneous conversion of oligomeric Aβ into fibrillar aggregates is associated with the development of AD.4 Numerous genetic, biochemical and transgenic animal tests supported the “amyloid hypothesis”.5–7 Currently, more than a hundred drugs are in clinical trials for AD treatment. These mainly consist of neuromodulatory signaling and Aβ-related therapies. Out of seven that went to Phase III trials, five of them were Aβ aggregation/clearance targeting drugs.8 It is therefore feasible to develop novel techniques to study the interaction of Aβ with small molecules in the attempt to facilitate drug discovery efforts.The molecular mechanism of Aβ aggregation has been extensively studied,9–11 but the exact pathway of misfolding and elongation is still somewhat unclear. It has been hypothesized that the formation of small protein oligomers, which act as nuclei or ‘seeds’, seems to be a crucial step in the aggregation pathway.12,13 This elongation is known as the nucleation-dependent polymerization model,14,15 which describes that initial unfavorable interactions between oligomers will result in a lag phase, in which stable oligomers are formed. These oligomers then provide nuclei to catalyze further growth of the amyloid, determining a growth phase until the equilibrium between aggregates and oligomers is reached (steady phase).
One strategy to identify promising candidates as amyloid inhibitors is the high-throughput screening of small chemical or natural compounds. Small molecules such as curcumin,16 rosmarinic acid17 and various polyphenols18 have been reported as promising compounds for the inhibition of Aβ aggregation. Among these small molecules, (−)-epigallocatechin-3-gallate (EGCG), which is the main polyphenol in green tea, has been reported to modulate the misfolding of prion proteins.19–22 In the presence of EGCG, the assembly of a new type of unstructured, non-toxic protein aggregate was observed, suggesting that it promoted the off-pathway oligomeric formation.23,24 EGCG was therefore, used in this report as a model inhibitor. On the other hand, metal ions such as Fe(III),25,26 Cu(II),27 Zn(II)28 and Al(III)29 were shown to generally accelerate the formation of amyloid plaques and reactive oxygen species. It has been found through several reports that Zn(II) could promote amyloid formation under certain conditions.30–32
A plethora of techniques have been used to study the aggregation of Aβ such as acoustic wave sensors,33 electrochemistry,34 atomic force microscopy,35 total internal reflection fluorescence microscopy,36 surface plasmon resonance (SPR),36,37etc. Flavonoids, alkaloids37 and metals,38,39 have also been studied using SPR for their effects on Aβ aggregation.40
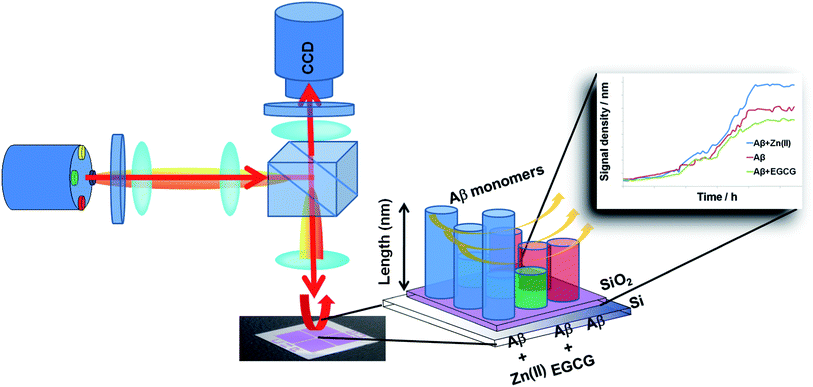
We applied the LED-Interferometric Reflectance Imaging Sensor (LED-IRIS) for the first time to study the interaction of Aβ with small drug candidates and metal ions (Scheme 1). The technique utilizes common-path interferometry through a Si/SiO2 layered substrate as the sensing surface to detect local path length changes as a result of mass accumulation with an increase in the spot height at the surface (Fig. S-1†).41 LED-IRIS is a versatile platform, which has been recently applied to detect single nucleotide polymorphisms, DNA hybridization, viral particles and antigen–antibody interactions.41–45 LED-IRIS provides a high-throughput platform to monitor biomolecular interactions with a low noise floor in real-time.46
Experimental section
Chemicals and reagents
Human amyloid-β peptide 1–40 Gln11 (Aβ; trifluoroacetate salt) <H-Asp-Ala-Glu-Phe-Arg-His-Asp-Ser-Gly-Tyr-Gln-Val-His-His-Gln-Lys-Leu-Val-Phe-Phe-Ala-Glu-Asp-Val-Gly-Ser-Asn-Lys-Gly-Ala-Ile-Ile-Gly-Leu-Met-Val-Gly-Gly-OH> was obtained from EMD Biosciences (Gibbstown, NJ). Dimethyl sulfoxide (DMSO; 99.99%), 1,1,1,3,3,3-Hexafluoro-2-propanol (HFIP, 99.0%), Thioflavin T (4-(3,6-dimethyl-1,3-benzothiazol-3-ium-2-yl)-N,N-dimethylaniline chloride; ∼75%), sodium phosphate monobasic (NaH2PO4; 99.0%) and sodium phosphate dibasic (Na2HPO4; 99.0%) were purchased from Sigma-Aldrich (Oakville, ON). Zinc(II) chloride, (−)epigallocatechin-3-gallate (EGCG) and ethanolamine were all obtained from Sigma-Aldrich Inc. (St. Louis, MO). LED-IRIS chips were prepared on 15 × 15 mm square silicon substrates with 500 nm thermally grown oxide that were purchased from Silicon Valley Microelectronics (Santa Clara, CA). All samples were prepared in phosphate buffer saline (PBS, 50 mM) with 100 mM NaCl at pH 7.4 using 18.2 MΩ Milli-Q water. Unless stated otherwise, all reagents were of HPLC quality and purchased from Sigma-Aldrich (Oakville, ON).Amyloid pre-treatment
Aβ1–40 was pre-treated by dissolving in HFIP at a ratio of 1 mg![[thin space (1/6-em)]](https://www.rsc.org/images/entities/char_2009.gif) :
:![[thin space (1/6-em)]](https://www.rsc.org/images/entities/char_2009.gif) 1 mL. Resulting suspensions were sonicated for 15 min until sample solutions became clear. Aβ/HFIP solutions were shaken at 400 rpm for 2 h at 4 ± 1 °C. The samples were then left in HFIP and sealed overnight. HFIP was then removed by passing a stream of nitrogen gas across solvent surface, leaving a clear thin film of peptides at the bottom of the sample vial. The thin film of peptides were re-constituted in DMSO and mixed by vortex, followed by dilution to the appropriate concentrations with 50 mM PBS with 100 mM NaCl, pH 7.4. Peptide concentrations were determined by measuring the OD at 280 nm using a NanoDrop 2000 (ε280 = 1280 M−1) from ThermoScientific (Mississauga, ON).
1 mL. Resulting suspensions were sonicated for 15 min until sample solutions became clear. Aβ/HFIP solutions were shaken at 400 rpm for 2 h at 4 ± 1 °C. The samples were then left in HFIP and sealed overnight. HFIP was then removed by passing a stream of nitrogen gas across solvent surface, leaving a clear thin film of peptides at the bottom of the sample vial. The thin film of peptides were re-constituted in DMSO and mixed by vortex, followed by dilution to the appropriate concentrations with 50 mM PBS with 100 mM NaCl, pH 7.4. Peptide concentrations were determined by measuring the OD at 280 nm using a NanoDrop 2000 (ε280 = 1280 M−1) from ThermoScientific (Mississauga, ON).
Surface functionalization
LED-IRIS chips were cleaned by washing extensively using acetone, methanol followed by deionized water prior to functionalization with a coating of N,N-dimethylacrylamide-acryloyloxysuccinimide-3(trimethoxysilyl)-propylmethacrylate polymer.47 The chips were first activated with 0.1 M NaOH before immersing in the polymer coating (1% w/v polymer in 20% saturated ammonium sulfate solution) for 30 min, then dried with argon before being baked for 15 min at 80 °C. The chips were then kept dry in a dessicator until use. The immobilization chemistry utilizes the N-hydroxysuccinimide (NHS) functional groups of the polymer reacting with primary amines on Aβ peptides to form covalent bonds.Real-time monitoring of Aβ aggregation
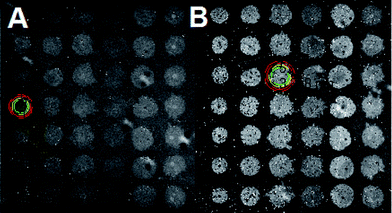
The pretreated Aβ peptides were incubated under different conditions at 37 °C for 3 h with 300 rpm shaking. The varying conditions included incubating Aβ with Zn(II), Aβ with EGCG and Aβ alone. After incubation, the fibrils were formed in different morphologies. These solutions were sonicated for 5 min to obtain seeds.48 The NHS-functionalized chips were used directly and the seeds were dispensed by using a desktop spotting unit at 55% chamber humidity (Odyssey Calligrapher microarrayer, BioRad). An aliquot (∼0.1 μL) of seed solution was dispensed on the LED-IRIS chip in an array format containing 42 spots (Fig. 1). To allow complete immobilization of seeds, the chip was incubated at 37 °C in a custom made 75% humidity chamber overnight. The LED-IRIS chips were then incubated in 50 mM ethanolamine adjusted to pH 7.4 with shaking for 30 min to deactivate any unreacted NHS groups on the surface. The chips were then washed extensively with PBS-Tween and rinsed briefly with water to remove salts. The chips were then dried under an argon stream.To measure the amyloid growth, each chip was secured in a custom-made flow-cell sealed with a glass window that enabled the optical measurements. Solutions were driven through the flow-cell by using a peristaltic pump at a rate of 100 μL min−1. PBS was initially flowed through the system to clean and condition the associated tubing and the flow-cell for 30 min. This process also removed any weakly bound seeds before any tests were performed. Aβ oligomer solution (5 μM) was then introduced over the seed spots for ∼5 h. The chip surface was scanned and monitored continuously during the flow of oligomers. All flow-cell experiments were performed at 37 °C, which was controlled by a mini-handheld thermo-coupler (Thermoworks, UT) that was in contact with the metallic flow cell. Each spot in the images was then analyzed using the custom-made software to obtain the optical thickness information (see ESI†). The changes in spot height at each spot was compared to the background by averaging optical thickness information for each pixel within a spot and an annulus outside of the spot and making a direct comparison between those two regions (Fig. S-2†). The analysis of fibril formation was performed by subtracting post and pre-incubation images. The accumulation of Aβ fibrils was detected as a change in optical path length at those spots indicating an increase of surface thickness. To find the relative change in the spot height, the following formula was used:
Cross-seeding study
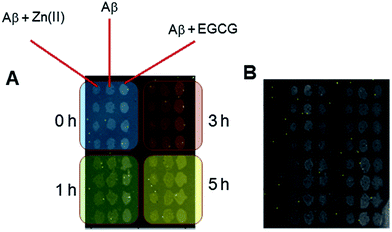
A cross-seeding study was performed to determine, if fibril accumulation was affected by various oligomer seeding conditions. Aβ (50 μM) was incubated in the presence and absence of modulators (100 μM Zn(II) or EGCG) for 0, 1, 3 or 5 h to produce the seeds. The seeds were spotted on three LED-IRIS chips using an identical array setup, and left overnight in a humidity chamber as described before. The chips were then deactivated and washed with PBS buffer. Aβ (5 μM) oligomers in the presence and absence of modulators (10 μM of Zn(II) and EGCG) were then introduced to their corresponding chip surfaces. Modified chips were incubated with shaking in a small Petri-dish. PBS-Tween was used to rinse the surface twice to remove the non-specifically bound species before a subsequent water rinse to remove salt debris on surfaces. Then, the measurements were performed using the LED-IRIS system as described in the previous section.Scanning electron microscopy (SEM)
SEM of Aβ samples on LED-IRIS chip surfaces was performed using a Hitachi S530 scanning electron microscope (Fig. S-3†). Aβ samples (100 μM) were incubated at 37 °C with 300 rpm shaking in the presence and absence of EGCG (200 μM) or Zn(II) (200 μM). After 3 h of incubation, samples were exposed to the LED-IRIS chips. The spots were left to sit overnight to ensure immobilization before rinsing with PBS-Tween and then water as described before. Aβ (10 μM) oligomer solution was then incubated on each chip for 16 h before washing with PBS-Tween followed by a quick water rinse. The chips were dried under a stream of nitrogen gas. All LED-IRIS chips were sputtered with Au using the SEM coating unit PS3 (Agar Scientific) at 19 mA plasma current for 100 s. The chips were then electrically connected to the sample stub by smearing graphite paste dissolved in acetone from the sample to the metallic stub. The surfaces of the chips were imaged at an acceleration voltage of 20 kV with a working distance of 5.0 mm.Results and discussion
Label-free monitoring of amyloid growth
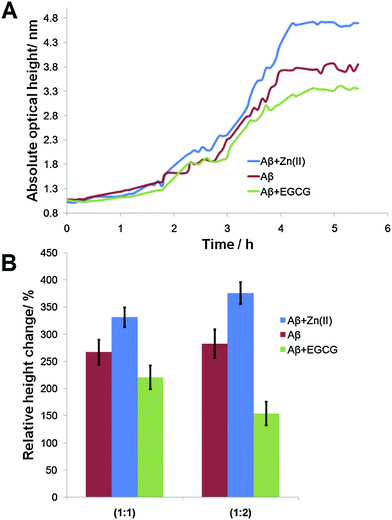
Aβ incubated under different conditions resulted in the formation of seeds with varying morphologies. The seeds were then immobilized onto the LED-IRIS chips. The presence of preformed seeds significantly shortened the lag phase for fibril growth.49 When the oligomers were flowed across these spots at a rate of 100 μL s−1, they were captured by the immobilized seeds, increasing the spot height. Fig. 2A shows the average response of various seed spots after oligomers were exposed to them. The increase in the signal (optical path length) indicated the rate of fibril growth over time (∼5 h). A classical sigmoidal curve was observed for the amyloid aggregation process (Fig. 2A). The lag phase, however, was shortened to ∼1 h due to the presence of seeds. This was significant, compared to the 40 h lag phase of amyloid growth, typically observed in solution based fluorescence studies using Thioflavin T as reported previously.40 This was attributed to the fibril formation being a nucleation-dependent process.50 Therefore, the presence of immobilized seeds accelerated the fibril growth to a great extent.
Fig. 2B shows that the signals (relative height change) for equimolar concentrations (1![[thin space (1/6-em)]](https://www.rsc.org/images/entities/char_2009.gif) :
:![[thin space (1/6-em)]](https://www.rsc.org/images/entities/char_2009.gif) 1) of 100 μM Aβ with 100 μM Zn(II) and EGCG were 331 ± 18% and 221 ± 21%, respectively. Aβ alone displayed a signal of 267 ± 23%. The data showed that the seeds formed in the presence of Zn(II) resulted in a significantly more fibril growth. This was due to the acceleration effect of Zn(II) in amyloid formation that resulted in compact seeds being immobilized on the chip surface compared to Aβ alone. When EGCG was incubated with Aβ before immobilization, the lowest signal was obtained after the flow of oligomers. This result was attributed to the interaction of EGCG with Aβ, which inhibited its aggregation with oligomers. The effects of modulators could be observed from the signal changes at the spots in real-time. To determine if this effect was concentration-dependent, high concentrations (200 μM) of Zn(II) and EGCG were used during seed incubation. Aβ (200 μM) alone was also used in this study as the positive control. Fig. 2B shows that an increase in Aβ concentration alone (red) did not significantly change the signal (283 ± 27%) after the flow of oligomers. However, when the modulator concentrations were doubled, the signal of Zn(II)-modulated growth increased significantly (376 ± 20%), while that of EGCG decreased (154 ± 21%) (Fig. S-4†). It is also noteworthy that the entire signals recorded using modulator concentrations group were more statistically significant relative to each other. Therefore, the high concentration ratio was used throughout the subsequent experiments.
1) of 100 μM Aβ with 100 μM Zn(II) and EGCG were 331 ± 18% and 221 ± 21%, respectively. Aβ alone displayed a signal of 267 ± 23%. The data showed that the seeds formed in the presence of Zn(II) resulted in a significantly more fibril growth. This was due to the acceleration effect of Zn(II) in amyloid formation that resulted in compact seeds being immobilized on the chip surface compared to Aβ alone. When EGCG was incubated with Aβ before immobilization, the lowest signal was obtained after the flow of oligomers. This result was attributed to the interaction of EGCG with Aβ, which inhibited its aggregation with oligomers. The effects of modulators could be observed from the signal changes at the spots in real-time. To determine if this effect was concentration-dependent, high concentrations (200 μM) of Zn(II) and EGCG were used during seed incubation. Aβ (200 μM) alone was also used in this study as the positive control. Fig. 2B shows that an increase in Aβ concentration alone (red) did not significantly change the signal (283 ± 27%) after the flow of oligomers. However, when the modulator concentrations were doubled, the signal of Zn(II)-modulated growth increased significantly (376 ± 20%), while that of EGCG decreased (154 ± 21%) (Fig. S-4†). It is also noteworthy that the entire signals recorded using modulator concentrations group were more statistically significant relative to each other. Therefore, the high concentration ratio was used throughout the subsequent experiments.
Effect of cross-seeding
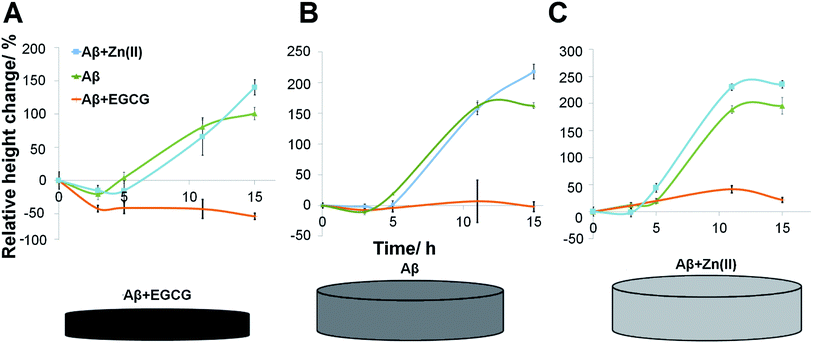
To determine if the amyloid growth under different seed conditions was affected by different oligomer and modulator conditions, a cross-seeding experiment was performed, where the signals of the spots were monitored intermittently over ∼15 h (Fig. 3). In this case, varying oligomeric conditions were used, as well. As shown in Fig. S-5,† the Aβ oligomers with Zn(II) displayed the highest signal followed by Aβ oligomers alone and the lowest signals were obtained from the seeds prepared in the presence of EGCG.The results implied that the growth of fibrils was significantly accelerated at Zn(II)-containing seed spots. Negligible fibril growth was detected at EGCG-containing seed spots. This was consistent with previous literature,23 which suggested that amorphous aggregates formed in the presence of EGCG inhibited the aggregation and caused no cytotoxicity, because they were off-pathway aggregarates.48Fig. 4 shows the representative changes in signals under various conditions, and it was observed that different conditions exhibited significant effects on the rate of Aβ aggregation.
It was observed that EGCG inhibited the formation of Aβ fibrils both in the presence and absence of Zn(II) in seeds (Fig. 4A). This was attributed to the weakening of the cross-β structure by the interaction of EGCG with the β-sheets of fibrils.51 Interesting to note, the signal decrease was significant, when Aβ with EGCG were exposed to the EGCG-containing seed spots. This implied that the seeds prepared in the presence of EGCG had lower stability compared to other seed conditions, leading to disintegration from chip surface. This was in agreement with the recent literature, where EGCG was shown to break down amyloids into non-toxic off-pathway aggregates.52–54
When the Aβ oligomer incubation contained Zn(II), elongation seemed to persist for the seeds formed in the presence of EGCG (although at a significantly lower response level compared to other seed conditions) as shown in Fig. 4C. It was proposed by Miller and coworkers55 that two Zn(II) ions coordinated with residues of two different Aβ peptides, facilitating the elongation of fibrils. Zn(II) binding also decreased the solvation energy for tightly packed oligomers, which stimulated amyloid aggregation.56 The accelerated formation of amyloids induced by Zn(II) was observed in previous studies.57,58 It was also reported that Zn(II) physically bound to Aβ peptides by coordinating with histidine residues as confirmed by NMR studies.59,60 In parallel to these previous reports, the addition of Aβ oligomers in the presence of EGCG to the Zn(II)-bound seeds resulted in a slow increase in fibril height, demonstrating that the Zn(II)-containing seeds were not easily disintegrated (Fig. 4C).
Conclusions
The experiments detailed here indicate that the LED-IRIS platform is a promising platform for high-throughput and real-time detection of protein-small molecule interactions. The high-throughput capability of LED-IRIS is suitable for the screening of novel Aβ aggregation modulators that would significantly accelerate the drug discovery efforts towards AD therapy.Acknowledgements
XRC and KK gratefully acknowledge the financial support from the Alzheimer Society of Canada and NSERC Discovery Grant. GGD and MSU gratefully acknowledge the financial support from the Center for Integration of Medicine and Innovative Technology (CIMIT) in Boston University.Notes and references
- Z. S. Khachaturian, Arch. Neurol., 1985, 42, 1097–1105 CrossRef CAS.
- C.-X. Gong, I. Grundke-Iqbal and K. Iqbal, Drugs Aging, 2010, 27, 351–365 CAS.
- M. P. Murphy and I. I. I. H. LeVine, J. Alzheimers Dis., 2010, 19, 311–323 Search PubMed.
- S. S. Sisodia and D. L. Price, FASEB J., 1995, 9, 366–370 CAS.
- D. Games, D. Adams, R. Alessandrini, R. Barbour, P. Borthelette, C. Blackwell, T. Carr, J. Clemens, T. Donaldson, F. Gillespie, T. Guido, S. Hagopian, K. Johnson-Wood, K. Khan, M. Lee, P. Leibowitz, I. Lieberburg, S. Little, E. Masliah, L. McConlogue, M. Montoya-Zavala, L. Mucke, L. Paganini, E. Penniman, M. Power, D. Schenk, P. Seubert, B. Snyder, F. Soriano, H. Tan, J. Vitale, S. Wadsworth, B. Wolozin and J. Zhao, Nature, 1995, 373, 523–527 CrossRef CAS PubMed.
- K. Hsiao, P. Chapman, S. Nilsen, C. Eckman, Y. Harigaya, S. Younkin, F. Yang and G. Cole, Science, 1996, 274, 99–102 CrossRef CAS.
- L. Holcomb, M. N. Gordon, E. McGowan, X. Yu, S. Benkovic, P. Jantzen, K. Wright, I. Saad, R. Mueller, D. Morgan, S. Sanders, C. Zehr, K. O'Campo, J. Hardy, C.-M. Prada, C. Eckman, S. Younkin, K. Hsiao and K. Duff, Nat. Med., 1998, 4, 97–100 CrossRef CAS PubMed.
- Z. Gerald and W. Ockert, Nat. Rev. Drug Discovery, 2013, 12, 19–20 CrossRef CAS PubMed.
- R. P. Friedrich, K. Tepper, R. Rönicke, M. Soom, M. Westermann, K. Reymann, C. Kaether and M. Fändrich, Proc. Natl. Acad. Sci. U. S. A., 2010, 107, 1942–1947 CrossRef CAS PubMed.
- B. Caughey and P. T. Lansbury, Annu. Rev. Neurosci., 2003, 26, 267–298 CrossRef CAS PubMed.
- C. Soto, Nat. Rev. Neurosci., 2003, 4, 49–60 CrossRef CAS PubMed.
- E. Hellstrand, B. Boland, D. M. Walsh and S. Linse, ACS Chem. Neurosci., 2009, 1, 13–18 CrossRef PubMed.
- P. Hortschansky, V. Schroeckh, T. Christopeit, G. Zandomeneghi and M. Fändrich, Protein Sci., 2005, 14, 1753–1759 CrossRef CAS PubMed.
- J. D. Harper and P. T. Lansbury, Annu. Rev. Biochem., 1997, 66, 385–407 CrossRef CAS PubMed.
- D. C. Gajdusek, Ann. N. Y. Acad. Sci., 1994, 724, 173–190 CrossRef CAS.
- F. S. Yang, G. P. Lim, A. N. Begum, O. J. Ubeda, M. R. Simmons, S. S. Ambegaokar, P. P. Chen, R. Kayed, C. G. Glabe, S. A. Frautschy and G. M. Cole, J. Biol. Chem., 2005, 280, 5892–5901 CrossRef CAS PubMed.
- K. Ono, K. Hasegawa, H. Naiki and M. Yamada, Biochim. Biophys. Acta, 2004, 1690, 193–202 CrossRef CAS PubMed.
- K. Ono, Y. Yoshiike, A. Takashima, K. Hasegawa, H. Naiki and M. Yamada, J. Neurochem., 2003, 87, 172–181 CrossRef CAS.
- D. E. Ehrnhoefer, M. Duennwald, P. Markovic, J. L. Wacker, S. Engemann, M. Roark, J. Legleiter, J. L. Marsh, L. M. Thompson, S. Lindquist, P. J. Muchowski and E. E. Wanker, Hum. Mol. Genet., 2006, 15, 2743–2751 CrossRef CAS PubMed.
- J. Bieschke, Neurotherapeutics, 2013, 10, 429–439 CrossRef CAS PubMed.
- I. Hauber, H. Hohenberg, B. Holstermann, W. Hunstein and J. Hauber, Proc. Natl. Acad. Sci. U. S. A., 2009, 106, 9033–9038 CrossRef CAS PubMed.
- B. E. Roberts, M. L. Duennwald, H. Wang, C. Chung, N. P. Lopreiato, E. A. Sweeny, M. N. Knight and J. Shorter, Nat. Chem. Biol., 2009, 5, 936–946 CrossRef CAS PubMed.
- D. E. Ehrnhoefer, J. Bieschke, A. Boeddrich, M. Herbst, L. Masino, R. Lurz, S. Engemann, A. Pastore and E. E. Wanker, Nat. Struct. Mol. Biol., 2008, 15, 558–566 CAS.
- X. Meng, L. A. Munishkina, A. L. Fink and V. N. Uversky, Biochemistry, 2009, 48, 8206–8224 CrossRef CAS PubMed.
- S. D. Mesquita, A. C. Ferreira, J. C. Sousa, N. C. Santos, M. Correia-Neves, N. Sousa, J. A. Palha and F. Marques, Front. Cell. Neurosci., 2012, 6, 25 CrossRef CAS PubMed.
- L. Mascitelli, F. Pezzetta and M. Goldstein, Cell. Mol. Life Sci., 2009, 66, 2943 CrossRef CAS PubMed.
- P. Faller, Free Radical Biol. Med., 2012, 52, 747–748 CrossRef CAS PubMed.
- D. J. Bonda, H.-g. Lee, J. A. Blair, X. Zhu, G. Perry and M. A. Smith, Metallomics, 2011, 3, 267–270 RSC.
- Z. Wu, Y. Du, H. Xue, Y. Wu and B. Zhou, Neurobiol. Aging, 2012, 33, 199 Search PubMed.
- M. A. Lovell, J. D. Robertson, W. J. Teesdale, J. L. Campbell and W. R. Markesbery, J. Neurol. Sci., 1998, 158, 47–52 CrossRef CAS.
- V. Minicozzi, F. Stellato, M. Comai, M. D. Serra, C. Potrich, W. Meyer-Klaucke and S. Morante, J. Biol. Chem., 2008, 283, 10784–10792 CrossRef CAS PubMed.
- C. Talmard, R. Leuma Yona and P. Faller, J. Biol. Inorg. Chem., 2009, 14, 449–455 CrossRef CAS PubMed.
- X. R. Cheng, V. W. Sze Hung, S. Scarano, M. Mascini, M. Minunni and K. Kerman, Anal. Methods, 2012, 4, 2228–2232 RSC.
- A. J. Veloso, V. W. S. Hung, X. R. Cheng and K. Kerman, Electroanalysis, 2012, 24, 1847–1851 CrossRef CAS.
- K. Hasegawa, K. Ono, M. Yamada and H. Naiki, Biochemistry, 2002, 41, 13489–13498 CrossRef CAS PubMed.
- T. Ban and Y. Goto, in Methods Enzymol, ed. K. Indu and W. Ronald, Academic Press, 2006, vol. 413, pp. 91–102 Search PubMed.
- B. E. Kraziński, J. Radecki and H. Radecka, Sensors, 2011, 11, 4030–4042 CrossRef PubMed.
- J. Ryu, H.-A. Joung, M.-G. Kim and C. B. Park, Anal. Chem., 2008, 80, 2400–2407 CrossRef CAS PubMed.
- F. Yao, J. He, X. Li, H. Zou and Z. Yuan, Sens. Actuators, B, 2012, 161, 886–891 CrossRef CAS PubMed.
- X. R. Cheng, B. Y. H. Hau, A. J. Veloso, S. Martic, H.-B. Kraatz and K. Kerman, Anal. Chem., 2012, 85, 2049–2055 CrossRef PubMed.
- E. Özkumur, J. W. Needham, D. A. Bergstein, R. Gonzalez, M. Cabodi, J. M. Gershoni, B. B. Goldberg and M. S. Ünlü, Proc. Natl. Acad. Sci. U. S. A., 2008, 105, 7988–7992 CrossRef PubMed.
- S. Ahn, C.-L. Huang, E. Ozkumur, X. Zhang, J. Chinnala, A. Yalcin, S. Bandyopadhyay, S. J. Russek, M. S. Ünlü, C. DeLisi and R. J. Irani, Biophys. J., 2012, 103, 1510–1517 CrossRef CAS PubMed.
- C. A. Lopez, G. G. Daaboul, R. S. Vedula, E. Özkumur, D. A. Bergstein, T. W. Geisbert, H. E. Fawcett, B. B. Goldberg, J. H. Connor and M. S. Ünlü, Biosens. Bioelectron., 2011, 26, 3432–3437 CrossRef CAS PubMed.
- E. Özkumur, A. Yalçın, M. Cretich, C. A. Lopez, D. A. Bergstein, B. B. Goldberg, M. Chiari and M. S. Ünlü, Biosens. Bioelectron., 2009, 25, 167–172 CrossRef PubMed.
- E. Özkumur, S. Ahn, A. Yalçın, C. A. Lopez, E. Çevik, R. J. Irani, C. DeLisi, M. Chiari and M. Selim Ünlü, Biosens. Bioelectron., 2010, 25, 1789–1795 CrossRef PubMed.
- G. G. Daaboul, R. S. Vedula, S. Ahn, C. A. Lopez, A. Reddington, E. Ozkumur and M. S. Ünlü, Biosens. Bioelectron., 2011, 26, 2221–2227 CrossRef CAS PubMed.
- M. Cretich, G. Pirri, F. Damin, I. Solinas and M. Chiari, Anal. Biochem., 2004, 332, 67–74 CrossRef CAS PubMed.
- M. J. Cannon, A. D. Williams, R. Wetzel and D. G. Myszka, Anal. Biochem., 2004, 328, 67–75 CrossRef CAS PubMed.
- J. T. Jarrett and P. T. Lansbury Jr, Cell, 1993, 73, 1055–1058 CrossRef CAS.
- Y. Yoshimura, Y. Lin, H. Yagi, Y.-H. Lee, H. Kitayama, K. Sakurai, M. So, H. Ogi, H. Naiki and Y. Goto, Proc. Natl. Acad. Sci. U. S. A., 2012, 109, 14446–14451 CrossRef CAS PubMed.
- J. Bieschke, J. Russ, R. P. Friedrich, D. E. Ehrnhoefer, H. Wobst, K. Neugebauer and E. E. Wanker, Proc. Natl. Acad. Sci. U. S. A., 2010, 107, 7710–7715 CrossRef CAS PubMed.
- J. Bieschke, M. Herbst, T. Wiglenda, R. P. Friedrich, A. Boeddrich, F. Schile, D. Kleckers, J. M. Lopez del Amo, B. A. Gruning, Q. Wang, M. R. Schmidt, R. Lurz, R. Anwyl, S. Schnoegl, M. Fandrich, R. F. Frank, B. Reif, S. Gunther, D. M. Walsh and E. E. Wanker, Nat. Chem. Biol., 2011, 8, 93–101 CrossRef PubMed.
- J. M. Lopez del Amo, U. Fink, M. Dasari, G. Grelle, E. E. Wanker, J. Bieschke and B. Reif, J. Mol. Biol., 2012, 421, 517–524 CrossRef CAS PubMed.
- S.-J. Hung, A. S. DeToma, J. R. Brender, S. Lee, S. Vivekanandan, A. Kochi, J.-S. Choi, A. Ramamoorthy, B. T. Ruotolo and M. H. Lim, Proc. Natl. Acad. Sci. U. S. A., 2013, 110, 3743–3748 CrossRef PubMed.
- Y. Miller, B. Ma and R. Nussinov, Proc. Natl. Acad. Sci. U. S. A., 2010, 107, 9490–9495 CrossRef CAS PubMed.
- T. Miura, K. Suzuki, N. Kohata and H. Takeuchi, Biochemistry, 2000, 39, 7024–7031 CrossRef CAS PubMed.
- A. I. Bush, W. H. Pettingell, G. Multhaup, M. d. Paradis, J.-P. Vonsattel, J. F. Gusella, K. Beyreuther, C. L. Masters and R. E. Tanzi, Science, 1994, 265, 1464–1467 CAS.
- K. H. Lim, Y. K. Kim and Y.-T. Chang, Biochemistry, 2007, 46, 13523–13532 CrossRef CAS PubMed.
- Y. Mekmouche, Y. Coppel, K. Hochgräfe, L. Guilloreau, C. Talmard, H. Mazarguil and P. Faller, Chem. Biochem., 2005, 6, 1663–1671 CrossRef CAS PubMed.
- C. D. Syme and J. H. Viles, Biochim. Biophys. Acta, 2006, 1764, 246–256 CrossRef CAS PubMed.
Footnote |
| † Electronic supplementary information (ESI) available: Scanning electron microscopy images and cross-seeding experimental data. See DOI: 10.1039/c3an01307c |
| This journal is © The Royal Society of Chemistry 2014 |

