Quantitative dielectrophoretic tracking for characterization and separation of persistent subpopulations of Cryptosporidium parvum†
Yi-Hsuan
Su
a,
Mikiyas
Tsegaye
a,
Walter
Varhue
a,
Kuo-Tang
Liao
a,
Lydia S.
Abebe
b,
James A.
Smith
b,
Richard L.
Guerrant
c and
Nathan S.
Swami
*a
aDepartment of Electrical & Computer Engineering, University of Virginia, Charlottesville, VA 22904, USA. E-mail: nswami@virginia.edu
bDepartment of Civil & Environmental Engineering, University of Virginia, Charlottesville, VA 22904, USA
cInfectious Diseases, School of Medicine, University of Virginia, Charlottesville, VA 22904, USA
First published on 5th November 2013
Abstract
Microbial persistence to antibiotics is attributed to subpopulations with phenotypic variations that cause a spread of susceptibility levels, leading to the recurrence of infections and stability of biofilms. Herein, persistent oocyst subpopulations identified by animal infectivity and excystation assays during the disinfection of Cryptosporidium parvum, a water-borne pathogen capable of causing enteric infections at ultra-low doses, are separated and characterized by quantitative dielectrophoretic tracking over a wide frequency range (10 kHz–10 MHz). To enable the simultaneous and facile dielectrophoretic tracking of individual oocysts, insulator constrictions in a microfluidic channel are utilized to spatially modulate the localized field over the extent needed for defining oocyst trajectories and for obtaining high-resolution displacement versus time measurements under both, positive and negative dielectrophoresis. In this manner, by obviating the need for averaging dielectrophoretic data over a large collection region, the force response is more sensitive to differences in electrophysiology from sub-population fractions. Hence, the electrophysiology of sensitive and persistent oocysts after heat and silver nanoparticle treatments can be quantified by correlating the force response at low frequencies (<100 kHz) to the integrity of the oocyst wall and at high frequencies (0.4–1 MHz) to the sporozoites in the oocyst. This label-free method can characterize heterogeneous microbial samples with subpopulations of phenotypically different alterations, for quantifying the intensity of alteration and fraction with a particular alteration type.
1 Introduction
Micro-organism samples are usually spread over developmental lifecycles and subpopulations, leading to their persistence due to altered levels of susceptibility to antibiotics.1,2 The sensitive quantification of these heterogeneous modifications is a major challenge, especially for subpopulations with phenotypic rather than genotypic variations and for organisms that cannot be enriched in vitro by microbial culture methods.3 The case of Cryptosporidium parvum, an oocyst forming protozoan parasite species (henceforth called C. parvum oocysts) illustrates this problem.4,5 Ingestion of C. parvum oocysts, which are not deactivated by the standard chlorine treatments,6 leads to Cryptosporidiosis,7 which is estimated to be responsible for about 50% of the waterborne diseases attributed to parasites worldwide.8 On one hand, there is a need to sensitively quantify alterations to the oocyst by disinfectants, since as few as ten viable oocysts of the ∼billion oocysts shed by a host during an infection episode,9 are sufficient to cause a new infection.9,10 On the other hand, the heterogeneous nature of the alterations during disinfection, due to subpopulations in the sample, leads to substantial variations in oocyst viability.11 Hence, a relatively high concentration of ∼106 oocysts per mL is required within in vivo infectivity tests on animal models to enable quantitative assessments on modifications to oocyst viability.12 Additionally, the lack of means to proliferate the oocysts limits the sensitivity of in vitro monitoring methods, since C. parvum oocysts typically only excyst and complete their lifecycle in the mammalian gastrointestinal tract. Biomolecular assessment of viability based on hsp70 mRNA levels is highly sensitive,13 but unsuitable for real-time monitoring during disinfection or in cases where subsequent analysis is needed on the oocysts. Hence, there is a need to separate and enrich oocysts with particular alterations for quantification of each subpopulation.Dielectrophoresis (DEP) causes frequency-selective translation of polarized bio-particles in a non-uniform field, either towards or away from high field regions within a device, depending on the polarizability of the bio-particle versus that of the medium.14,15 Some of the distinguishing features of DEP include:16 (a) its highly sensitive, label-free and non-destructive characterization methodology that is dependent only on the inherent dielectric properties of single bio-particles; (b) its ability to probe different dielectric regions of the bio-particle, such as its non-conducting shell versus its conducting core, based on appropriate choice of frequency of the field; and: (c) its ability to separate and enrich particular bio-particles of interest versus others in the media, due to its frequency-selectivity. Hence, DEP is widely investigated for sample enrichment and sensing of tumor cells,17,18 micro-organisms,19 viruses,20 nucleic acids,21 proteins,22 and for drug screening.23 While the need for microfluidic systems to enhance DEP trapping forces24,25 has limited its suitability for high throughput applications (>1 mL), it is well suited for probing subtle distinctions in micro-organisms26,27 after their immuno-magnetic separation from large water systems. Dielectrophoretic28,29 and electro-rotation techniques30,31 have been applied previously to investigate modifications to the oocyst wall of C. parvum after heat treatment. However, no prior work has quantitatively correlated the DEP behavior to the modifications in structure and infectivity of sporozoites in the oocyst. This is necessary for the separation of oocysts based on sporozoite structure to discern the effectiveness of disinfectants, since infections are caused by the release of sporozoites from the oocyst. Silver nanoparticles (AgNP) show an enhanced antimicrobial effect over silver salts,32,33 and have been widely investigated for water disinfection applications.34–37
Quantitative DEP characterization of cell electrophysiology can be accomplished through methods such as, measuring the DEP collection rate,38,39 determining the DEP crossover frequency of cells,40–43 measuring the DEP levitation height of cells44 or through actively tracking the translation of cells under DEP.45 However, a limitation within all these techniques is the lack of means to define the trajectory of the cells under DEP behavior, especially under negative DEP. Hence, the data needs to be averaged over a large number of cells that are trapped over an ill-defined region of the device, thereby making them less sensitive to variations from small fractions of persistent subpopulations, such as: 10−5–10−6 of the total population for E coli, that is phenotypically distinct and resistant to antibiotics.46 Herein, we utilize insulator constrictions within a microfluidic device to localize the field symmetrically across the device depth and modulate the lateral field gradient over a specified spatial extent, thereby defining the trajectory of microbial cells under both, positive and negative DEP behavior. This enables the simultaneous and facile dielectrophoretic tracking of individual C. parvum oocysts during positive and negative DEP over a wide frequency range (10 kHz–10 MHz). As a result, the electrophysiology of sensitive and persistent subpopulations can be quantified in parallel, by identifying a frequency for their separation based on the magnitude and direction of the DEP trapping force. In this manner, the intensity of alteration of a subpopulation can be monitored by correlating the DEP tracking data to the integrity of their oocyst wall and sporozoites in the oocyst, while the fraction of oocysts with a particular alteration can be quantified by DEP collection data.
2 Materials and methods
Preparation of Cryptosporidium parvum oocysts
Cryptosporidium parvum oocysts were purchased from Waterborne Inc. and stored at 4 °C, until use. All the oocysts from a particular batch were used within a month, since oocysts undergo significant de-activation over time. The media conductivity (σm) of oocyst stock (109/50 mL in phosphate-buffered saline) was lowered to 2 mS m−1, by centrifuging the oocysts (Eppendorf 5430), aspirating the supernatant and re-suspending the oocysts in DI water by vortexing to prevent aggregation or sedimentation.Disinfection treatments on oocysts
For heat treatment, the oocysts were placed in a dry block/shaker (Thermomixer, Eppendorf) at 90 °C for 10 minutes with 300 rpm shaking to allow homogenous heat distribution. An alternate treatment at 70 °C for 5 minutes, which is the minimal level required for a loss of infectivity within the mouse model,47 was also studied for isolating persistent subpopulations with less intense modifications to the oocyst. For treatment with silver nanoparticles (AgNPs), the animal infectivity experiment was done after the oocysts were treated with 100 mg L−1 proteinate capped AgNPs (Argenol) (∼15 nm) for 4 hours. While disinfection treatments were carried out over a 4 hours period, continuous DEP monitoring was used to confirm that steady state levels of oocyst deactivation were reached within 20 minutes for each treatment. For silver nitrate (AgNO3) (Fisher Scientific) treatment, oocysts were treated with 100 mg L−1 AgNO3 for 4 hours.Fluorescence monitoring of oocysts
4′,6-diamidino-2-phenylindole (DAPI) and propidium iodide (PI) were prepared in DI water to a stock concentration of 1 mg mL−1 by standard methods. The suspension of oocysts from each treatment was placed for 45 minutes in diluted DAPI (final concentration: 2 μg mL−1) and then for 15 minutes in diluted PI (final concentration: 0.2 μg mL−1). After an hour treatment with the fluorescent dyes, the oocysts were centrifuged, aspirated and re-suspended in DI water by vortexing to prevent any aggregation and sedimentation. The wash steps were repeated twice to eliminate the background signal. Images were acquired using a Zeiss Observer Z1 microscope with a 63× oil immersion objective lens under bright field view for phase and Differential Interference Contrast (DIC) images, and fluorescent view for DAPI and PI images.Excystation of oocysts and mouse model infectivity studies
After each disinfection treatment, the oocysts were treated with 10% bleach (Bleach-Rite) for 30 minutes in a micro-centrifuge tube at room temperature, followed by vortexing every 10 minutes. The suspension was incubated in a microfluidic chamber with a glass cover-slip for an hour, for real-time recording of the excystation; i.e. release of sporozoites from the oocyst. The excystation was examined by inverted microscopy using 63× oil immersion phase and DIC objectives. At least ten different fields of view were taken (Hammatsu Orca Flash4) and results from at least 300 oocysts were used to calculate the net ex-cystation rate for each treatment. The percentage of the excystation was calculated as: (# of excysted oocyts/# of total oocyst) × 100.29 For mouse model infectivity studies,12 all mice were malnourished for a period of 13 days before experiments. For every six mice fed with the oocysts for each treatment, three other mice were fed with untreated oocysts as positive control. RT-PCR analysis was performed on stool shed from mice from the day after inoculation to day 7, post-infection.Dielectrophoretic characterization of oocysts
The schematic set-up utilized for the DEP studies on the oocysts is shown in Fig. 1. Standard PDMS (poly-di-methyl-siloxane) micro-molding methods were used to microfabricate a channel of ∼1 cm length and 15 μm depth, with several sharp lateral constrictions from 1500 μm to 15 μm and back to 1500 μm over a total extent of ∼200 μm length (Fig. 1b). This so-called “constriction chip” was bonded using a 1 minute oxygen plasma treatment to a glass coverslip for easy microscopic viewing of DEP behavior (Fig. 1a). After filling the micro-channel with the oocyst sample, Pt electrodes (Alfa Aesar) were inserted and sealed within the “inlet” and “outlet” to activate the electric field. AC fields were applied using a function generator (Agilent 33220 A) and a voltage amplifier (FLC) for fields of ∼300 Vpp cm−1 at a frequency range of 1 kHz to 15 MHz. Under conditions for positive DEP (PDEP), the oocysts were translated towards the constriction tip (Fig. 1c) and under negative DEP (NDEP) they were translated away from the constriction tip (Fig. 1d). For spherical particles of radius: a, in a medium of permittivity: εm, the DEP force (FDEP) under an rms field: Erms, depends on product of the localized field with its gradient (∇E2) and the frequency-dependent complex dielectric contrast of the particle versus the medium, as given by real-part of the Claussius–Mossoti factor (KCM): | (1) |
Here, ε*, denotes the complex permittivity, and subscripts p and m, denote the respective property of the particle and medium, respectively. The frequency (ω) dependent permittivity (ε) is related to conductivity (σ) as: ε* = ε + (σ/jω). Hence, at low frequencies (<1 MHz), the respective σ terms dominate, whereas at high frequencies (>1 MHz), the respective ε terms begin to play a significant role on the DEP response. Specifically, at low frequencies (<1 MHz):
 | (2) |
F DEP values were calculated by standard particle tracking methodologies14 to monitor the displacement (x) of the oocysts over time (t) under NDEP or PDEP, based on data from high frame per second (∼30 fps) movies. In this manner, the velocity (dx/dt) and acceleration (d2x/dt2) of the oocysts could be continuously tracked to compute FDEP using:
 | (3) |
The force data was fit to a single shell model28 to calculate the conductivity and permittivity of the shell composed of the oocyst wall (σwall and εwall) and the core composed of the cytoplasm with the sporozoites (σcyto and εcyto). Details of the particle tracking to measure the FDEP and computation of cell electrophysiology by fitting dielectric properties to the shell model are described in subsequent section and in ESI.†
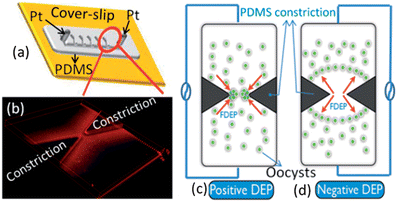 | ||
| Fig. 1 (a) Schematic device set-up; (b) confocal image of the constriction region. Trapping of oocysts in the constriction region under: (c) positive DEP (PDEP) and (d) negative DEP (NDEP). | ||
3 Results and discussion
Identifying persistent subpopulations after disinfection
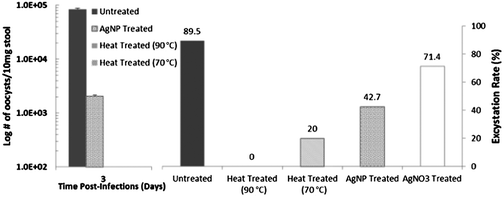
We begin with applying the excystation assay and infectivity tests on the mouse model to identify the persistent and sensitive subpopulations of C. parvum oocysts with differing phenotypic alterations after heat and AgNP treatment. As per Fig. 2 (left), based on # of oocysts shed from the mouse on Day 3 when the infection is most intense, as confirmed by the weight-loss data, the high infectivity of untreated oocysts is almost absent with heat treated oocysts at both, 90 °C and 70 °C. Following AgNP treatment, while the infectivity of the oocysts is significantly reduced, it is still discernible. Based on the excystation rate (Fig. 2 – right), it is clear that while 89.5% of the untreated oocysts undergo excystation, the rate drops to 71.4% after AgNO3 treatment, to 42.7% after AgNP treatment, and to 20% and 0%, after heat treatment at 70 °C and 90 °C, respectively. Together, these results suggest that while heat treatment of oocysts at 90 °C causes complete de-activation, there are persistent subpopulations of unactivated oocysts after heat treatment at 70 °C and after AgNP treatment. In comparison to AgNP treatment, the disinfectant effect of AgNO3 is less significant, as apparent from the 70% excystation rate.Heterogeneous modification of oocysts after disinfection
The viability of sporozoites in the oocyst can be indicated by the banana-shaped sporozoite morphology in phase and DIC microscopy modes, and the presence of DAPI signal in fluorescence mode, whereas absence of PI signal indicates integrity of the oocyst wall.47,48 The distinct sporozoite structure of untreated oocysts is apparent in the phase contrast (Fig. 3a), and DIC images (Fig. 3b). Additionally, based on presence of DAPI labeling that delineates the four nuclei of the sporozoites (Fig. 3c) and the absence of PI labeling (Fig. 3d), henceforth labeled as: DAPI +/PI − (dotted green arrows), we infer the viability of the oocysts. Note that for clarity, the phase and DIC images in Fig. 3 are at higher magnification than the fluorescence images, but the respective images from the same field of view in ESI section (Fig. S3†) also illustrate these inferences. Heat treated oocysts at 90 °C do not show a discernible banana-shaped sporozoite structure. Instead, a nebulous sporozoite structure that is indistinguishable from the background is apparent under phase contrast (Fig. 3e) and DIC (Fig. 3f), alongside a diffuse level of DAPI labeling that is spread beyond the four nuclei of the sporozoites (Fig. 3g), suggesting a disorganized oocyst cytoplasm.49 Furthermore, the presence of PI labeling within the oocysts (Fig. 3h), indicates disruption of the oocyst wall, henceforth labeled as: PI + (solid red arrows). Heat treated oocysts at 70 °C indicate heterogeneous modifications, with a subpopulation showing intact sporozoites with DAPI +/PI − labeling and another showing the destroyed oocyst wall with PI + labeling (Fig. 3k and l). The differential levels of PI signal from the PI + labeled oocysts further indicates the heterogeneous modifications (Fig. 3l). Upon AgNP treatment, instead of the banana-shaped sporozoite structure, the phase contrast image of the oocyst cytoplasm reveals a transparent region composed of a coalesced cluster adjoining an empty region (Fig. 3m), with topographic differences in the DIC image (Fig. 3n) that suggest an altered sporozoite structure. However, there is a small group of AgNP treated oocysts that continue to show the distinct sporozoite morphology of untreated oocysts, as apparent from the red arrow with Sp ✓ in Fig. 3m–n. This sub-group of oocysts indicate the DAPI +/PI − signal delineating the nuclei of the sporozoites (Fig. 3o), whereas the other sub-group of AgNP treated oocysts with the altered sporozoite structure (Sp ✗) do not show any DAPI signal. The PI signal is uniformly absent from all AgNP treated oocysts (Fig. 3p). Hence, optical microscopy confirms the heterogeneous modification of the oocysts after heat treatment at 70 °C and after AgNP treatment. Note that these treatments were carried out over ∼4 hours to ensure steady-state behavior. After heat treatment at 70 °C, there is a persistent subpopulation with intact occyst wall and sporozoite structure (DAPI +/PI −) and a sensitive subpopulation with a compromised occyst wall and diffuse sporozoite structure (PI +). After AgNP treatment, there is a persistent subpopulation with an intact sporozoite structure in the oocyst (Sp ✓) that indicates: DAPI +/PI − signal, whereas there is a sensitive subpopulation with an altered sporozoite structure in the oocyst (Sp ✗), but with an intact oocyst wall (i.e. DAPI – and PI –). We infer that while optical microscopy is qualitatively consistent with excystation and infectivity assays, which indicate the partial loss of sporozoite functionality due to sensitive and persistent subpopulations after AgNP treatment and heat treatment at 70 °C, these techniques are unable to quantify the degree of oocyst alteration and number of oocysts with a particular alteration.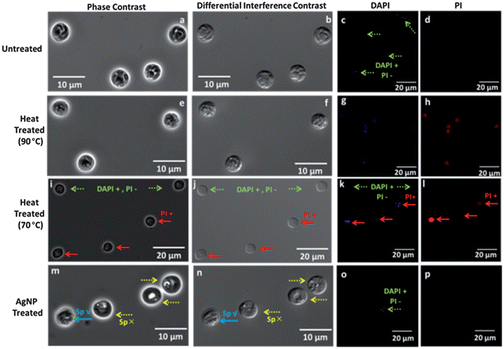 | ||
| Fig. 3 Microscopy of oocysts after various treatments: column 1: phase contrast; column 2: Nomarski Differential Interference Contrast (DIC); column 3: DAPI fluorescence; column 4: PI fluorescence; for: untreated (a–d); heat-treated at 90 °C (e–h); heat-treated at 70 °C (i–l); AgNP treated (m–p). Intact (Sp ✓) versus altered sporozoites (Sp ✗) are confirmed by DAPI + (inclusion) and PI − (exclusion) (green arrows). Images from same field of view are in ESI.† | ||
Simultaneous dielectrophoretic tracking of single oocysts
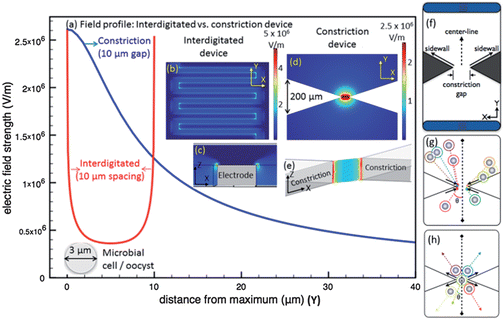
To quantify sensitive versus persistent oocyst subpopulations after heat treatment at 70 °C or after AgNP treatment, we characterize the differences in DEP behavior as a probe of cell electrophysiology. The capability of DEP for frequency-modulated characterization of oocysts, with selectivity to the properties of the oocyst wall at low frequencies and to the properties of the sporozoites in the cytoplasm at high frequencies, can enable electrophysiological monitoring of the oocysts, without the need for chemical alteration or wash steps, as would be required for fluorescence assays based on dye penetration and antibody binding schemes. Furthermore, this frequency-selective DEP behavior can be applied towards the separation and enrichment of oocysts due to their spatial localization based on their oocyst wall or sporozoite condition, thereby enabling the quantification of their heterogeneous modification by disinfectants. For this purpose, we continuously track the time evolution of displacement of the oocysts under DEP behavior within a constriction device. Prior methods have used interdigitated or quadrapole electrode devices to track the collection rate38 or velocity of polarized bio-particles45 under dielectrophoresis. The chief disadvantage of devices with electrodes for quantifying the DEP behavior is that since field lines must terminate normal to the electrode surface, the degree of spatial control of the field gradient across the lateral and depth directions is rather limited.50 As per Fig. 4a and b, the sharp field non-uniformity laterally from 10 μm spaced interdigitated electrode edges will cause polarized bio-particles to be abruptly accelerated, only in close proximity of the electrode edge. Hence, under positive DEP, this sharp field profile does not allow for recording of significant displacement versus time points, especially for microbial and mammalian cells that extend over several microns. Furthermore, as per Fig. 4c, the field non-uniformity vertically from the electrode causes differential influence of the field across the device depth. As a result, displacement tracking to quantify the DEP response is not accurate. While collection rate measurements can enable quantification, they will require averaging over a large region due to the ill-defined trapping region, which will make the data less sensitive to variations from fractional subpopulations. Quantifying negative DEP behavior presents even greater problems since the polarized bio-particles are translated along the device depth. While confocal microscopy can quantify the final position under negative DEP, active tracking at high frame rates is not possible. In this context, the insulator constriction within the device used in the current study enables an unprecedented degree of spatial control of the field to define the trajectory of the polarized bio-particles under both, positive and negative DEP. First, the high-field point is localized at the constriction tip and the gradient is modulated over a specified spatial extent of ∼50 μm, as shown in Fig. 4a and d. Hence, the trajectory of polarized bio-particles is well-defined; i.e. from the beginning of the field gradient to the constriction tip under positive DEP (Fig. 4g) and from the constriction tip to the end of the field gradient under negative DEP (Fig. 4h). Furthermore, since the constriction occurs uniformly across the device depth, the field profile is symmetric across the depth (Fig. 4e). Hence, all of the polarized bio-particles in the device within the vicinity of the field gradient due to the constriction are influenced uniformly, irrespective of their position within the device depth, whereas the differences in trapping force due to the lateral field non-uniformity can be normalized by the field gradient (Fig. 4d) along a particular trajectory. In this manner, since the particle trajectory is highly defined under both, positive and negative DEP, the displacement versus time data of individual bio-particles can be simultaneously measured in a facile manner by image analysis, without the need for averaging of the data from multiple bio-particle collection measurements over a large region. This enhances the sensitivity of our measurements towards small differences in electrophysiology of subpopulation.Frequency-selective localization by dielectrophoresis
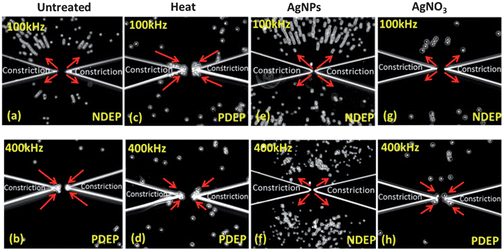
The DEP response of biological particles, such as C. parvum oocysts can be characterized using a shell model,14,15,51 with the shell composed of an oocyst wall of low conductivity (σwall ∼ 100 nS m−1 as per ref. 28) and a core of higher conductivity due to intact sporozoites within the cytoplasm (σcyto ∼ 0.05 S m−1ref. 28). The oocyst can be represented in terms of an equivalent circuit composed of a low-loss capacitor of capacitance: C, to denote the oocyst wall, in series with the high-conductivity oocyst cytoplasm of resistance: R. As per RC circuit analysis, at frequencies below the inverse RC time constant, the polarizability and net direction of particle translation is determined by the capacitor due to the oocyst wall, which should result in negative DEP (NDEP) behavior within moderately conducting media (σm ∼ 0.1–10 mS m−1), due to: σwall (∼100 nS m−1) < σm (0.1–10 mS m−1) in eqn (2). On the other hand, at frequencies above the inverse RC time constant, the high conductivity region at the oocyst core determines the DEP response, thereby causing positive DEP (PDEP) behavior, since: σcyto (∼0.05 S m−1) > σm (0.1–10 mS m−1) in eqn (2). At very high frequencies (∼10 MHz), the response is determined by permittivity rather than conductivity, which should cause NDEP behavior, due to: εcyto (∼60) < εm (∼80).28 This is indeed the trend observed within Fig. 5, which shows images in the vicinity of the insulator constriction region of the device after 30 seconds of the onset of DEP behavior at ∼300 Vpp cm−1 field; and at frequencies of 100 kHz and 400 kHz, where the oocyst wall and the sporozoites in the oocyst cytoplasm, respectively, determine the net DEP behavior. For untreated oocysts, NDEP behavior occurs from 1 kHz onwards until ∼200 kHz, as apparent from the strong translation force on the oocysts away from the constriction tip at 100 kHz (as per arrows in Fig. 5a), whereas PDEP behavior occurs from 400 kHz onwards, as apparent from trapping of the oocysts at the constriction tip (as per arrows in Fig. 5b). Upon heat treatment of the oocysts (90 °C), the disruption of the oocyst wall, as apparent from the fluorescence images in Fig. 5g and h, affects the DEP response. The increased permeability of the oocyst wall impedes dipole formation across the oocyst wall, thereby eliminating the screening action of the capacitor and the associated NDEP behavior. Instead, crossover to PDEP behavior is observed at earlier frequencies, due to polarization of the oocyst cytoplasm, which is no longer screened by the oocyst wall at low frequencies. Hence, the onset of PDEP, which occurs from 10 kHz onwards for heat-treated oocysts, is clearly apparent at 100 kHz in Fig. 5c. At 400 kHz, PDEP behavior continues to be present, albeit at a significantly lower force level, as apparent from the fewer trapped oocysts at the constriction tip in Fig. 5d after the same 30 seconds of applied field. Following AgNP treatment, the strong NDEP response is clearly apparent at 100 kHz in Fig. 5e, indicating an uncompromised oocyst wall, which is consistent with the fluorescence results. At 400 kHz, instead of the oocysts being directed towards the constriction tips, as observed with untreated (Fig. 5b) or heat treated oocysts (Fig. 5d), the DEP force on AgNP treated oocysts continues to remain directed away from the constrictions tips (Fig. 5f). However, the magnitude of the NDEP force at 400 kHz is lower versus that at 100 kHz, as apparent from localization of the oocysts closer to the constriction tip at 400 kHz (Fig. 5f) versus 100 kHz (Fig. 5e). For oocysts with an uncompromised wall, the DEP response at 400 kHz should be determined by the difference of cytoplasm and media conductivity. Hence, the NDEP behavior after AgNP treatment of the oocysts can be attributed to a reduction in the cytoplasm conductivity due to alteration of the sporozoites (σcyto), thereby obviating PDEP behavior, due to: (σcyto − σm) < 0. In the subsequent sections we explain the NDEP behavior of AgNP treated oocysts and correlate it to alteration of sporozoites in the oocyst. Finally, based on the similarity of DEP response of AgNO3 treated versus untreated oocysts at 100 kHz (Fig. 5g) and at 400 kHz (Fig. 5h), we infer that the oocysts are not significantly altered, which is consistent with the excystation results.Characterizing cell electrophysiology by dielectrophoresis
Based on tracking the displacement of the oocysts versus time to quantify the DEP force after normalizing for the field uniformities within the constriction device (as described within the Methods section and ESI: S1†), Fig. 6a shows the frequency response of FDEP (symbols) for untreated, heat treated (90 °C) and AgNP treated oocysts, with a polynomial fit. For untreated oocysts, the transition from NDEP behavior at low frequencies (<100 kHz) to PDEP behavior at mid-level frequencies (>400 kHz) is apparent. For heat treated oocysts, PDEP behavior starts at successively earlier frequencies, due to loss of the field screening by the compromised oocyst wall.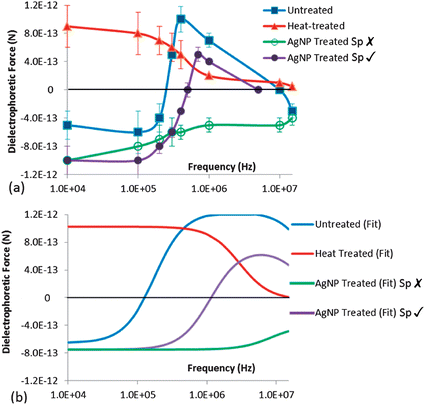 | ||
| Fig. 6 Measured FDEP frequency responses from DEP tracking of: (a) Untreated and heat treated oocysts (90 °C) at σm of 2 mS m−1 and AgNP treated oocysts at σm of 10 mS m−1. Error bars are based on velocity profiles from 20 oocysts after each treatment type. (b) The fitted force response at the respective σm values is applied to characterize oocyst electrophysiology, as in Table 1. | ||
For AgNP treated oocysts, we are able to identify different DEP behavior at frequencies beyond 400 kHz for sensitive oocysts with altered sporozoites (Sp ✗) versus persistent oocysts with intact sporozoites (Sp ✓), as will be described in the subsequent section. The force responses of Fig. 6a were fit to a single shell model (ESI S2†), to quantify the oocyst electrophysiology, as given by conductivity and permittivity values for the oocyst wall (σwall, εwall) and sporozoites in the cytoplasm (σcyto, εcyto), after each treatment. This method compares well with the crossover frequency method, without the need for measuring the spectra within media of varying conductivity (see ESI S4†). Based on the fits in Fig. 6b and Table 1, it is clear that heat treatment causes a steep rise in σwall, from 6 × 10⁻⁷ S m−1 for untreated oocysts to 5 × 10⁻⁵ S m−1 for heat treated oocysts. Following AgNP treatment, there is a sensitive subpopulation with altered sporozoites (Sp ✗) that correlates with a steeply lowered σcyto and no changes to σwall, while the persistent subpopulation with intact sporozoites (Sp ✓) exhibits no significant alterations in σcyto and σwall, in comparison to untreated oocysts. The antimicrobial action of AgNP is usually attributed to the release of silver ions and generation reactive oxygen species that damage the cell membrane or penetrate into the cells to destroy the proteins and DNA.32,33,37 Hence, the significantly lowered σcyto after AgNP treatment for the subpopulation with altered sporozoites (Sp ✗) is attributed to cytoplasm alteration due to degraded proteins and DNA.
| Treatment | σ wall | ε wall | σ cyto | ε cyto |
|---|---|---|---|---|
| Untreated | 6 × 10⁻⁷ | 8 | 0.055 | 55 |
| Heat-treated | 5 × 10⁻⁵ | 8 | 0.005 | 78 |
| AgNP treated (Sp ✗) | 5 × 10⁻⁷ | 5 | 5 × 10⁻⁶ | 30 |
| AgNP treated (Sp ✓) | 1 × 10⁻⁸ | 3 | 0.032 | 70 |
Separation based on oocyst wall and sporozoite infectivity
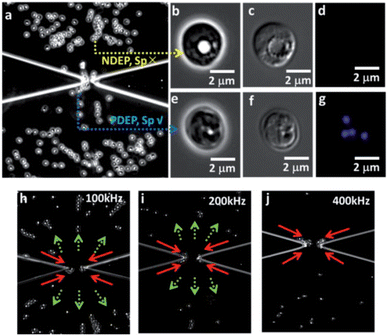
Finally, using the quantitative force response in Fig. 6a from the DEP tracking measurements, we can identify the appropriate frequency for effectively separating the subpopulations after AgNP and heat treatment (70 °C), utilizing differences in the magnitude and direction of the DEP trapping force. This is necessary, since persistent subpopulations can form extremely small fractions of the total population.46 Through collection rate measurements on the separated subpopulations, the fraction with a particular electrophysiological alteration or phenotype can be quantified. For oocysts with altered (Sp ✗) versus intact sporozoites (Sp ✓) after AgNP treatment, a frequency of 700 kHz causes PDEP behavior for Sp ✓ oocysts (blue arrows), whereas Sp ✗ oocysts experience NDEP behavior (yellow arrows), as per Fig. 7a. Optical microscopy of the sub-group of AgNP treated oocysts exhibiting NDEP behavior confirms their altered sporozoites (Sp ✗), as apparent from absence of the banana-shaped sporozoite structure in the phase contrast (Fig. 7b) and DIC images (Fig. 7c), as well as the exclusion of DAPI signal in fluorescence images (Fig. 7d). On the other hand, the oocysts exhibiting PDEP behavior show the distinct banana-shaped sporozoite structure in the high-magnification phase contrast (Fig. 7e) and DIC (Fig. 7f) images; as well as the presence of DAPI signal in fluorescence images (Fig. 7g). Next, we demonstrate the separation of the sub-groups with intact versus compromised oocyst walls, after heat treatment at 70 °C. As per Fig. 7h–j, a lower frequency of 100 kHz, where dominance of the screening action of the oocyst wall causes NDEP behavior, is more effective at separating the respective oocyst groups versus at higher frequencies, where the net polarization behavior of the oocysts is no longer sensitive to the oocyst wall. Oocysts with uncompromised walls exhibit NDEP up to 200 kHz, whereas those with disrupted walls exhibit PDEP, starting from successively lower frequencies (depending on degree of disruption) and extending to ∼400 kHz. Hence, judicious choice of the frequency can enable more effective separations through modulation of the magnitude and direction of the DEP trapping force.4 Conclusions
Towards quantifying persistent microbial subpopulations with phenotypically different alterations after disinfection treatments and characterizing their electrophysiology, we demonstrate the utility of quantitative dielectrophoretic tracking for force measurements over a wide frequency range (10 kHz–10 MHz). Utilizing a device with insulator constrictions to localize the field and modulate the spatial extent of the field gradient so that it is symmetric across the device depth, we are able to establish a well-defined trajectory of cells under positive and negative dielectrophoresis. As a result, the simultaneous and facile tracking of velocity of single cells can be accomplished for computing the quantitative force response, which is more sensitive to electrophysiological differences from subpopulations, since there is no need for averaging over large collection regions. This quantitative force response over the 10 kHz–10 MHz frequency range is applied to characterize and separate sensitive versus persistent subpopulations that were identified by excystation and animal infectivity assays during the disinfection of Cryptosporidium parvum. Through correlating the force response at 0.4–1 MHz to integrity of sporozoites in the oocyst and at ≤100 kHz to the integrity of the oocyst wall, we demonstrate the separation of persistent subpopulations after AgNP treatment and heat treatment at 70 °C, respectively. We envision the application of this technique for probing subtle distinctions in microbial electrophysiology after immuno-magnetic separation from large water systems.Acknowledgements
Student support was from NSF 0902969 and UVA nanoSTAR. Other support from NIH/NIAID grant U54 AI 057168 is acknowledged.References
- K. R. Allison, M. P. Brynildsen and J. J. Collins, Curr. Opin. Microbiol., 2011, 14, 593–598 CrossRef CAS PubMed.
- O. Gefen and N. Q. Balaban, FEMS microbiology reviews, 2009, 33, 704–717 CrossRef CAS PubMed.
- E. J. Stewart, J. Bacteriol., 2012, 194, 4151–4160 CrossRef CAS PubMed.
- M. Smith, Cryptosporidium: The Analytical Challenge, Royal Society of Chemistry, Cambridge, 2001 Search PubMed.
- U. N. H. S. Programme, Water and Sanitation in the World's Cities: Local Action for Global Goals, Earthscan Publications, London, 2003 Search PubMed.
- X. M. Chen, J. S. Keithly, C. V. Paya and N. F. LaRusso, N. Engl. J. Med., 2002, 346, 1723–1731 CrossRef PubMed.
- R. Dillingham and R. L. Guerrant, Lancet, 2004, 363, 94–95 CrossRef.
- C. G. R. Kenneth and J. Ryan, Sherris Medical microbiology: An introduction to infectious disease, McGraw-Hill, New York, 4th edn, 2004 Search PubMed.
- H. V. Smith and R. A. Nichols, Exp. Parasitol., 2010, 124, 61–79 CrossRef PubMed.
- P. C. Okhuysen, C. L. Chappell, J. H. Crabb, C. R. Sterling and H. L. DuPont, J. Infect. Dis., 1999, 180, 1275–1281 CrossRef CAS PubMed.
- M. Walker, K. Leddy and E. Hager, Appl. Environ. Microbiol., 2001, 67, 5526–5529 CrossRef CAS PubMed.
- J. B. Parr, J. E. Sevilleja, A. Samie, C. Alcantara, S. E. Stroup, A. Kohli, R. Fayer, A. A. Lima, E. R. Houpt and R. L. Guerrant, Am. J. Trop. Med. Hyg., 2007, 76, 938–942 CAS.
- J. T. Connelly, S. R. Nugen, W. Borejsza-Wysocki, R. A. Durst, R. A. Montagna and A. J. Baeumner, Anal. Bioanal. Chem., 2008, 391, 487–495 CrossRef CAS PubMed.
- N. G. Green and H. Morgan, AC Electrokinetics: colloids and nanoparticles, Research Studies Press Ltd., USA, 1st edn, 2002, p. 250 Search PubMed.
- T. B. Jones, Electromechanics of Particles, Cambridge University Press, Cambridge, New York, 1995 Search PubMed.
- R. Pethig, Biomicrofluidics, 2010, 4, 022811 CrossRef PubMed.
- S. Bhattacharya, T. C. Chao and A. Ros, Electrophoresis, 2011, 32, 2550–2558 CrossRef CAS PubMed.
- A. Salmanzadeh, L. Romero, H. Shafiee, R. C. Gallo-Villanueva, M. A. Stremler, S. D. Cramer and R. V. Davalos, Lab Chip, 2012, 12, 182–189 RSC.
- B. H. Lapizco-Encinas, R. V. Davalos, B. A. Simmons, E. B. Cummings and Y. Fintschenko, J. Microbiol. Methods, 2005, 62, 317–326 CrossRef CAS PubMed.
- H. Morgan, M. P. Hughes and N. G. Green, Biophys. J., 1999, 77, 516–525 CrossRef CAS.
- N. Swami, C. F. Chou, V. Ramamurthy and V. Chaurey, Lab Chip, 2009, 9, 3212–3220 RSC.
- K. T. Liao, M. Tsegaye, V. Chaurey, C. F. Chou and N. S. Swami, Electrophoresis, 2012, 33, 1958–1966 CrossRef CAS PubMed.
- K. F. Hoettges, Y. Hubner, L. M. Broche, S. L. Ogin, G. E. Kass and M. P. Hughes, Anal. Chem., 2008, 80, 2063–2068 CrossRef CAS PubMed.
- W. A. Braff, A. Pignier and C. R. Buie, Lab Chip, 2012, 12, 1327–1331 RSC.
- V. Chaurey, C. Polanco, C. F. Chou and N. S. Swami, Biomicrofluidics, 2012, 6, 012806: 1–14 CrossRef PubMed.
- C. C. Chung, I. F. Cheng, H. M. Chen, H. C. Kan, W. H. Yang and H. C. Chang, Anal. Chem., 2012, 84, 3347–3354 CrossRef CAS PubMed.
- B. G. Hawkins, C. Huang, S. Arasanipalai and B. J. Kirby, Anal. Chem., 2011, 83, 3507–3515 CrossRef CAS PubMed.
- H. Narayanan Unni, D. Hartono, L. Yue Lanry Yung, M. Mah-Lee Ng, H. Pueh Lee, B. Cheong Khoo and K. M. Lim, Biomicrofluidics, 2012, 6, 12805–1280514 CrossRef PubMed.
- C. M. Quinn, G. P. Archer, W. B. Betts and J. G. O'Neill, Lett. Appl. Microbiol., 1996, 22, 224–228 CrossRef CAS.
- A. D. Goater, J. P. H. Burt and R. Pethig, J. Phys. D: Appl. Phys., 1997, 30, 5 CrossRef.
- C. G. Dalton, A. D. Goater, J. Drysdale and R. Pethig, Colloids Surf., A, 2001, 195, 6 CrossRef.
- C. Marambio-Jones and E. M. V. Hoek, J. Nanopart. Res., 2010, 12, 1531–1551 CrossRef CAS.
- E. Fauss, R. MacCusppie, V. Carver, J. A. Smith and N. S. Swami, Colloids Surf., B, 2014, 113, 77–84 CrossRef PubMed.
- V. A. Oyanedel-Craver and J. A. Smith, Environ. Sci. Technol., 2008, 42, 927–933 CrossRef CAS.
- B. De Gusseme, T. Hennebel, E. Christiaens, H. Saveyn, K. Verbeken, J. P. Fitts, N. Boon and W. Verstraete, Water Res., 2011, 45, 1856–1864 CrossRef CAS PubMed.
- Y. H. Lv, H. Liu, Z. Wang, S. J. Liu, L. J. Hao, Y. H. Sang, D. Liu, J. Y. Wang and R. I. Boughton, J. Membr. Sci., 2009, 331, 50–56 CrossRef CAS PubMed.
- J. R. Morones, J. L. Elechiguerra, A. Camacho, K. Holt, J. B. Kouri, J. T. Ramirez and M. J. Yacaman, Nanotechnology, 2005, 16, 2346–2353 CrossRef CAS PubMed.
- D. J. Bakewell and H. Morgan, Meas. Sci. Technol., 2004, 15, 254–266 CrossRef CAS.
- F. H. Labeed, H. M. Coley and M. P. Hughes, Biochim. Biophys. Acta, Gen. Subj., 2006, 1760, 922–929 CrossRef CAS PubMed.
- Z. Gagnon, J. Gordon, S. Sengupta and H. C. Chang, Electrophoresis, 2008, 29, 2272–2279 CrossRef CAS PubMed.
- Z. Gagnon, J. Mazur and H. C. Chang, Biomicrofluidics, 2009, 3, 044108 CrossRef PubMed.
- M. Castellarnau, A. Errachid, C. Madrid, A. Juarez and J. Samitier, Biophys. J., 2006, 91, 3937–3945 CrossRef CAS PubMed.
- A. Di Biasio, L. Ambrosone and C. Cametti, Biophys. J., 2010, 99, 163–174 CrossRef CAS PubMed.
- K. V. Kaler and T. B. Jones, Biophys. J., 1990, 57, 173–182 CrossRef CAS.
- H. Watarai, T. Sakamoto and S. Tsukahara, Langmuir, 1997, 13, 2417–2420 CrossRef CAS.
- H. S. Moyed and K. P. Bertrand, J. Bacteriol., 1983, 155, 768–775 CAS.
- R. Fayer, Appl. Environ. Microbiol., 1994, 60, 2732–2735 CAS.
- A. T. Campbell, L. J. Robertson and H. V. Smith, Appl. Environ. Microbiol., 1992, 58, 3488–3493 CAS.
- L. J. Anguish and W. C. Ghiorse, Appl. Environ. Microbiol., 1997, 63, 724–733 CAS.
- V. Chaurey, P. C. Chiang, C. Polanco, Y. H. Su, C. F. Chou and N. S. Swami, Langmuir, 2010, 26, 19022–19026 CrossRef CAS PubMed.
- Z. R. Gagnon, Electrophoresis, 2011, 32, 2466–2487 CrossRef CAS PubMed.
Footnote |
| † Electronic supplementary information (ESI) available: Description of methodology for measurement of trapping force on the oocysts and fitting of the force response to calculate dielectric parameters are described. Images of the excystation and fluorescence data, as well as videos of oocyst trapping and high-magnification phase contrast and DIC images are also available. See DOI: 10.1039/c3an01810e |
| This journal is © The Royal Society of Chemistry 2014 |

