After trypsinisation, 3D spheroids of C3A hepatocytes need 18 days to re-establish similar levels of key physiological functions to those seen in the liver
Krzysztof Wrzesinski and Stephen J. Fey*
Department of Biochemistry and Molecular Biology, University of Southern Denmark, DK-5230 Odense M, Denmark. E-mail: sjf@bmb.sdu.dk; Fax: +45 6550 2467; Tel: +45 6550 2440
First published on 4th December 2012
Abstract
The introduction of trypsinisation in the 1950's was a paradigm shift which helped instigate cell culture. We demonstrate here that human hepatocyte cell line HepG2–C3A needs at least 18 days after trypsinisation to re-establish key ultrastructural and physiological traits. After trypsinisation, cells start to recover these traits at similar rates in both monolayer (2D) or spheroid (3D) growth environments. While this development is restarted by trypsinisation of 2D cultures (typically after 5 days), recovery continues in 3D cultures up until 15–18 days when changes in growth rate, adenylate kinase, ATP, urea and cholesterol all suggest that spheroids undergo some type of physiological transition. Several other cell lines (e.g. Caco-2, HT 29, MDCK, MCF-10A and HepG2 used to model the small and large intestine, kidney, breast acini and liver respectively) are reported in the literature to exhibit very similar changes, on a similar timescale to those reported here. These changes may thus represent a ubiquitous recovery process after trypsinisation rather than differentiation. This would partially explain the common observation that cells grown in 3D exhibit physiological capabilities that are closer to those seen in the intact tissue or organ.
Introduction
The cultivation of mammalian cells had its beginnings in the studies where Roux showed in 1885 that it was possible to keep embryonic chick cells alive in a saline solution, i.e. in vitro.1 In 1911 Carrel showed that if cells are grown and fed in aseptic conditions they can be grow for long periods in vitro.2 The major breakthroughs in eukaryote cell culture came with the race to develop a polio vaccine in the 1950's following the polio epidemics of the 1940's and 50's. The HeLa cell line was one of the first human cell lines isolated. It was established from a human cervical carcinoma cell line in 1951 by Gey and his colleagues and it played an important role in the production of polio antigens.3 Procedures were developed to efficiently store cells for long periods of time using glycerol4 and liquid nitrogen.5 Phenol red was introduced into cultures to follow their pH.6 In 1955, Eagle carried out the first systematic study of the growth requirements necessary to propagate cells in culture and developed an effective combination of salts, vitamins and serum.7,8 Hayflick and Moorhead demonstrated that primary human fibroblasts have a finite life span and die after a more or less defined number of divisions9 illustrating that not only organisms but also cells were mortal. Thus the focus in classical cell culture techniques has been to store cells, cultivate them, and ensure their vigorous growth and propagation.One of the key techniques is trypsinisation. Treatment of minced tissues with the protease trypsin10,11 and/or collagenase12 (or other enzymes) allows cells to be released from their adhesion to other cells. This creates a single cell suspension which can be diluted and divided into culture flasks for propagation. Trypsinisation works by proteolytically degrading extracellular matrix proteins (ECM). These proteins play crucial roles in cell structure,13,14 function,15–17 signalling,18,19 and gene expression.20 Trypsin treatment activates a number of protease-activated receptors (PAR 1–4), some of which have considerable effects on gene expression. These genes have been linked with a number of diseases including inflammatory and proliferative disorders, and cancer progression (especially metastasis and angiogenesis).21–23 Thus, regular trypsinisation will prevent cells from constructing their natural structure, disturb their advanced functions, signal transduction, gene expression and prevent the full repair of their specific ECM. Despite this, very little has been done to determine when the damage caused by trypsinisation has been repaired.
In the intact organism or tissue, the vast majority of cells are contact inhibited and remain in growth arrest (G0). Trypsinisation removes this contact inhibition, causing the cells to enter the cell cycle in an attempt to repair the ‘wound’. For these reasons, cells in culture cannot be thought of as equivalent to cells in an intact tissue or organism and there is a growing awareness of the fact that cells cultured using traditional two dimensional (2D) cell culture techniques lack a number of advanced physiological functions in addition to the direct effects on their structure or signalling capacity.
Conversely, cells grown in three dimensional (3D) environments (in suspension, on beads, scaffolds etc.) express a number of physiological functions that resemble more closely the native tissue in the organism than cells grown in classical 2D culture flasks or in sandwich cultures. Thus, 3D structure has been proposed as the missing link which will provide in vitro models that sufficiently mimic in vivo conditions.24–26 For example, the LD50 drug response of 3D spheroids is significantly better than cells grown in 2D, and is at least as good as primary cells when compared to that seen in vivo.27
We have therefore examined the ability of C3A cells grown in classical (2D) conditions or as (3D) spheroids and analysed ultrastructure and a few key basic assays including ATP, adenylate kinase, urea and cholesterol to evaluate physiological important functions under these growth conditions. The general activity of the cells has been monitored to ensure that both cultures were growing well. Data has been normalized to the amount of protein in the cells. The cells have not been stimulated to grow or differentiate using any growth factors, hormones or cytokines (except those naturally present in the foetal calf serum).
Our results show that immediately following trypsinisation, several physiologically important functions are suppressed.
Both 2D and 3D cultures start to re-establish these functions at similar rates. In 2D cultures, this is usually interrupted by trypsinisation when the cells reach confluence (after about 5 days in the conditions used here). In the 3D spheroid culture conditions used here, it takes about 18 days to re-establish these functions.
The biological question investigated here thus addresses the difference of toxicity responses between cell culture and primary tissues. The data contribute to an understanding of the differences and will assist extrapolation of in vitro toxicity data to clinical human responses.
Experimental
Standard culture conditions
Immortalized human hepatocytes, HepG2/C3A (ATCC CRL-10741), were thawed from liquid nitrogen storage (from a batch frozen after their third passage after receipt from ATCC), and grown in standard tissue culture conditions (87.5% D-MEM) (containing 1 g glucose per liter (Gibco Cat. no. 31885-023); 1% Non-Essential Amino Acids (Gibco Cat. no. 11140-035); 10% FCS (Foetal calf serum, Sigma Cat. no. F 7524); 0.5% Penicillin/Streptomycin (Gibco Cat. no. 15140-122) 1% GlutaMAX (Gibco Cat. no. 35050-038), 37 °C, 5% CO2 95% air). Effects of storage in liquid nitrogen or thawing were eliminated by growing the cells for at least three passages in tissue culture flasks before starting the experiments, exchanging the medium every two to three days. Cells used for experiments were between passage number 4 and 15.Traditional 2D cell culture
Cells were trypsinised (0.05% Trypsin/EDTA Gibco Cat. no. 15400-054) for 3 min, diluted 1![[thin space (1/6-em)]](https://www.rsc.org/images/entities/char_2009.gif) :4 and sown out into falcon flasks or microtitre plates and cultivated at 37 °C, 5% CO2 95% air in a humidified incubator. The protein-based doubling time for C3A cells grown under these conditions was 77 hours. The cells were allowed to recover from the seeding stress and grow for 24 h before any treatment.
:4 and sown out into falcon flasks or microtitre plates and cultivated at 37 °C, 5% CO2 95% air in a humidified incubator. The protein-based doubling time for C3A cells grown under these conditions was 77 hours. The cells were allowed to recover from the seeding stress and grow for 24 h before any treatment.Spheroid 3D cell culture
The day when the cells were transferred into the bioreactor is defined as day 0. An estimated 90% of the growth medium was changed on day 1 and thereafter three times a week during the 21 day period studied here. To achieve optimal growth conditions for the spheroid suspension, the rotation speed of the bioreactors was initially set between 9–11 revolutions per minute (rpm) and then adjusted to compensate for the growth of the spheroids (and reached 22–25 rpm on day 21). The population density of the spheroid population was regulated by opening the bioreactor and ‘splitting the population’ or removing excess spheroids (usually required between day 6–8 and 20–22). Before samples were analysed by other assays, spheroid batch quality was assessed by staining for 3 min with 0.4% Tryphan Blue (Gibco Cat. no. 15250-061). Batches showing greater than 90% viability were accepted.
24 hours before each sampling point the standard medium was removed and the cells/spheroids were washed twice with Hanks solution (Gibco Cat. no. 14175-129) before the addition of serum-free fully defined medium (98.5% UltraDOMA-PF, Complete Protein-Free Medium, LONZA Cat. no. 12-727F, 0.5% Penicillin/Streptomycin Gibco Cat. no. 15140-122, 1% GlutaMAX Gibco Cat. no. 35050-038). After sample collection at desired time point (as given in the figures) the remaining serum-free media was once again replaced by standard growth medium. To minimize exposure of the spheroids to serum-free media, parallel cultures were set up with an initiation offset of 48 h. Samples were then collected alternately from each parallel culture. The whole experiment was carried out in duplicate.
Electron microscopy
Cells grown in classical flat culture were grown in 75 cm2 culture flasks (TPP, Switzerland Cat. no. 90076) and grown in standard conditions for 5 days (approximately 90% confluent). The growth medium was removed, replaced with an equal volume of Hank's balanced salt solution (Gibco Cat. no. 14175-053) (HBSS) and washed by gently rocking the flask for 1 minute. The cells were then fixed as described below.Spheroids were grown under standard conditions for 21 days and then washed by replacing the growth media with HBSS for 15 min. After washing, cells and spheroids were fixed with 2% glutaraldehyde in 0.1 M cacodylate buffer, pH 7.2 for at least 24 h either in their microtitre plate or in the rotating bioreactor. They were then washed in 0.1 M cacodylate buffer and post-fixed in 1% OsO4 in 0.1 cacodylate buffer for 1 h. The cells and spheroids were then washed in 0.1 M cacodylate buffer for 5 min, in 50 mM maleate, pH 5.2 for 5 min, and finally in 0.5% uranyl acetate in 50 mM maleate, pH 5.2 for 1 h. The samples were dehydrated through a series of increasing strength ethanol solutions and transferred to propylenoxide and embedded in Epon. This was allowed to polymerize at 60 °C for 48 h. Ultrathin sections (40–50 nm) were cut using a Leica Ultracut UCT ultramicrotome (Leica Mikrosystems GmbH, Vienna, Austria) and a 45° diamond knife (Diatome AG, Biel, Switzerland). Images were captured with a 1K MegaView CCD camera (Olympus SIS GmbH, Münster, Germany) in a CM 100 transmission electron microscope (FEI, Eindhoven, The Netherlands).
Growth rate in 2D cultures
Two different methods were used for the determination of growth rate of cells in monolayer cultures: the first was based on cell counting after trypsinisation and the second was based on determination of total amount of protein present in the culture. Only the second procedure could be used for the determination of growth rate of cells in the spheroids.Protein determination in spheroids
The amount of protein present in a sample was determined using the fluorescence based ProStain Protein Quantification Kit (Active Motif Inc. Cat. no. 15001) used according to the manufacturer's instructions modified to use together with lysis buffer. In brief: all samples and standards were prepared so that they all contained the same amount of lysis buffer in the final working solution. Fluorescence was measured on FluoStar Omega (BMG Labtech) using the following settings: excitation filter 485 ± 12 nm; emission 590 ± 10 nm, 5 measurement cycles with 10 flashes per cycle per sample. Four bioreactors were used per experimental condition during this experiment. Two were sampled on day 1, 6, 13, and 21, and other two were sampled on day 3, 10, and 15. In other words, there were duplicate biological replicates at each time point. Each replicate was sampled 3 times and each sample was analysed in triplicate (i.e. 2 biological replicates and 9 technical replicates).Growth rate and protein content estimation in spheroids
Spheroids were photographed on days 1, 3, 6, 10, 13, 15 and 21 post culture initiation and the area of on average 170 spheroids measured individually per time point used to calculate the protein content of the spheroid.27 Briefly photomicrographs were taken using an Olympus IX81 motorized microscope equipped with UPlaneFI 10x/0.3 Ph1 ∞/− for 10× magnification imaging, and UPlainFI 4x/0.13 PhL for 4× magnification images objective lenses (Olympus), and an Olympus DP71 camera. The spheroids have been placed in 96 well microtitre plate with optical bottom (Nunc Cat. no. 165306) prefilled with warm (37 °C) growth medium. Images were transferred to the Olympus AnalySiS® Docu program (Soft Imaging System) and the ‘shadow’ (or great circle) area of spheroids measured using the ‘Fitted Polygon Area’ function which calculates the planar surface of the spheroids in μm2. The amount of protein in spheroids was determined as described. On this basis it could be shown that the protein content of the spheroid could be estimated on the basis that 1 mm2 spheroid represents 16 ± 3.4 μg protein.ATP assay
Cell viability was measured based on their ability to produce ATP. Samples of the hepatocytes grown either in classical culture conditions (in 96 well microtitre plates) or as spheroids (usually 2–6 spheroids per assay point) were collected at appropriate times and transferred to white opaque microtitre plates (Nunc, Cat. no. 165306), the volume of growth medium was adjusted to 100 μl. The cells were lysed with 100 μl of lysis buffer (CellTiter-Glo luminescent cell viability assay, Promega Cat. no. G7571), shaken in the dark for 20 min before the luminescence was measured in a FluoStar Omega® (BMG Labtech). The following instrument parameters were used: one kinetic window, 10 measurement cycles with 0.3 s of measurements interval time, 2 s delay per measurement, additional 0.5 s delay per position change, (repeated twice for each plate measured). Experiments were made as described in protein determination section. The data was normalized with reference to a standard curve for ATP, to the untreated control and to the amount of cellular protein present.Adenylate kinase assay for cell viability
Adenylate kinase was measured using the Lonza Toxilight assay kit (cat. no. LT07-117). Spent media from spheroid cultures were collected in triplicate in connection with refreshing the growth media (typically at 48 h intervals), diluted with five volumes of adenylate kinase detection reagent, allowed to incubate for five minutes and then read in a FluoStar Omega® (BMG Labtech) using excitation wavelength of 410 ± 5 nm and emission wavelength of 475 ± 5 nm. A standard curve was prepared in the same way for each assay plate using a cell standard (4.29 million C3A cells per ml lysed in lysis buffer). Gain was adjusted based on the highest standard curve values. The data is presented as percentage dead cells, using the growth rates determined here to calculate the number of cells and assuming that a single cell contains 0.2 ng cellular protein.Urea assay
Urea was measured using the Urea Assay Kit; Biovision Cat. no. K375-100 accordingly to the manufacturer's instruction. Briefly, samples of growth media from duplicate cultures of either cells or spheroids were centrifuged for 5 min at 140g to remove any intact cellular contamination. Sixty per cent of each supernatant was transferred into new tubes and centrifuged for 15 min at 14000g to remove any cellular debris. Sixty per cent of this supernatant was collected and used for urea determination. 20 μl aliquots were transferred into microtitre plates (Nunc 96-well Maxisorp plates Cat. no. 439454). Dilution buffer and urease were added to the samples and incubated for 10 min at room temperature. Thereafter the ‘Ammonia detector solution’ was added, mixed and incubated for 15 min. Sample fluorescence was then measured using a FluoroStar Omega (BMG Labtech) using excitation wavelength of 410 ± 5 nm and emission wavelength of 475 ± 5 nm. A standard curve was prepared in the same way for each assay plate using a urea standard (Biovision Cat. no. 700623). Gain was adjusted based on the highest standard curve values.Cholesterol assay
Cholesterol was measured using the Amplex Red Cholesterol Assay Kit (Invitrogen Cat. no. A12216) according to the manufacturer's instruction with slight modifications. Positive, negative and standard curves were added to each reading plate. Fifty microliter samples of media (collected as described above) were used. Fluorescence was measured using a FluoroStar Omega® (BMG Labtech) using excitation wavelength of 535 ± 5 nm and emission detection 590 ± 10 nm with temperature control set to 37 °C.Detection of cholesterol synthesis by thin layer chromatography
To measure cholesterol synthesis, 7 μCi ml−1 [1-14C]-sodium acetate (Perkin Elmer Cat. no. NEC084H001MC) was added to triplicate 2D and 3D cultures in microtitre plates and bioreactors and incubated for 4 h. Synthesis of labelled cholesterol was stopped by washing the cells or spheroids three times with 4 °C PBS (Gibco Cat. no. 14200). Samples were treated with 10 mM NaOH for 15 min to ensure full lysis. KOH (6% w/v) in methanol was added to the NaOH cell or spheroid lysates, and the fatty acids in the lysates were saponified by incubation at 60 °C for 30 minutes.29 Non-saponifiable lipids were extracted into petroleum ether by rocking the samples for 30 minutes at 22 °C. The petroleum ether fraction was allowed to evaporate completely at 22 °C overnight and the non-saponifiable lipids were solubilized in chloroform. Samples were loaded onto pre-dried TLC plates (SIGMA Cat. no. 99570) alongside a [U-14C]-Cholesterol standard (GE Healthcare, Cat. no. CFA128-50UCI). TLC was performed for 75 minutes using freshly made petroleum ether:diethylether:acetic acid (70%:29.5%:0.5%) as the mobile phase.30 Plates were dried completely and images captured by autoradiography using Hyperfilm MP (Amersham Cat. no. 28-9068-47). Films were developed after 2 days exposure at room temperature. Using the autoradiograph as a stencil, the area of silica corresponding to the position of the radioactive cholesterol was scraped off and transferred to a scintillation tube. 2.5 ml OptiPhase Hisafe 2 (Perkin Elmer, Cat. no. 1200-436) were added to each sample and the radioactivity present was quantitated using a Wallac 1450 microbeta scintillation counter. The cholesterol content of the individual samples was related to their total protein content determined from a small sample of the NaOH spheroid lysate.31 The data is presented as mM ATP per gram total cellular protein, assuming that a single cell contains 0.2 ng cellular protein.Data analysis
Data was normalized with reference to the amount of protein present, either determined directly when possible or by estimation when direct determination was not possible.Results
Growth rate
When grown in classical standard cell culture conditions, the immortal C3A strain of HepG2 hepatocytes proliferate rapidly and after 5 days reach and pass 100% confluency (Fig. 1a–c). At this point, cultures are normally trypsinised, diluted by a factor of 1:2 to 1:4 and sown out into fresh culture flasks to maintain the strong growth rate. The growth environment in the bioreactor is completely different. Freshly formed spheroids are small (Fig. 1d) and appear to become more compact as they grow in size (Fig. 1e and f) acquiring a darker centre.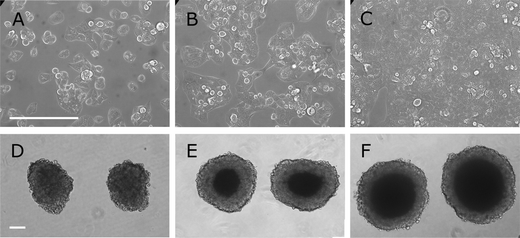 | ||
| Fig. 1 Light microscopy of C3A cells grown either in 2D or 3D conditions. A, B and C: flat culture. C3A cells were cultivated in DMEM and when they reached greater than 90% confluency, were trypsinised and sown out into microtitre plates at 10000 cells per well. Specimens were photographed at 1, 2 and 4 days post trypsinisation corresponding to A sparse, B half-confluent and C confluent cultures. After 5 days it wound be normal to trypsinise the (confluent) culture again. The bar in A indicates 200 μm. D, E and F: spheroid culture. C3A cells were cultivated in DMEM, trypsinised and sown out into AggreWell™ plates for centrifugation. The pellets were then left for 24 h for the cells to bond and then released into suspension culture as spheroids. These spheroids were then cultured in suspension in a rotating bioreactor. Spheroids were photographed at 3, 6 and 17 days respectively after establishing the culture. D Three days after introduction of spheroids into the bioreactor the cells are still loose and can be easily detached from spheroids. E After 6 days the cells have packed themselves more tightly (as seen by the darker centre). F After 17 days it is very difficult to observe changes by light microscopy. The bar in D indicates 200 μm. | ||
The growth rate in 2D was essentially identical for all dilutions up to about 1:4 and approximately constant during the 5 days observed (Fig. 2A). At greater dilutions, the growth rate became progressively slower. In the conditions used here, cells grown using traditional procedures have a rapid growth rate and have an average cell-number based doubling time (i.e. based on the number of counted cells) of approximately 41 hours when averaged throughout the growth and trypsinisation cycle. Using only the data depicted with the filled symbols in Fig. 2A, the protein-based doubling time in 2D culture (i.e. based on the increase in cellular soluble protein mass) was found to be approximately 77 h (3.2 days). This clearly indicates that protein content of the cells is decreasing with time (following the first approximately 24 h after trypsinisation when cells grow but do not divide).
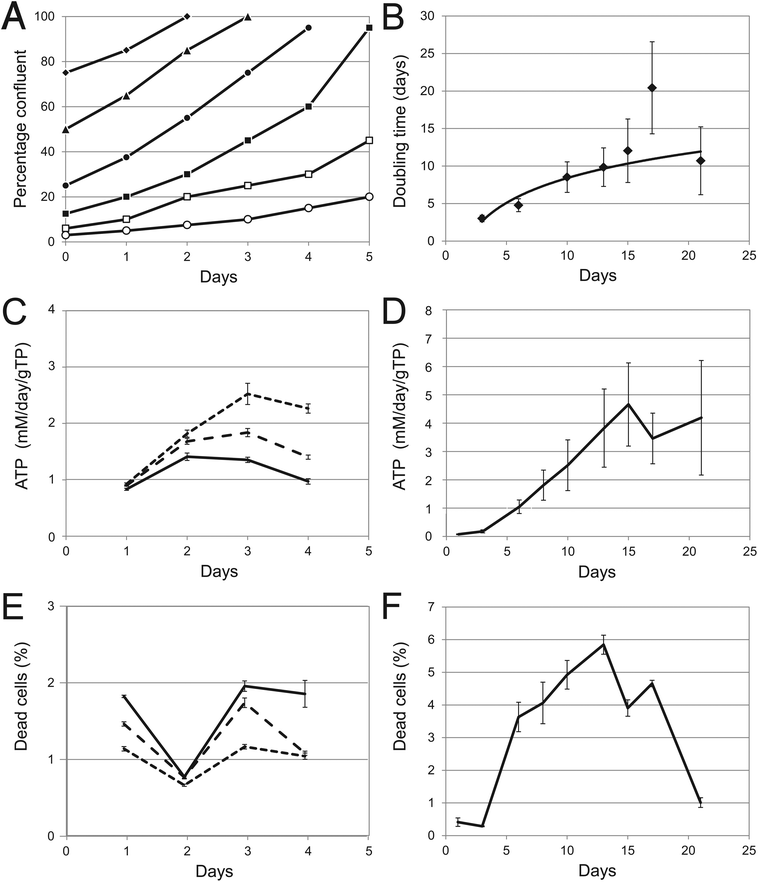 | ||
| Fig. 2 Cell growth and viability. (A) Cell growth as determined in 2D cultures. Cells were counted after trypsinisation (i.e. before culture inoculation) and once again when they had reached greater than 90% confluency. Percentage confluency was determined by visual inspection at 24 h intervals between inoculation and trypsinisation. Duplicate cultures were inoculated at different dilutions: 1:1.3 ◆; 1:2 ▲; 1:4 ●; 1:8 ■; 1:16.7 □; and 1:33.3 ○. (B) Cell growth in 3D cultures. Spheroids were cultivated in the rotating bioreactor. Duplicate bioreactors were terminated at different times after inoculation and the protein content of on average 170 spheroids was estimated at each time point for each bioreactor using the relationship between their shadow area and protein content. The growth rate was determined from the incremental increase in the total protein content of the bioreactor. (C) The total amount of ATP present in quadruplicate 2D cultures inoculated at different densities: short dash (- - -), long dash (— —), and solid line (———) indicate 10000, 15000 and 20000 cells per well respectively. Data was normalised to mM day−1 g−1 Total cellular Protein (gTP). (D) The amount of ATP present in quadruplicate 3D cultures measured as in (C). (E) The percentage of dead cells present in quadruplicate 2D cultures inoculated at different densities, as estimated by adenylate kinase release with time: short dash (- - -), long dash (— —), and solid line (———) indicate 10000, 15000 and 20000 cells per well respectively. Note that the total amount of dead cells increases as the cultures reach confluence. (F) The percentage of dead cells present in quadruplicate 3D cultures, as estimated by adenylate kinase release. Error bars indicate standard deviation. | ||
Due to the nature of the spheroids it was not possible to determine the cell-number based doubling time. The protein-based doubling time of the 3D spheroid cultures, 3 days after initiating the cells into the bioreactor, was similar to that seen in flat culture: approximately three days (Fig. 2B). Assuming that there were no further changes in protein content per cell, measurements of protein content of the spheroids indicates that the cell proliferation rate decreased so that at 21 days the doubling time had fallen to about 12 days.
ATP content
The total amount of ATP present per gram cellular protein in the 2D cultures increases and then falls as the cultures reach confluence (Fig. 2C). A linear accumulation of ATP is seen in the 3D cultures from day 1 to 13, corresponding well to the growth in cell numbers and showing that both cultures are equally metabolically active at early timepoints in both 2D and 3D cultures. After this, in 3D cultures there is a clear interruption to this increase until day 18 after which the total amount begins to increase again (Fig. 2D), at a time when cell growth has slowed.Adenylate kinase release
Adenylate kinase release (occurring during mitochondrial breakdown) is often used as an early marker for apoptosis. In 2D cultures, after an initial dip, the amount of adenylate kinase increased in proportion to the increasing cell numbers illustrating that reaching confluence in itself is not a stimulus for apoptosis (Fig. 2E). In the 3D cultures the amount of adenylate kinase also increased in proportion to the cell number, but only up to day 13 (Fig. 2F). After day 18 the amount fell dramatically indicating that the difference in growth rate is not a reflection of differences in cell survival.Hepatic spheroids exhibit structural similarities to liver
Examined by electron microscopy, cells and spheroids exhibit all the ultrastructural organelles normally seen in eukaryotic cells (nuclei, mitochondria, rough endoplasmic reticulum, etc. (N, M, RER respectively in Fig. 3). Both cells grown in 2D and 3D spheroids exhibit tight junctions (TJ) that compartmentalize the plasma membrane, allowing different receptors, transporters and enzyme systems to be sequestered to specific regions of the plasma membrane. However the tight junctions are more distinct and more common in the spheroids (B and D).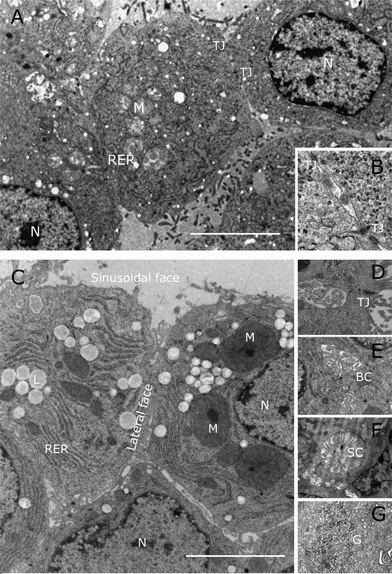 | ||
| Fig. 3 Electron microscopy of C3A cells grown either in 2D or 3D conditions. (A) and (B) Flat culture. C3A cells grown in microtitre plates for 4 days post trypsinisation and then prepared for electron microscopy. The two tight junctions (TJ) seen in A are shown at higher magnification in B. Key: N, nucleus; M, mitochondria; RER, rough endoplasmic reticulum. C, D, E, F and G spheroids were grown in the bioreactor cultures for 21 days after initiation and then fixed and prepared for electron microscopy. Note the diversification of the plasma membrane into sinusoidal and lateral faces, separated by tight junctions (TJ in D), bile canaliculi-like structures (BC in E), sinusoid-like channels packed with long microvilli (SC in F) and the appearance of glycogen granules (G in G). The bar in (A) and (C) indicates 5 μM. | ||
In addition, spheroids exhibit several features that are infrequently seen when the C3A cells are grown under 2D cell culture conditions. These features include the formation of bile canaliculi-like structures in the microvilli-free inter-hepatocyte faces (Fig. 3E). In vivo, in the liver these canaliculi merge and develop into bile ducts leading to the gall bladder. Large numbers of microvilli can also be seen in the sinusoidal-like channels (Fig. 3F) that in the liver in vivo, together with an incomplete layer of endothelial cells, form the space of Disse. Spheroids also exhibit glycogen granules characteristic for the storage of glucose in the liver (Fig. 3G).
Urea production in immortal human hepatocytes grown either in flat culture or as spheroids
Hepatocytes grown in either 2D or 3D produce low levels of urea immediately after trypsinisation. When grown in 2D the urea production is constant at about 0.7 mM per day per gram total protein (gTP)over the course of the 5 days (Fig. 4A). In the 3D cultures, urea production starts at the same level but then increases and more than doubles to 1.5 mM day−1 gTP−1 by day 21 (Fig. 4B). To put this in perspective, the human liver secretes about 25 g urea per day and this gives rise to normal blood urea levels of 2.5 to 7.5 mM. Assuming that the liver weighs 1.5 kg, that 75% of this weight is hepatocytes32 and that 50% of the hepatocyte weight is protein this means that the urea production is in the region of 0.74 mM urea day−1 gTP−1 (grams total hepatocyte protein). Human primary hepatocytes and HepG2 cells have been shown to produce similar amounts of urea (0.55 mM day−1 gTP−1).33,34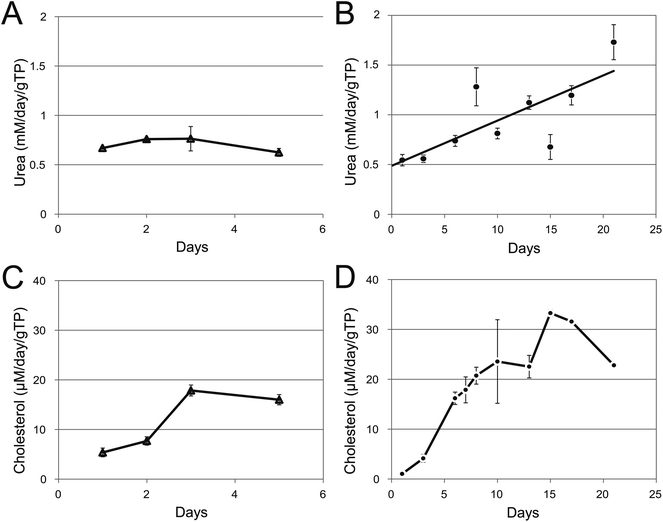 | ||
| Fig. 4 Urea and cholesterol production in immortal human hepatocytes grown either in flat culture or as spheroids. (A) and (B) Samples of the growth media was collected from duplicate microtitre plates (A) or bioreactors (B), clarified by centrifugation and the amount of urea present quantitated at the times shown. (C) and (D) Samples of the growth media was collected from duplicate microtitre plates (C) or bioreactors (D), clarified by centrifugation and the amount of urea present quantitated at the times shown. Data was normalized to mM or μM per day per gram total cellular protein. Error bars indicate standard deviation. | ||
Cholesterol production in immortal human hepatocytes grown either in flat culture or as spheroids
C3A cells grown either in 2D or 3D culture showed little difference in the total amount of cholesterol synthesized in the two different culture conditions immediately after trypsinisation (Fig. 4C and D). In flat culture, during the next 5 days the level of cholesterol increased dramatically from 13 to 76 mg ml−1 per milligram soluble cellular protein. Cholesterol production in the C3A spheroids continued to increase and reached a maximum level of over 30 μM day−1 gTP−1 at about day 16 before falling back to 22 μM day−1 gTP−1. De novo cholesterol synthesis was confirmed by radioisotope labelling, lipid extraction and TLC analysis. Lovastatin treatment of spheroids inhibits HMG-CoA reductase, the rate limiting enzyme in cholesterol synthesis, and abolishes the cholesterol spot on the TLC plate (Fig. 5). The average human liver synthesises 0.7–0.9 g cholesterol per day.35 Using the same logic as before liver hepatocytes produce about 5.5 μmol day−1 gTP−1. The levels synthesised by the spheroids is about 22 μM day−1 gTP−1 (8.5 mg day−1 gTP−1, Fig. 4D) similar to previously published values for HepG2.36,37![Inhibition of cholesterol production by lovastatin. Triplicate spheroid cultures were grown in the presence of [1-14C]-sodium acetate under various conditions and non-saponifiable lipids (including cholesterol) were extracted and separated on a TLC plate. (A) Cholesterol standard; (B) spheroids without radioisotope treatment; (C) spheroids treated with [1-14C]-sodium acetate for 1 h and (D) spheroids were treated with 10 μM lovastatin for 30 min before the addition of [1-14C]-sodium acetate.](/image/article/2013/TX/c2tx20060k/c2tx20060k-f5.gif) | ||
| Fig. 5 Inhibition of cholesterol production by lovastatin. Triplicate spheroid cultures were grown in the presence of [1-14C]-sodium acetate under various conditions and non-saponifiable lipids (including cholesterol) were extracted and separated on a TLC plate. (A) Cholesterol standard; (B) spheroids without radioisotope treatment; (C) spheroids treated with [1-14C]-sodium acetate for 1 h and (D) spheroids were treated with 10 μM lovastatin for 30 min before the addition of [1-14C]-sodium acetate. | ||
Discussion
Trypsinisation of cells in culture has been a key technique since its inception in the 1950's. Most of the cell culture techniques used currently (microscopy, flasks and microtitre plates, plate readers and the plethora of assays associated with them) have been optimized for working with monolayers of cells in flat culture. To keep cells in this state, cells are regularly trypsinised, diluted and re-seeded into fresh culture vessels and often used for assay within 24–48 h after trypsinisation. Despite that many studies have shown that trypsinisation disturbs ultrastructure, gene expression and physiological functions in the cell, little work has been carried out to determine when the cells are fully recovered. If left untrypsinised, cells attached to the bottom of the flask overgrow, form disorganised multilayers leading to some of the cells having less access to oxygen or nutrients. This is detrimental to their function and may lead to necrosis or apoptosis. If it were not for this starvation, cells in 2D might be able to re-establish their functionality in a similar manner to that seen for the 3D spheroid cultures reported here. Oxygen diffusion is also a parameter limiting spheroids to a viable cell thickness of between 100–300 μm.38 Spheroids used here reach sizes of approximately 800–900 μM after 21 days in culture and a central core of debris (presumably dead cells) is observed despite the presence of sinusoid-like and bile canalicular-like channels which facilitate the oxygen (and nutrient) penetration through the spheroid.Immortal C3A hepatocytes have been cultivated in either 2D or 3D conditions and ultrastructure and a few basic physiological functions investigated at various times after trypsinisation. Two dimensional or 3D (spheroid) cultivation gave rise to cultures in which initially the large majority of cells were viable, possessed the normal ultrastructural organelles, had similar doubling times and produced similar amounts of ATP, adenylate kinase, urea and cholesterol. The amounts of urea and cholesterol increased with increasing time in culture, illustrating that a one day old culture is significantly different to a four day old culture, irrespective of whether they are grown in 2D or 3D conditions.
2D cultures grown under the conditions described here reached confluence at day five. Such cultures would normally be trypsinised at this stage, in accordance with the usual practice described in the literature to avoid cellular overgrowth, despite the fact that adenylate kinase levels showed no signs indicating apoptosis. However it has previously been shown that ATP levels, an early indicator of apoptosis, have begun to fall, suggesting the approach of apoptosis.39
The 3D cultures were allowed to continue to grow. At approximately 15–18 days of culture the spheroids appeared to undergo some form of transition, during which physiological functions were perturbed. The growth rate went significantly down at 16–17 days (to a doubling time of about 20 days) before increasing again (to a doubling time of about 12 days). Primary hepatocytes exhibit contact inhibition and while this has been shown to be necessary for hepatocyte differentiation and the establishment of important liver functions40 it is not sufficient because in vitro confluent hepatocytes do not re-establish their lost functionality before they die. The significant reduction in growth rate of the C3A when as 3D spheroids suggests that they are exhibiting some form of contact inhibition while the increase in ATP levels illustrates that this is not due to low metabolic activity. The amount of adenylate kinase peaked at 17 days, and thereafter fell to low levels while the increase in the amount of APT slowed at 13–17 days before continuing to increase. Cholesterol synthesis peaked at 15–17 days, and urea production increased significantly after the transition.
Differentiation in vitro
Many of the observations described here using the C3A cells have also been seen by other authors in other systems that acquire valuable attributes when allowed to differentiate after reaching confluence. These systems include intestinal, kidney, mammary epithelium and other liver cell lines from the liver.The Human Caco-2, HT29 SW480 and SW1222 cell lines derived from human colorectal carcinomas. They spontaneously differentiate into polarized absorptive cell monolayers which can be used for modelling intestinal compound or drug transport.41 The enterocyte-specific enzymes expressed by Caco-2 reach plateau of expression between weeks 2–3 and are reliable markers to evaluate differentiation.42–44 Cell growth rates decrease while enzyme expression specific for the brush border increase.45 Similarly, SW1222 expressed increased amounts of the differentiation markers CDX1 and CK20 after 14 days.46 Lipid raft assembly of adherens junctions takes 10 days in HT29 cells.47 Canine MDCK cells are derived from renal tubular epithelium and are commonly used for in vitro studies of polarised epithelial structure and function relevant to the kidney, lung and breast. MDCK cells take 5–10 days to develop cysts which have the correct polarity when grown on or in collagen or matrigel extracellular matrices and the wrong polarity when grown in suspension in spinner-flasks.48,49 Mouse mammary epithelial cells MCF-10A take 14–16 days to form mature growth-arrested acini-like spheroids.50,51 The human hepatocarcinoma derived cell line HepRG needs to be grown in flat culture for 14 days to reach confluence and can then be induced to differentiate further towards a functional hepatocyte by growth in 2% DMSO for an additional 14 days.52,53
Differentiation is even more common when cells are grown in 3D cultures. Primary hepatocytes regain their ultrastructure54 and maintain their differentiated functionality.26 The human hepatoma-derived cell line Huh7 can be used for infection with hepatitis C virus.55 C2C12 myoblasts cultured form syncytia and express the skeletal muscle specific markers56 and 3D culture promotes stem cell differentiation.57 The pluripotent human embryonal carcinoma cell line NT2 can differentiate to dopaminergic NT2N neurons in the presence of Sertoli cells.58 Thus the appearance of physiological functions in cells in prolonged culture is not a new observation, and common to them all is that they need time to recover after trypsinisation.
Growth rate
C3A cells grown in 2D had a high growth rate and a protein-based doubling time of about 77 hours while the cells were non-confluent. C3A spheroids initially had the same doubling time but during the course of the 21 days, their doubling time fell to about 12 days. A fall in growth rate upon long term culture has also been seen in 3D HepG2 cultures,59 Caco-243 and MCF-10A cells.51Cellular polarization
Twenty one day-old 3D spheroids exhibited extensive tight junctions, numerous microvilli, bile canaliculi-like structures and glycogen granules. These significant ultrastructural differences between the immature and mature cultures have been seen before. The appearance of glycogen granules, tight junctions and other ultrastructural changes 12 days after establishing a confluent monolayer has been used to characterize differentiation in Caco-2, HT29 and SW480 human colon carcinoma cell lines41 and HepG2.60 Full structural and functional differentiation of Caco-2 appeared to be obtained 21 days after seeding.61 Tight junctions allow the hepatocytes in the spheroids to exhibit two clearly different and specialized types of cell faces which presumably correspond to the sinusoidal (hepatocyte-blood interface) and inter-hepatocyte/bile canalicular faces seen in vivo in the liver.62 Bile canaliculi and the peroxisome system (involved in bile synthesis, secretion and export) can be induced to differentiate in HepG2 cells by long-term (20 days) cultivation. During this process, the RNA and protein expression of peroxisome proliferator-activated receptor α (PPARα) is induced by 390% and 150% respectively.62 When rat hepatocytes are provided with ECM (in the form of a sandwich culture) their polarisation and the development of the bile canaliculi takes approximately 6 days (and this process can be accelerated by the bile acid taurocholate).63The division of the plasma membrane by tight junctions allows partitioning of the various transporters which is essential to the polarization of the hepatocyte in vivo. Polarization has been seen in differentiated Caco-2 monolayers, 14 days after reaching confluency.64 Gene expression of the transporters PEPT1, OATPB and P-gp has been shown to more than double during 21 day studies of the differentiation of Caco-2 monolayers.65 While P-gp is expressed in Caco-2 from early in the differentiation process, functional activity reached a peak at 17 days and thereafter remained constant for the next 10 days.61,66
Cholesterol synthesis
The studies presented here show that production of cholesterol is reduced by trypsinisation and re-establishment of cholesterol synthesis occurs at the same rate in both 2D and 3D cultures. Full recovery in 3D spheroids appears to need about 18 days. Similar results have been obtained using alginate encapsulated HepG2.67 Since the oxidation of cholesterol is the first step towards the production of bile acids, cholesterol production appears to be temporally coordinated with cellular polarization (redistribution of transporters to sinusoidal (hepatocyte-blood interface) and inter-hepatocyte/bile canalicular faces, ultrastructural organization of peroxisomes and the appearance of bile canaliculi.Cytochrome P450 expression
HepG2 cells have been shown to have low gene expression and protein activity of the cytochromes P450 and important phase I and II enzymes compared to freshly prepared human hepatocytes. However these genes are expressed and most can be up regulated by known inducers illustrating that HepG2 has the potential to respond.68–70 Furthermore, the gene expression of several cytochrome P450s (1A1, 1A2, 2B6, 2D6 and 3A4) have been shown to increase in HepG2 cells during 12 days of 3D spheroid culture. After this increase, cytochrome 1A2 and 3A4 gene expression could be further induced by treatment with omeprazole and rifampicin respectively.71 Re-establishment of cytochrome activity would be a logical explanation for our previous observations illustrating that the determination of LD50 using 21 day old C3A spheroids correlated significantly better with in vivo LD50 toxicity data for 5 common drugs than primary hepatocytes or HepG2 cells grown in short-term 2D culture.27Urea secretion
HepG2 and C3A cells produce urea but surprisingly lack gene expression for ornithine transcarbamylase and arginase I expression (two key genes in the urea cycle). It was concluded that the urea cycle is non-functional and that the urea is produced by arginase II.33,72 Iyer et al. found that when C3A cells were grown at sub-confluent 2D culture conditions the amount of urea produced slowly declined during a 5 day culture period.34 However, urea production was shown to increase in C3A cells during a 10 day culture period at super-confluent conditions and, when the correct growth media were used, reach the same level as primary porcine hepatocytes (increasing from 8 to 15 μmol h−1 g−1 total protein).73 These apparently contradictory results are concordant with the data presented here. Urea production is low in non-confluent growth conditions and increases dramatically after the transition in long-term culture.Propagation or proliferation
These results suggest that cells grown in 2D and 3D cultures strive to re-establish characteristics of their in vivo state. In 2D, this recovery process is usually interrupted by trypsinisation when the cells reach confluence. This procedure is routine because it becomes more difficult to use many assays when the cells begin to pile up on each other and make small clusters. This gives rise to data variability when assayed by microscopy or plate readers.One can postulate that under the 2D growth conditions, the cellular metabolic resources are channelled to the synthesis of new cells – repair and proliferation – at the expense of the differentiation process. In the absence of trypsinisation, in 3D growth conditions, the cells finally re-establish or re-differentiate. This should not be surprising: cells at the edge of a wound should proliferate in order to repair the wound (and single cells growing at the bottom of a culture flask must represent the most extreme form for wound where the cell has very limited contact with any other cell). Cells in an intact organ are growth arrested and are dedicated to carry out their specialized functions. A similar postulate was made by Pampaloni et al., who compared the growth of MDCK cells grown on 2D plastic surfaces and in 3D collagen gels. They concluded that growth on 2D surfaces favoured a tumour-like phenotype with increased glycolysis whereas growth in 3D favoured a differentiated polarized phenotype.74 Perhaps one should use the terms contact growth inhibition and contact functional activation.
Transition
Interestingly, the spheroid C3A cultures appear to go through some form of transition. Both amount of ATP present and adenylate kinase released was ‘disturbed’ between 13 and 18 days. After this period the amount of ATP continued to increase while the amount of adenylate kinase per cell fell drastically. The doubling time for cell growth was slowest at this time, falling to 20 days during this transition before increasing again. The maximally observed synthesis of cholesterol was reached in the transition at 15 days. Urea production increased significantly thereafter. It is currently not clear what is happening during this transition, but it is possible to postulate that nutrient diffusion (e.g. glucose and oxygen) is limiting supplies to cells deeper in the spheroids (the spheroids are approximately 0.87 mm in diameter). It is possible that these cells are being forced to operate efficiently and resort to activating the mitochondrial oxidative phosphorylation system which otherwise is inactive when glucose and oxygen are plentiful (the so-called ‘Crabtree effect’).75 If the spheroids are ‘circumventing’ the Crabtree effect, this might in part explain why the 3D spheroid data were superior to both 2D and to primary hepatocytes in correlations with in vivo LD50 studies.27Differentiation or re-establishment
The reason why the cells need such a ‘prolonged’ period of about 18 days to re-establish and differentiate specific functions is at present unclear. Obviously there are many processes involved: trypsinisation decreases the ability of the cell to communicate with its neighbours. Communication is needed to establish the tight junctions so that cells develop their ‘polarization’ and the various pumps and transporters can be compartmentalized to their correct cellular interfaces, whether it is the sinusoidal or the inter-hepatic/biliary canaliculus interface. Cells round up during trypsinisation and as such will not need so much cholesterol and this might suppress cholesterol synthesis. Being an essential precursor, cholesterol synthesis has to be re-established before bile acid synthesis can proceed. The differentiation of both internal and external membranes into microvilli, microtubular projections and peroxisomes has to be coordinated with lipid metabolism. Complex, well-orchestrated differentiation pathways have previously been described for example in MDCK cyst formation.76,77The studies presented here illustrate that it is important to define 2D culture conditions very carefully: a 4 day old 80% confluent culture is not the same as a 1 day old 80% confluent culture: they will have different metabolic capacities and differentially expressed enzyme systems. These enzyme systems are in a state of flux and treatments which directly or indirectly affect them will further compound the data obtained. This could be one of the reasons why such disparate results have been published for the LD50 for acetaminophen (paracetamol) using the same cell line (HepG2). In 17 different published studies published the LD50 values obtained varied by a factor of more than twenty (summarized in ref. 27).
HepG2, their sub-clone C3A, and several other transformed hepatocyte cell lines are almost invariably used in flat culture, shortly after trypsinisation, even though there are a few reports of their ability to recover physiological functions during prolonged trypsin-free culture (e.g.ref. 59). The observations presented here illustrate that C3A cells reach full metabolic capacity (for the functions investigated here) after about 18 days. As such, all quantitative studies should be performed with ‘re-established’ or ‘differentiated’ C3A cultures. The levels and rates of urea, cholesterol or ATP production would then correspond to the ‘normal’ values for this cell line.
If the results obtained here are generally true for immortal cell lines, then care should be taken in comparing data from cultures of different ages and in comparisons of immortal cells and their corresponding parental tissues. The fact that the cells are recovering from trypsinisation and differentiating during culture must also be taken into account when interpreting the data obtained, and such data must be expected to be only an approximation of what is actually occurring in vivo. While cells which have been allowed to re-establish their physiological functionality for at least 18 days cannot be guaranteed to be a flawless replica of the cell in the parental organ in vivo, the data presented here support the proposition that they are at least more representative. In some ways these data echo the observation that there are differences in protein expression in the same immortal cell line cells when grown at different passage numbers.78,79
Whether these changes in physiological capacity described here are a true differentiation in culture or simply a recovery from the effects of trypsinisation is not only a semantic question. There are a number of cell lines which develop important physiological functionalities when they are not trypsinised for 15–20 days in culture, but there are many cell lines for which no such data exists. If similar changes during long term culture were found to be common for many cell types, then it would suggest that the changes merely reflect the process of re-establishment of cellular functions after trypsinisation. If the changes are specific and restricted to a short list of cell lines, then it would be more justifiable to define the development of these changes as differentiation.
Conclusions
After trypsinisation, the human immortal hepatocyte C3A cell line needs 18 days to re-establish several key physiological functions. Once this recovery process is completed, these physiological processes operate at levels similar to those seen in vivo in the living organism.Acknowledgements
We would like to acknowledge the generous support of DrugMode A/S which financed part of the work presented here.We would also like to acknowledge Jacob Bastholm Olesen, Signe Marie Andersen and Kira Eyed Joensen for growing the spheroids and carrying out the physiological assays. We would also like to thank Henrik Daa Schrøder (Odense University Hospital) and Sebastian Frische (Aarhus University) for assistance with the electron microscopy.
Notes and references
- V. Hamburger, J. Hist. Biol., 1997, 30, 229–238 CrossRef CAS.
- A. Carrel and M. T. Burrows, J. Exp. Med., 1911, 13, 387–406 CrossRef CAS.
- W. F. Scherer, J. T. Syverton and G. O. Gey, J. Exp. Med., 1953, 97, 695–717 CrossRef CAS.
- H. Chaplin and P. L. Mollison, Lancet, 1953, 261(6753), 215–218 CrossRef.
- H. T. Meryman and E. Kafig, Proc. Soc. Exp. Biol. Med., 1955, 90, 587–589 CAS.
- J. E. Salk, J. S. Youngner and E. N. Ward, Am. J. Hyg., 1954, 60, 214–230 CAS.
- H. Eagle, J. Exp. Med., 1955, 102, 595–600 CrossRef CAS.
- H. Eagle, J. Exp. Med., 1955, 102, 37–56 CrossRef CAS.
- L. Hayflick and P. S. Moorhead, Exp. Cell Res., 1961, 25, 585–621 CrossRef CAS.
- R. Dulbecco and M. Vogt, J. Exp. Med., 1954, 99, 167–182 CrossRef CAS.
- J. S. Youngner, Proc. Soc. Exp. Biol. Med., 1954, 85, 202–205 CAS.
- R. W. Hinz and J. T. Syverton, Proc. Soc. Exp. Biol. Med., 1959, 101, 19–22 CAS.
- J. Bereiter-Hahn, M. Luck, T. Miebach, H. K. Stelzer and M. Voth, J. Cell Sci., 1990, 96(Pt 1), 171–188 Search PubMed.
- U. Batista, M. Garvas, M. Nemec, M. Schara, P. Veranic and T. Koklic, Cell Biol. Int., 2010, 34, 663–668 CrossRef CAS.
- B. Delhotal, F. Lemonnier, M. Couturier and A. Lemonnier, Biochimie, 1983, 65, 121–125 CrossRef CAS.
- K. H. Jung, J. Y. Paik, Y. L. Lee, Y. J. Lee, J. Lee and K. H. Lee, Nucl. Med. Biol., 2009, 36, 967–974 CrossRef CAS.
- H. L. Huang, H. W. Hsing, T. C. Lai, Y. W. Chen, T. R. Lee, H. T. Chan, P. C. Lyu, C. L. Wu, Y. C. Lu, S. T. Lin, C. W. Lin, C. H. Lai, H. T. Chang, H. C. Chou and H. L. Chan, J. Biomed. Sci., 2010, 17, 36 CrossRef.
- J. Zapf, E. Schoenle, M. Waldvogel, I. Sand and E. R. Froesch, Eur. J. Biochem., 1981, 113, 605–609 CrossRef CAS.
- N. D. Evans, E. Gentleman, X. Chen, C. J. Roberts, J. M. Polak and M. M. Stevens, Biomaterials, 2010, 31, 3244–3252 CrossRef CAS.
- P. Jennings, S. Aydin, J. Bennett, R. McBride, C. Weiland, N. Tuite, L. N. Gruber, P. Perco, P. O. Gaora, H. Ellinger-Ziegelbauer, H. J. Ahr, C. V. Kooten, M. R. Daha, P. Prieto, M. P. Ryan, W. Pfaller and T. McMorrow, Toxicol. in Vitro, 2009, 23, 486–499 CrossRef CAS.
- S. Miyata, N. Koshikawa, H. Yasumitsu and K. Miyazaki, J. Biol. Chem., 2000, 275, 4592–4598 CrossRef CAS.
- L. Martin, C. Auge, J. Boue, M. C. Buresi, K. Chapman, S. Asfaha, P. Andrade-Gordon, M. Steinhoff, N. Cenac, G. Dietrich and N. Vergnolle, Pain, 2009, 146, 121–129 CrossRef CAS.
- J. Y. Suen, B. Gardiner, S. Grimmond and D. P. Fairlie, PLoS One, 2010, 5, e13809 Search PubMed.
- L. G. Griffith and M. A. Swartz, Nat. Rev. Mol. Cell Biol., 2006, 7, 211–224 CrossRef CAS.
- F. Pampaloni, E. G. Reynaud and E. H. Stelzer, Nat. Rev. Mol. Cell Biol., 2007, 8, 839–845 CrossRef CAS.
- L. J. Nelson, S. W. Walker, P. C. Hayes and J. N. Plevris, Cells Tissues Organs, 2010, 192, 125–140 CrossRef.
- S. J. Fey and K. Wrzesinski, Toxicol. Sci., 2012, 127, 403–411 CrossRef CAS.
- S. J. Fey and P. M. Larsen, Curr. Opin. Chem. Biol., 2001, 5, 26–33 CrossRef CAS.
- A. Boogaard, M. Griffoen and L. H. Cohen, Biochem. J., 1987, 241, 345–351 CAS.
- J. Roitelman, D. Masson, R. Avner, C. Ammon-Zufferey, A. Perez, Y. Guyon-Gellin, C. L. Bentzen and E. J. Niesor, J. Biol. Chem., 2004, 279, 6465–6473 CrossRef CAS.
- M. M. Bradford, Anal. Biochem., 1976, 72, 248–254 CrossRef CAS.
- S. N. Hart, Y. Li, K. Nakamoto, E. A. Subileau, D. Steen and X. B. Zhong, Drug Metab. Dispos., 2010, 38, 988–994 CrossRef CAS.
- D. Mavri-Damelin, L. H. Damelin, S. Eaton, M. Rees, C. Selden and H. J. Hodgson, Biotechnol. Bioeng., 2008, 99, 644–651 CrossRef CAS.
- V. V. Iyer, H. Yang, M. G. Ierapetritou and C. M. Roth, Biotechnol. Bioeng., 2010, 107, 347–356 CrossRef CAS.
- D. W. Russell, Cardiovasc. Drugs Ther., 1992, 6, 103–110 CrossRef CAS.
- K. O, E. G. Lynn, Y. H. Chung, Y. L. Siow, R. Y. Man and P. C. Choy, Biochim. Biophys. Acta, Lipids Lipid Metab., 1998, 1393, 317–324 CrossRef CAS.
- Y. Miwa, H. Mitsuzumi, M. Yamada, N. Arai, F. Tanabe, K. Okada, M. Kubota, H. Chaen, T. Sunayama and M. Kibata, J. Nutr. Sci. Vitaminol., 2006, 52, 223–231 CrossRef CAS.
- E. Curcio, S. Salerno, G. Barbieri, L. De Bartolo, E. Drioli and A. Bader, Biomaterials, 2007, 28, 5487–5497 CrossRef CAS.
- T. Karu, L. Pyatibrat and G. Kalendo, J. Photochem. Photobiol., B, 1995, 27, 219–223 CrossRef CAS.
- C. Mancone, B. Conti, L. Amicone, V. Bordoni, C. Cicchini, L. Calvo, A. B. Perdomo, G. M. Fimia, M. Tripodi and T. Alonzi, J. Hepatol., 2010, 52, 234–243 CrossRef CAS.
- J. M. Biazik, K. A. Jahn, Y. Su, Y. N. Wu and F. Braet, World J. Gastroenterol., 2010, 16, 2743–2753 CrossRef.
- S. Ferruzza, C. Rossi, M. L. Scarino and Y. Sambuy, Toxicol. in Vitro, 2012, 26, 1252–1255 CrossRef CAS.
- T. Buhrke, I. Lengler and A. Lampen, Dev., Growth Differ., 2011, 53, 411–426 CAS.
- M. P. Verzi, H. Shin, H. H. He, R. Sulahian, C. A. Meyer, R. K. Montgomery, J. C. Fleet, M. Brown, X. S. Liu and R. A. Shivdasani, Dev. Cell, 2010, 19, 713–726 CrossRef CAS.
- V. Bouchard, M. J. Demers, S. Thibodeau, V. Laquerre, N. Fujita, T. Tsuruo, J. F. Beaulieu, R. Gauthier, A. Vezina, L. Villeneuve and P. H. Vachon, J. Cell. Physiol., 2007, 212, 717–728 CrossRef CAS.
- T. M. Yeung, S. C. Gandhi, J. L. Wilding, R. Muschel and W. F. Bodmer, Proc. Natl. Acad. Sci. U. S. A., 2010, 107, 3722–3727 CrossRef CAS.
- N. T. Chartier, M. G. Laine, B. Ducarouge, C. Oddou, B. Bonaz, C. Albiges-Rizo and M. R. Jacquier-Sarlin, Exp. Cell Res., 2011, 317, 1422–1436 CrossRef CAS.
- A. Z. Wang, G. K. Ojakian and W. J. Nelson, J. Cell Sci., 1990, 95(Pt 1), 137–151 Search PubMed.
- Q. Guo, B. Xia, S. Moshiach, C. Xu, Y. Jiang, Y. Chen, Y. Sun, J. M. Lahti and X. A. Zhang, Eur. J. Cell Biol., 2008, 87, 251–266 CrossRef CAS.
- J. Debnath, S. K. Muthuswamy and J. S. Brugge, Methods, 2003, 30, 256–268 CrossRef CAS.
- J. Whyte, L. Thornton, S. McNally, S. McCarthy, F. Lanigan, W. M. Gallagher, T. Stein and F. Martin, J. Cell Sci., 2010, 123, 3316–3328 CrossRef CAS.
- A. Guillouzo and C. Guguen-Guillouzo, Expert Opin. Drug Metab. Toxicol., 2008, 4, 1279–1294 CrossRef CAS.
- S. Madec, V. Cerec, E. Plée-Gautier, J. Antoun, D. Glaise, J.-P. Salaun, C. Guguen-Guillouzo and A. Corlu, Drug Metab. Dispos., 2011, 39, 1987–1996 CrossRef CAS.
- M. Ishikawa, K. Sekine, A. Okamura, Y. W. Zheng, Y. Ueno, N. Koike, J. Tanaka and H. Taniguchi, J. Biosci. Bioeng., 2011, 111, 711–718 CrossRef CAS.
- B. Sainz Jr., V. TenCate and S. L. Uprichard, Virol. J., 2009, 6, 103 CrossRef.
- M. L. Marquette, D. Byerly and M. Sognier, In Vitro Cell. Dev. Biol.: Anim., 2007, 43, 255–263 CrossRef.
- W. Ma, T. Tavakoli, S. Chen, D. Maric, J. L. Liu, T. J. O'Shaughnessy and J. L. Barker, Tissue Eng. A, 2008, 14, 1673–1686 CrossRef CAS.
- R. Shamekh, D. F. Cameron, A. E. Willing and S. Saporta, Exp. Brain Res., 2006, 170, 277–284 CrossRef CAS.
- J. H. Kelly and G. J. Darlington, In Vitro Cell. Dev. Biol., 1989, 25, 217–222 CAS.
- H. Chang, C. Zhang and Y. Cao, Histochem. Cell Biol., 2012, 137, 319–327 CrossRef CAS.
- I. Behrens and T. Kissel, Eur. J. Pharm. Sci., 2003, 19, 433–442 CrossRef CAS.
- H. Stier, H. D. Fahimi, P. P. Van Veldhoven, G. P. Mannaerts, A. Volkl and E. Baumgart, Differentiation, 1998, 64, 55–66 CrossRef CAS.
- D. Fu, Y. Wakabayashi, J. Lippincott-Schwartz and I. M. Arias, Proc. Natl. Acad. Sci. U. S. A., 2011, 108, 1403–1408 CrossRef CAS.
- D. L. Esposito, F. Aru, R. Lattanzio, A. Morgano, M. Abbondanza, R. Malekzadeh, F. Bishehsari, R. Valanzano, A. Russo, M. Piantelli, A. Moschetta, L. V. Lotti and R. Mariani-Costantini, PLoS One, 2012, 7, e36190 CAS.
- G. Englund, F. Rorsman, A. Ronnblom, U. Karlbom, L. Lazorova, J. Grasjo, A. Kindmark and P. Artursson, Eur. J. Pharm. Sci., 2006, 29, 269–277 CrossRef CAS.
- K. I. Hosoya, K. J. Kim and V. H. Lee, Pharm. Res., 1996, 13, 885–890 CrossRef CAS.
- L. H. Damelin, S. Coward, S. F. Choudhury, S. A. Chalmers, I. J. Cox, N. J. Robertson, G. Revial, M. Miles, R. Tootle, H. J. Hodgson and C. Selden, Arch. Biochem. Biophys., 2004, 432, 167–177 CrossRef CAS.
- S. Wilkening, F. Stahl and A. Bader, Drug Metab. Dispos., 2003, 31, 1035–1042 CrossRef CAS.
- W. M. Westerink and W. G. Schoonen, Toxicol. in Vitro, 2007, 21, 1581–1591 CrossRef CAS.
- W. M. Westerink and W. G. Schoonen, Toxicol. in Vitro, 2007, 21, 1592–1602 CrossRef CAS.
- K. Nakamura, N. Kato, K. Aizawa, R. Mizutani, J. Yamauchi and A. Tanoue, J. Toxicol. Sci., 2011, 36, 625–633 CrossRef CAS.
- D. Mavri-Damelin, S. Eaton, L. H. Damelin, M. Rees, H. J. Hodgson and C. Selden, Int. J. Biochem. Cell Biol., 2007, 39, 555–564 CrossRef CAS.
- C. Filippi, S. A. Keatch, D. Rangar, L. J. Nelson, P. C. Hayes and J. N. Plevris, J. Hepatol., 2004, 41, 599–605 CrossRef CAS.
- F. Pampaloni, E. H. Stelzer, S. Leicht and M. Marcello, Proteomics, 2010, 10, 3394–3413 CrossRef CAS.
- L. D. Marroquin, J. Hynes, J. A. Dykens, J. D. Jamieson and Y. Will, Toxicol. Sci., 2007, 97, 539–547 CrossRef CAS.
- G. Apodaca, Nat. Cell Biol., 2010, 12, 1026–1028 CrossRef CAS.
- D. M. Bryant, A. Datta, A. E. Rodriguez-Fraticelli, J. Peranen, F. Martin-Belmonte and K. E. Mostov, Nat. Cell Biol., 2010, 12, 1035–1045 CrossRef CAS.
- K. Zhang, K. Wrzesinski, S. J. Fey, P. M. Larsen, X. Zhang and P. Roepstorff, Proteomics, 2008, 8, 4932–4945 CrossRef CAS.
- K. Zhang, K. Wrzesinski, S. J. Fey, P. M. Larsen, X. Zhang and P. Roepstorff, J. Proteomics, 2008, 71, 160–167 CrossRef CAS.
| This journal is © The Royal Society of Chemistry 2013 |