 Open Access Article
Creative Commons Attribution 3.0 Unported Licence
Self-assembly of cyclodextrin–oil inclusion complexes at the oil–water interface: a route to surfactant-free emulsions†
Baghali G.
Mathapa
and
Vesselin N.
Paunov
*
Surfactant and Colloid Group, Department of Chemistry, The University of Hull, Hull, HU6 7RX, UK. E-mail: V.N.Paunov@hull.ac.uk; Fax: +44 (0)1482 466410; Tel: +44 (0)1482 465660
First published on 31st July 2013
Abstract
We investigated the self-assembly of cyclodextrin (CD) molecules at the tetradecane–aqueous solution interface through formation of inclusion complexes (ICs). We studied the surface activity of CDs at both the air–water and the oil–water interface. Although α-CD and β-CD are not surface active at the air–water interface, they form pseudo-surfactants as inclusion complexes with linear oil molecules at the oil–water interface. We discussed the factors affecting the formation of these ICs and their assembly into microcrystals at the oil–water interface. We discovered that the morphology and the size of the aggregates formed by these ICs are dependent on the type of CD and oil used. Lamella sheets and long microrods were obtained from α-CD molecules and tetradecane. In contrast, β-CD–tetradecane gave short microrods which assembled in microcrystals. We characterised the CD–tetradecane ICs using optical microscopy, SEM, TEM and FT-IR. The crystallinity of the ICs was assessed using cross-polarised light microscopy. We demonstrated the spontaneous formation of a dense layer of adsorbed CD–tetradecane IC microcrystals at the tetradecane–water interface. At large oil volume fractions, this phenomenon led to the formation of a Pickering type of oil-in-water emulsion stabilised by adsorbed CD–oil microcrystals while at low oil volume fractions it completely solubilises the oil in the form of IC microcrystals. This emulsion stabilisation mechanism with sustainable materials like CDs may find applications in surfactant free pharmaceutical and cosmetic formulations reducing the release of surfactants in the environment.
Introduction
The design of functional nanomaterials is a subject of great interest because of their unique properties and potential applications in a wide range of fields such as medical formulations, agrochemicals, skin care/cosmetics and pharmaceuticals. Click chemistry and spontaneous self-assembly are one of the promising bottom-up approaches to form supramolecular nanomaterials from molecular building blocks by non-covalent interactions such as van der Waals and hydrogen bonding.1,2 Such self-assembly processes are reversible and simpler compared to the systems involving covalent bonds.3 Cyclodextrins (CDs) are widely used as host molecules which can form supramolecular structures. CDs are cyclic sugars derived from hydrolysis of starch by Cyclodextrin Glycosyl Transferase bacterial enzyme (CG-Tase) consisting of six (α), seven (β) and eight (γ) glucose units bridged through 1,4-glycosidic bonds.4,5 They have a cone shaped chemical structure with a hydrophobic inner cavity which allows CDs to incorporate other molecules through non-covalent interactions forming host–guest inclusion complexes (ICs). ICs are formed through a combination of size and geometric compatibility, van der Waals forces, and hydrophobic interactions between the CD cavity and the guest molecule.6 A whole small molecule or parts of a large molecule can be included in the CD cavity. The threading of several CDs onto a polymer chain results in a supramolecular “nano-necklace” often named pseudopolyrotaxane (PPR).7,8 This threading of several CD units onto a polymeric chain and close packing of CDs is aided by hydrogen bonding between the hydroxyl groups situated along the rims of the neighbouring CDs. The included polymer segments are segregated from the neighbouring polymer chains by the walls of the CD cavities and are forced to adopt highly extended conformations by the narrow host CD channels.9 The molecular “nano-necklace” may also be grown into 3D structures through formation of hydrogen bonds from hydroxyl groups on CD units between neighbouring molecular necklaces. The end capping of PPR with bulky molecules prevents CD units from slipping off thus giving rise to polyrotaxane.10CDs have different hydrophobic cavity sizes that are defined by number of glucose units and two different rims, a wider rim (named head, H) bearing only secondary hydroxyl groups and a narrower rim (named tail, T) possessing only primary hydroxyl groups.11 The presence of different numbers of hydroxyl groups has a profound influence on the physical properties of CDs. Since the threading of CDs along the polymer chain is reported to be assisted by hydrogen bonding, the way CD rims face each other along the polymeric chain length is expected to influence the morphology of the supramolecular structure.12 The isomers representing possible ways CD rims may face each other along the polymer chain have been reported as TT, HH and HT.13 One therefore expects different types of CDs to have preferred orientation along the polymeric chain which in turn determines the size, crystallinity, and morphology of the supramolecular structure and other physical properties such as aggregation behaviour.
Several research groups have reported crystalline or soluble pseudopolyrotaxanes14 from CD and linear polymer molecules. Harada and Kamachi15 reported the first example of an IC formed via the self-assembly of α-CD and poly(ethylene glycol) (PEG) and since then, other researchers have reported results obtained by using different types of CDs and polymers.9,16–19 Although the formation of CD–polymer ICs and their shape20 have already been reported before, the effect of the CD type on the aggregation behaviour of these pseudopolyrotaxanes in aqueous solution has not been fully addressed.
Herein, we report different aggregation behaviour of pseudorotaxanes between a linear alkane, n-tetradecane, and α-CD and β-CD in aqueous solutions. These ICs were formed spontaneously at the oil–water (o/w) interface by a self-assembly process without stirring or agitation. They were also alternatively formed upon dispersing n-tetradecane in CD aqueous solution by homogenization. Such ICs were found to form microcrystals which are very effective in stabilisation of Pickering types of emulsions (i.e. solid stabilised emulsions). Therefore, they can be useful in areas such as drug delivery and in a wide range of emulsion technologies where they can be used to spontaneously form Pickering emulsions. We discovered that the rate of formation of these ICs at the o/w interface and their microcrystal growth and morphology are determined by the type of CD used. We have also observed that the shapes and size of the IC structures formed were dependent on the type of CD used.
Experimental
Materials
Water was purified by passing through a reverse osmosis unit and then a Milli-Q® reagent water system (resistivity 18 MΩ cm). α-CD, β-CD and γ-CD were purchased from Sigma and used without any further purification. Tetradecane (99%) and hexadecane (99%, both from Sigma) were passed twice through chromatographic alumina (0.063–0.200 nm, Merck) in order to remove polar impurities before use. NaOH (99%) was purchased from Fisher Scientific. Urea (99%) was purchased from Sigma and used without further purification. Nile Red (98%) from Sigma was used as received.Characterisation methods
Results and discussion
Self-assembly of tetradecane–CD inclusion complexes at the o/w interface
We observed in real time the formation of microcrystals of IC (poly(pseudo) rotaxanes) due to threading of CD molecules along the tetradecane molecules at the o/w interface. The schematic of our setup used to monitor the intensity of light transmitted through the oil droplet in aqueous solution onto a CCD camera is shown in Fig. 1a. Self-assembly and threading of CDs along a single tetradecane molecule at the o/w interface form microparticles which grow and remain adsorbed at the interface which leads to scattering of light. This manifests itself as clouding at the o/w interface as visually observed in Fig. 1b. Oil droplet images of varying light intensities were captured at different time intervals to show the formation of IC microcrystals due to the CD threading and assembly at the o/w interface. From these experiments, we discovered that threading of CD along the tetradecane molecule and the microcrystal formation is dependent on the CD used and the size of its hydrophobic cavity.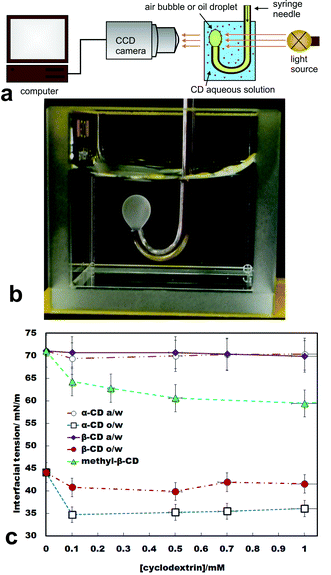 | ||
| Fig. 1 (a) Schematics of the set up for monitoring the surface tension and the formation of ICs at the tetradecane–water interface in the presence of various types of cyclodextrins. (b) Image of a tetradecane drop in 10 mM aqueous solution of α-CD in a quartz cuvette. Note the clouding caused by α-CD–tetradecane IC microcrystals formed at the o/w interface. (c) Effect of the α-CD and β-CD concentrations on the air/water surface tension and the tetradecane–water interfacial tension. We also present the effect of the methyl-β-CD concentration on the air/water surface tension. | ||
Air/water surface tension in the presence of CD
The air/water surface tension as a function of the CD concentration was measured using a Drop Shape Analyser (DSA). As shown in Fig. 1c, all non-modified CDs were non-surface active at the air/water interface. In contrast, methyl-β-CD showed measurable surface activity.Oil–water interfacial tension in the presence of CDs in the aqueous phase
CDs are known to form host–guest inclusion complexes by embedding either the entire hydrophobic guest molecule or only its hydrophobic part in their hydrophobic cavities.5,6 This process could potentially create pseudo surfactant structures between tetradecane and CDs that can self-organise at the o/w interface with the CDs acting as head groups (hydrophilic) and the remaining (non-included) part of the tetradecane hydrocarbon chain as the tail (hydrophobic). The self-organisation of these pseudo surfactants formed between tetradecane and CDs at the o/w interface was monitored by interfacial tension measurement using a sessile oil droplet sitting on the tip of the J-shaped syringe needle which allowed oil drop to be produced in a controllable way into the CD aqueous phase.Fig. 1c shows that the presence of CDs in the aqueous phase leads to a decrease in interfacial tension compared to its value in the absence of CDs. This observation suggested that the surface active material is indeed formed at the o/w interface in the presence of CDs in the aqueous solution. It was observed that at the same CD concentration in the aqueous phase, the o/w interfacial tension decreased more in the presence of α-CD compared to β-CD. In addition, we discovered that microrod-like crystals were formed at high CD concentration (10 mM). This observation suggested that threading of more than one CD molecules along a single tetradecane molecule is likely to take place at high CD concentration.
The series of images presented in Fig. 2A demonstrate that the formation of IC microrods at the o/w surface due to α-CD threading along the tetradecane is faster compared to the same phenomenon with β-CD at the same concentration (10 mM) in the aqueous phase. For instance, a tetradecane drop produced in a bath of 10 mM of α-CD aqueous solution was completely covered with the microcrystals after 12 minutes, after which it detached from the capillary tip without regaining spherical shape.
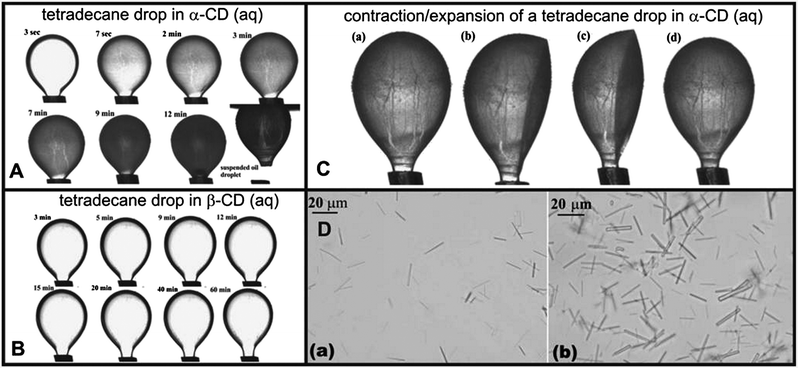 | ||
| Fig. 2 (A) Optical images showing the formation of α-CD–tetradecane ICs at the o/w interface as a function of time. Note that the oil drop gets completely coated with IC microcrystals while exposed to the α-CD solution and retains its shape after detaching from the needle tip. (B) Optical images of a tetradecane droplet in 10 mM β-CD aqueous solution captured at different times. This illustrates that compared to α-CD–tetradecane ICs, the formation of β-CD–tetradecane ICs goes at a lower rate. (C) Optical images illustrating the effect of contraction/expansion of the tetradecane drop densely coated with α-CD–tetradecane IC microcrystals on the drop shape. The images (b) and (c) indicate that the droplet remains deformed after withdrawing the core oil into the syringe; (d) the droplet goes back to its original shape after infusion with tetradecane; (D) optical micrographs of α-CD IC microcrystals collected from the area close to the o/w droplet interface – see (C). | ||
In contrast, the tetradecane drop produced in a bath of 10 mM β-CD aqueous solution remained transparent and attached to the capillary tip after 1 h of exposure (see Fig. 2B). A sample of the α-CD–tetradecane IC microcrystals was collected with a Pasteur pipette from the aqueous phase near the o/w interface and deposited directly onto a microscope glass slide. Optical microscopy observation, as shown in Fig. 2D, revealed microrod-like structures. This suggests that α-CD–tetradecane ICs are likely to involve threading of more than one CD along the length of the tetradecane molecule at the o/w interface, which allows the tetradecane molecule in the IC to reduce its exposure to the aqueous phase and form nanorods and microrods. The inherent anisotropy of the IC leads to formation of anisotropic microparticles. The growth of nanorods into microrods is supported by directional hydrogen bond networking of threaded CD hydroxyl groups on neighbouring nanorods. The growth of these nanorods into microrods and their self-assembly at the o/w interface around the oil droplet represent a different mechanism for stabilisation of o/w emulsions which starts with molecular adsorption of CD at the o/w interface but ends up as a Pickering emulsion due to the retention of the formed IC microcrystals at the interface. Upon withdrawing tetradecane from the drop, the area of the o/w interface remained approximately the same but the droplet maintained its deformed shape. This indicates that the adsorbed IC microcrystals stop the o/w interface from contracting. As seen in Fig. 2C, the droplet regained its original shape after “re-inflating” with tetradecane. This also suggests that free oil molecules in the drop are surrounded by a dense layer of entangled CD–tetradecane microcrystals. The stability of these microrods at the o/w interface is possibly enhanced by a strong hydrogen bonding network from neighbouring microrods. We also produced a completely detached oil drop stabilised by α-CD–tetradecane IC microrods which was stable and retained its original shape in α-CD aqueous solutions. This indicates the ability of the α-CD–oil microrods to stabilize the oil droplets in water as shown in Fig. 2A.
Preparation of dispersed CD–tetradecane IC microrods
We prepared these microrods by dispersing 10 μL of tetradecane in 10 mL of aqueous solutions of either α-CD or β-CD at a concentration of 10 mM. This was achieved by homogenizing the two liquid phases at 11![[thin space (1/6-em)]](https://www.rsc.org/images/entities/char_2009.gif) 000 rpm for 20 seconds with an Ultra Turrax. The morphology of CD–tetradecane microrods (α- and β-) was studied by using SEM imaging which showed different shapes and sizes of these microcrystals dependent on the type of the CD used. We observed lamella-like sheets and microrods from α-CD–tetradecane ICs as shown in Fig. 3I-a and b. In addition, the microrods from α-CD–tetradecane had a very high aspect ratio (see Fig. 3I-d). Observation over a large number of SEM images suggests that these long microrods stack together to produce the lamella-like sheets.
000 rpm for 20 seconds with an Ultra Turrax. The morphology of CD–tetradecane microrods (α- and β-) was studied by using SEM imaging which showed different shapes and sizes of these microcrystals dependent on the type of the CD used. We observed lamella-like sheets and microrods from α-CD–tetradecane ICs as shown in Fig. 3I-a and b. In addition, the microrods from α-CD–tetradecane had a very high aspect ratio (see Fig. 3I-d). Observation over a large number of SEM images suggests that these long microrods stack together to produce the lamella-like sheets.
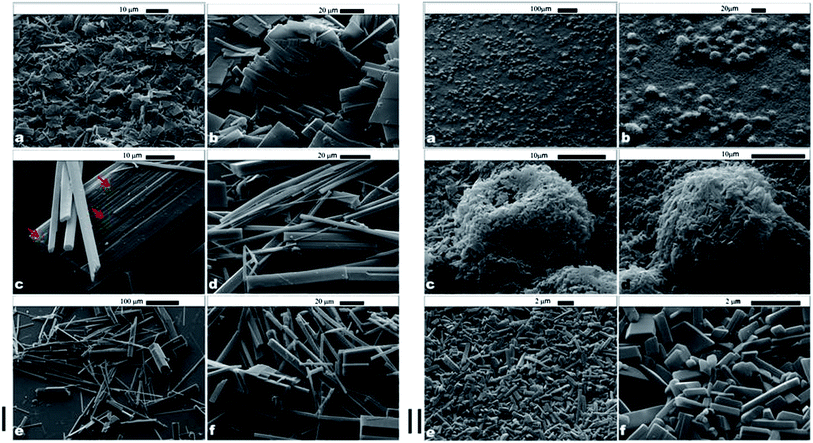 | ||
| Fig. 3 (I) α-CD–tetradecane ICs: (a) and (b) lamella plate structures; (c) lamella sheets formed from stacking of long microrods shown by red arrows; (d) long microrods responsible for forming lamella plates; (e) and (f) some IC microrods showing different cross-sectional areas. (II) β-CD–tetradecane ICs: (a) to (d) spherical structures formed by heating up of β-CD–tetradecane ICs. (e) and (f) Short microrods formed β-CD–tetradecane ICs. | ||
The stacking of α-CD–tetradecane IC microrods is indicated by red arrows in Fig. 3I-c. The staking of the α-CD–tetradecane microrods could be the result of directional hydrogen bonding between neighbouring hydroxyl groups of CD molecules threaded on parallel tetradecane molecules. The long microrods were characterised by different cross-sectional areas as shown in Fig. 3I-e and f. We also present TEM images of the same α-CD–tetradecane IC microrods in the ESI (Fig. S1†). Contrary to the microrods from ICs with α-CD, the analogous IC microrods from β-CD were shorter and did not form the lamella structures like the α-CD–tetradecane IC microrods (see Fig. 3II-e and f). The aggregation behaviour of these ICs depends on the type of CD used. While the long α-CD–tetradecane IC microrods favour stacking to give lamella plates, the shorter β-CD–tetradecane IC microrods additionally aggregate forming spherical clusters as shown in Fig. 3II-a and d. One possible reason for the latter clustering, however, could be the presence of residual oil drops.
The difference in structure and aggregation behaviour between α-CD and β-CD–tetradecane IC microrods could be explained by considering the solubility of the 3 common CDs (α, β and γ). It is well known that γ-CD, which is the largest of the three, is the most soluble while β-CD, which is in the intermediate, is the least soluble in water. These differences in the solubility of the CDs are related to the way the CD glucose units are geometrically aligned with each other. It has been proposed that in the β-CD molecule, all the 7 glucose units lie in the same plane. In this arrangement, all the glucose primary hydroxyl groups at the CD narrower end are able to form hydrogen bonds with each other. At the same time, all the secondary hydroxyl groups at the wider CD opening form hydrogen bonds with each other. The hydrogen bonding below and above the ring leads to secondary belts which increases the rigidity of the β-CD and hence causes low solubility.21 In contrast, α-CD and γ-CD do not have secondary belts hence their structures are flexible and are therefore very soluble due to the availability of free hydroxyl groups. It has been reported that that hydrogen bonding assists the threading of CD along the chain of the guest molecule.19 Using the above reasoning, since α-CD molecules have free hydroxyl groups the threading over tetradecane can occur faster than that with β-CD as confirmed by our results.
Free hydroxyl groups can also participate in hydrogen bonding with neighbouring microrods to form lamella plates and longer rods. β-CD has a more limited ability to form hydrogen bonds compared to α-CD hence the process of threading over tetradecane is slower and leads to shorter microcrystals than the ones with α-CD.
We performed control experiments by stirring 10 mL of 10 mM of aqueous solution of α-CD or β-CD without tetradecane at the same homogenisation rate and duration to check if any precipitate will be formed at room temperature. These experiments did not produce any precipitate or clouding of the solution. We therefore concluded that the micro-rod structures were not formed due to crystallisation of CDs because the concentrations of both CD aqueous solutions were lower than their maximum solubility limit at room temperature (150 mM for α-CD and 16.3 mM for β-CD). We observed the dry powder of the pure CDs with an optical microscope to see if similar aggregations were present. As shown in Fig. 4, the powder of pure CDs gave different structures from the microcrystals obtained in the presence of tetradecane which is an indication that threading of CDs on the tetradecane plays a big role in the formation and aggregation of these microrods.
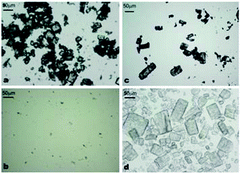 | ||
| Fig. 4 Microscope optical micrographs of: (a) pure α-CD powder; (b) saturated aqueous solution of α-CD; (c) pure β-CD powder; (d) β-CD crystals produced from supersaturated solution. | ||
Crystallinity of the CD–tetradecane IC microrods
The precipitated α-CD–tetradecane IC material had the appearance of a white and shiny solid whereas the β-CD–tetradecane IC solid was “powdery”, white and non-shiny. The difference in the crystallinity of α-CD and β-CD ICs with tetradecane was confirmed by optical microscopy in cross-polarised light. Small samples of the precipitates were withdrawn with a Pasteur pipette, then deposited directly on a clean microscope glass slide and analysed. The α-CD–tetradecane IC microrods showed some birefringence when observed under the cross-polarised light optical microscopy. However, most of the rods exhibited somehow Janus characteristics with one shiny end of the rods while the other end was less or not shiny at all (see Fig. 5b and d). This suggests that the microrods could consist of crystalline and amorphous regions. In contrast, microrods from β-CD samples did not show any birefringence.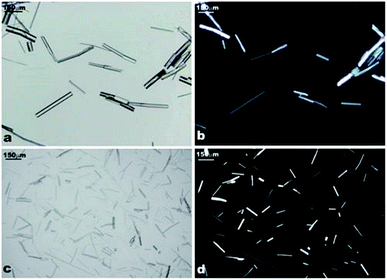 | ||
| Fig. 5 (a) and (c) Optical microscope images of α-CD–tetradecane IC microrods; (b) and (d) optical images of the same samples in cross-polarised light. | ||
This suggested that the mechanisms of packing cyclodextrin molecules to form the micro-rods were different. The free hydroxyl groups on α-CD promote well-ordered microrods as a result of hydrogen bonding leading to the crystalline structure. The more limited hydrogen bonding in β-CD is less likely to produce long ordered microrods thus leading to smaller IC microcrystals.
Factors affecting the formation of CD–tetradecane microrods and their structures
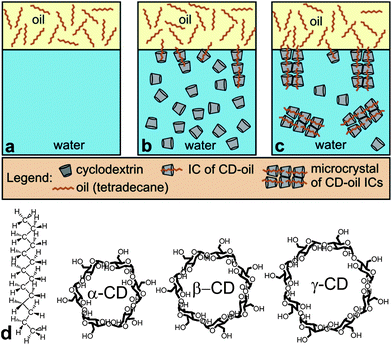 | ||
| Scheme 1 Influence of α-CD and β-CD concentrations on air–water surface tension and tetradecane–water interfacial tension. (d) Molecular structures of tetradecane, α-CD, β-CD and γ-CD. | ||
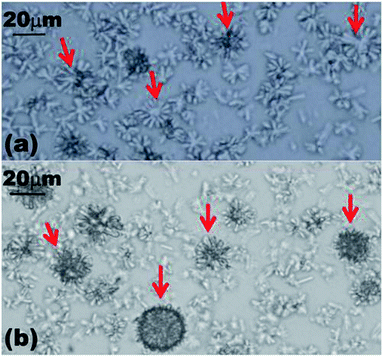 | ||
| Fig. 6 Optical images showing the formation of spherical structures by α-CD–tetradecane ICs after dissolving the microrods by heating them at 85 °C before cooling to room temperature. (a) Optical micrographs showing the process of forming spherical structures 5 minutes after the aqueous solution was deposited on the microscope glass slide from a hot bath. (b) The same sample 15 minutes later on the microscope slide. | ||
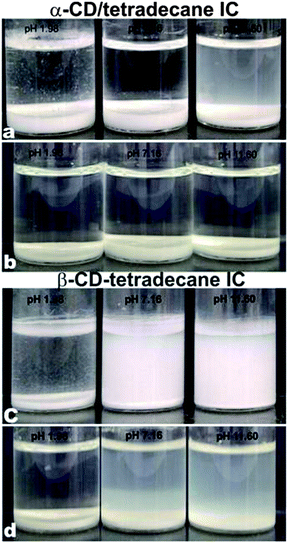 | ||
| Fig. 7 Influence of pH of the aqueous solution on the formation of microcrystals of α-CD–tetradecane ICs (a and b) and β-CD–tetradecane ICs (c and d): images (a) and (c) were captured 24 hours after the initial mixing of CD and tetradecane, while images (b) and (d) were captured after 7 days. | ||
Since the neutral threaded CDs (pH 7.16) have no electrostatic repulsion and the microrods attract each other with hydrogen bonds and van der Waals attraction among them, they would therefore aggregate and sediment due to gravity. However, when the precipitate volume fractions were analysed after 7 days, the volume fraction of the sample at low pH (1.98) had decreased more than any other samples and had the smallest volume fraction. This suggests that the α-CD microrods were not stable for a long time at low pH. This instability could be due to dissolution and de-threading of the microrods as well as hydrolysis of CDs. The microrods prepared at pH (7.16) appeared to be the most stable which indicates that uninterrupted hydrogen bonding is one of the important parameters for the formation of CD–tetradecane microrods.
In contrast, β-CD containing samples at pH 7.16 and 11.60 were turbid after 24 hours as well as after seven days. These samples showed little precipitation compared to the sample prepared at pH 1.98 which also exhibited fast precipitation. The difference in the rate of formation of the β-CD–tetradecane IC microrods and their precipitation could be attributed to the secondary belts due to intrahydrogen bonding above and below the β-CD ring. This secondary ring formations reduce the ability of β-CD hydroxyl groups to form inter-hydrogen bonding with incoming β-CD molecules on the tetradecane molecule. This therefore impedes the threading process, the growth of the microrods and their precipitation. We propose that low pH (1.98) disrupts the β-CD secondary belt hydrogen bonding. The free β-CD hydroxyls then participate in cooperative hydrogen bonding with hydroxyl groups on neighbouring β-CD to enhance the threading of other incoming CD molecules along the tetradecane chain. This leads to enhanced formation of microrods and their precipitation as shown in Fig. 7c. At pH 7.16, the secondary belts are uninterrupted and hence the threading and precipitation processes are slow. Fig. 7c and d show that the sample at pH 11.60 yielded the smallest volume fraction of the precipitate. This low yield was attributed to a combination of the slow threading process due to the secondary belts and the electrostatic repulsion between negatively charged β-CD ions at high pH (11.60).
We discovered that α-CD tetradecane microrods formed favourably at neutral pH (7.16) where the hydroxyl groups are not disturbed and fully participate in cooperative hydrogen bonding for enhanced threading and growth of the IC microrods.
In contrast, β-CD–tetradecane IC microrods were preferably formed at low pH (1.98) which was necessary to disrupt the secondary belts and free β-CD hydroxyl groups to participate in inter-cooperative hydrogen bonding to increase the rate of threading and subsequent precipitation. The rate of β-CD threading and subsequent precipitation was slow at both the o/w interface and in the bulk compared to the results with α-CD. In the ESI (Fig. S3 and S4†) we present in more detail the optical microscopy images of the morphology changes in the microcrystals of α-CD–tetradecane and β-CD–tetradecane ICs formed under different pH over the period of 7 days. Our observations show significant differences in the rate of growth of the IC microcrystals.
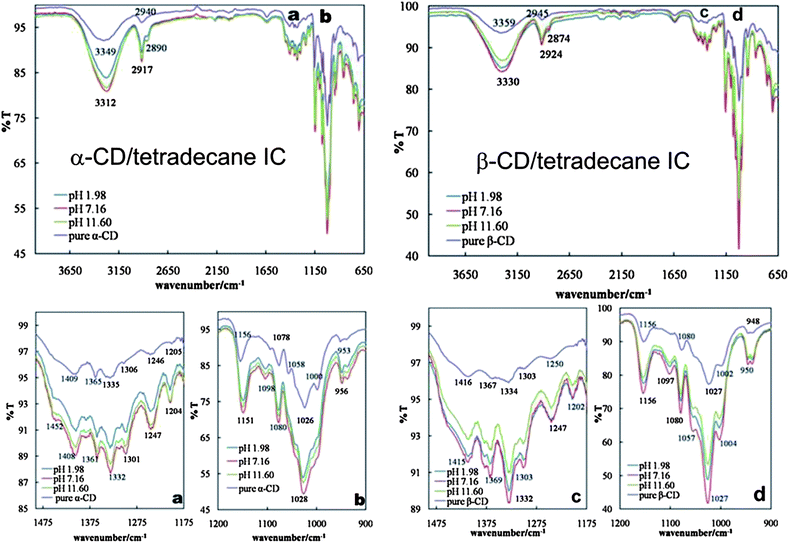 | ||
| Fig. 8 LHS images: FT-IR spectra of pure α-CD and α-CD–tetradecane ICs prepared in aqueous solutions at different pH. An expanded region labelled (a) and (b) in the main spectra is shown below. RHS images: FT-IR spectra of pure β-CD and β-CD–tetradecane ICs prepared in aqueous solutions at different pH. An expanded region labelled (c) and (d) in the main spectra is shown below. | ||
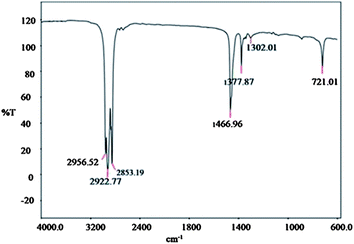 | ||
| Fig. 9 FT-IR spectrum of pure tetradecane. | ||
 | ||
| Fig. 10 Optical micrographs showing the effect of urea concentration on the size of α-CD–tetradecane IC microrods as a function of time. Row I: in 0.5 M urea (a) immediately after dispersion; (b) after 24 hours; and (c) after 3 days. Row II: in 1 M urea (a) immediately after dispersion; (b) after 24 hours; and (c) after 3 days. | ||
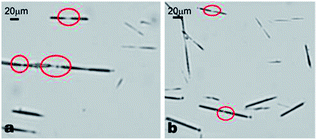 | ||
| Fig. 11 α-CD–tetradecane ICs prepared in 1 M urea solution showing some end-to-end joining which leads to their elongation with time. The end-to-end connections are highlighted by red circles. | ||
The band peaks in the tetradecane spectrum (Fig. 9) were assigned as follows: band peaks at 2922.77 cm−1 and 2853.19 cm−1 were attributed to C–H asymmetric and symmetric stretching respectively. A band peak at 1466.96 cm−1 is attributed to the C–H bending. The peaks are consistent with ref. 23.
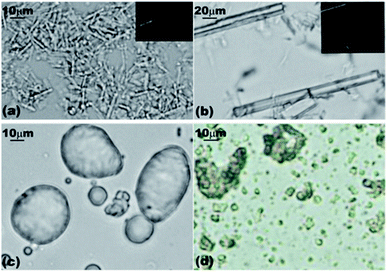 | ||
| Fig. 12 Optical microscopy images of α-CD and β-CD hexadecane ICs captured at different times: (a) α-CD-hexadecane IC precipitates immediately after dispersion; (b) α-CD-hexadecane IC microrods after 3 days; (c) β-CD-hexadecane IC structures immediately after dispersion; and (d) β-CD-hexadecane IC microcrystals after 3 days. | ||
The ability of β-CD–oil structures to serve as potential microencapsulating vehicles was probed by doping 5 mL of tetradecane with 2.5 μL of 2 × 10⁻⁴ M Nile Red in acetone. 10 μL of the Nile Red doped tetradecane was then dispersed by homogenization in 10 mL of 10 mM β-CD aqueous solution. As it can be seen in Fig. 13, most of the Nile Red is concentrated in the β-CD–tetradecane structures compared to the bulk. This showed that these structures can be useful in encapsulating oil soluble active components.
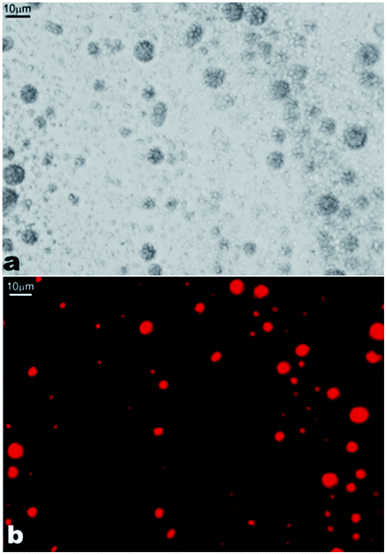 | ||
| Fig. 13 Images of the β-CD–tetradecane IC structures doped with Nile Red. (a) Optical micrograph; and (b) fluorescence microscopy image with the TRITC filter set. Nile Red fluorescence was observed using the TRITC filter set. Scale bars are 10 μm. | ||
We employed elemental analysis of our samples of α-CD, β-CD (crystals) and the inclusion complexes of these materials with tetradecane. The results for the carbon content in the samples presented here allowed us to estimate the number of α-CD and β-CD molecules threaded per molecule of tetradecane. Our data show the following approximate stoichiometries of these complexes, α-CD6.8TD1 and β-CD5.7TD1, respectively. Our results suggest that the stoichiometry is independent of the volume of the oil, as the same results were obtained by using two different amounts of TD (10 μL and 20 μL) with the same amounts of 10 mM α-CD and β-CD solution. The maximum theoretical number of CDs per stretched length of TD with 109° between C–C–C bonds was estimated to be 5.6 for both α-CD and β-CD assuming close packing of the threaded CDs. We propose that the CD–tetradecane inclusion complexes are formed by TD molecules along CD nanotubes with some additional voids with included water molecules.
Conclusions
We have demonstrated that the shape and size of aggregates from pseudo poly(rotaxane) of n-tetradecane can be tuned by the type of CD threaded along its chain length. We discovered that the α-CD inclusion complex (IC) with n-tetradecane preferentially forms long thin microrods which self-assemble further into lamella sheets in aqueous solutions. In contrast, the interaction of β-CD and n-tetradecane yielded short structures of various cross-sectional areas and these heaped up to preferentially give spherical structures in aqueous solutions. We observed “Janus microrods” when α-CD–tetradecane IC structures were examined under cross-polarised light microscopy, indicating separated crystalline and amorphous regions with varying birefringence. On the other hand, β-CD–tetradecane IC structures did not show any birefringence at all which indicates the presence of amorphous structures. Therefore, the IC crystallinity can also be tuned by selection of CD size.We also studied the effect of temperature, pH, chaotropic agent concentration and the length of the guest molecule on the formation of microcrystals of ICs with cyclodextrins. The results are important for understanding of the process of encapsulation of non-polar guest molecules in cyclodextrins which have applications in a range of cosmetics and pharmaceutical formulations. The formation of anisotropic microrods from cyclodextrin–oil ICs can also have important implications for the way of stabilisation of some oil-in-water emulsions in the presence of cyclodextrins.
Acknowledgements
B.G.M. thanks Botswana College of Agriculture for financial support of this work as a part of his PhD studies. We thank Mr Tony Sinclair for the preparation and imaging of the SEM samples and Ann Lowry for producing the TEM images.Notes and references
- K. Miyake, S. Yasuda, A. Harada, J. Sumaoka, M. Komiyama and H. Shigekawa, J. Am. Chem. Soc., 2003, 125, 5080–5085 CrossRef CAS.
- Y. He, X. Shen, Q. Chen and H. Gao, Phys. Chem. Chem. Phys., 2011, 13, 447–452 RSC.
- B. Jing, X. Chen, X. Wang, C. Yang, Y. Xie and H. Qiu, Chem.–Eur. J., 2007, 13, 9137–9142 CrossRef CAS.
- J. Szejtli, Chem. Rev., 1998, 98, 1743–1754 CrossRef CAS.
- F. Trotta, M. Zanetti and R. Cavalli, Beilstein J. Org. Chem., 2012, 8, 2091–2099 CrossRef CAS.
- M. V. Rekharsky and Y. Inoue, Chem. Rev., 1998, 98, 1875–1918 CrossRef CAS.
- M. Bonini, S. Rossi, G. Karlsson, M. Almgren, P. Lo Nostro and P. Baglioni, Langmuir, 2006, 22, 1478–1484 CrossRef CAS.
- S. Muthusubramanian, A. K. Tiwari, Sonu and S. K. Saha, Soft Matter, 2012, 8, 11072–11084 RSC.
- T. Uyar, C. C. Rusa, M. A. Hunt, E. Aslan, J. Hacaloglu and A. E. Tonelli, Polymer, 2005, 46, 4762–4775 CrossRef CAS.
- T. V. Frank van de Manakker, C. F. van Nostrum and W. E. Hennink, Biomacromolecules, 2009, 10, 3157–3175 CrossRef.
- R. Krishnan and K. R. Gopidas, J. Phys. Chem. Lett., 2011, 2, 2094–2098 CrossRef CAS.
- W.-C. Chen, S.-W. Kuo, C.-H. Lu, U. S. Jeng and F.-C. Chang, Macromolecules, 2009, 42, 3580–3590 CrossRef CAS.
- C. P. A. Anconi, C. S. Nascimento, W. B. De Almeida and H. F. Dos Santos, J. Phys. Chem. C, 2012, 116, 18958–18964 CAS.
- G. Wenz, B.-H. Han and A. Müller, Chem. Rev., 2006, 106, 782–817 CrossRef CAS.
- A. Harada, J. Li, T. Nakamitsu and M. Kamachi, J. Org. Chem., 1993, 58, 7524–7528 CrossRef CAS.
- C. Lv, X. Chen, B. Jing, Y. Zhao and F. Ma, J. Colloid Interface Sci., 2010, 351, 63–68 CrossRef CAS.
- A. E. Tonelli, Beilstein J. Org. Chem., 2012, 8, 1318–1332 CrossRef CAS.
- L. Jingye, Y. Deyue and C. Qun, Sci. China, Ser. B: Chem., 2002, 45, 73–83 Search PubMed.
- C.-W. Tu, S.-W. Kuo and F.-C. Chang, Polymer, 2009, 50, 2958–2966 CrossRef CAS.
- C. Cheng, X.-J. Han, Z.-Q. Dong, Y. Liu, B.-J. Li and S. Zhang, Macromol. Rapid Commun., 2011, 32, 1965–1971 CrossRef CAS.
- R. Guo and L. D. Wilson, Curr. Org. Chem., 2013, 17, 14–21 CrossRef CAS.
- E. Libowitzky, in Spectroscopic Methods in Mineralogy IEMU Notes in Mineralogy, ed. A. Baren, Eötvös University, Budapest, 2004, vol. 6, pp. 227–279 Search PubMed.
- G. Fang, H. Li, F. Yang, X. Liu and S. Wu, Chem. Eng. J., 2009, 153, 217–221 CrossRef CAS.
Footnote |
| † Electronic supplementary information (ESI) available. See DOI: 10.1039/c3ta12108a |
| This journal is © The Royal Society of Chemistry 2013 |
