Selective label-free detection of G-quadruplex structure of human telomere by emission spectral changes in visible-and-NIR region under physiological condition through the FRET of a two-component PPE-SO3−–Pt(II) complex ensemble with Pt⋯Pt, electrostatic and π–π interactions†
Clive Yik-Sham
Chung
ab and
Vivian Wing-Wah
Yam
*ab
aInstitute of Molecular Functional Materials (Areas of Excellence Scheme, University Grants Committee, Hong Kong, P. R. China). E-mail: wwyam@hku.hk; Fax: +852 2857 1586; Tel: +852 2859 2153
bDepartment of Chemistry, The University of Hong Kong, Pokfulam Road, Hong Kong, P. R. China
First published on 12th October 2012
Abstract
The formation of polymer–metal complex aggregates and the FRET between PPE-SO3− and several water-soluble cationic alkynylplatinum(II) complexes are revealed from UV-vis, steady-state emission and time-resolved emission decay studies. From the Stern–Volmer plots, [Pt{tpy(C6H4CH2NMe3-4)-4′}(C![[triple bond, length as m-dash]](https://www.rsc.org/images/entities/char_e002.gif) CC6H5)](OTf)2 (2) is found to be the most efficient quencher of PPE-SO3− at both low and high concentrations. This has been ascribed to its low steric bulkiness and the stronger interactions with PPE-SO3−, and hence the largest association constant with PPE-SO3−, as well as the largest Förster radius, R0, among the complexes studied. The PPE-SO3−–2 ensemble has been employed in the detection of human telomere in aqueous buffer solution (50 mM KH2PO4, pH 6.8) and found to have better selectivity than the ensemble containing [Pt(tpy)(CCC6H4CH2NMe3-4)](OTf)2 (1), which has a smaller association constant with PPE-SO3− and R0 value than 2. By modulation of the aggregation/deaggregation of the polymer–metal complex aggregates and hence the FRET from the PPE-SO3− donor to the aggregated forms of 2 as acceptor, the PPE-SO3−–2 ensemble has been demonstrated for the sensitive and selective label-free detection of human telomere via the monitoring of emission spectral changes over the visible-NIR region. Ratiometric emission of PPE-SO3−–2 ensemble at 620 and 795 nm has been shown to distinguish the G-quadruplex structure formed by human telomeric DNA from those of other G-quadruplex-forming sequences.
CC6H5)](OTf)2 (2) is found to be the most efficient quencher of PPE-SO3− at both low and high concentrations. This has been ascribed to its low steric bulkiness and the stronger interactions with PPE-SO3−, and hence the largest association constant with PPE-SO3−, as well as the largest Förster radius, R0, among the complexes studied. The PPE-SO3−–2 ensemble has been employed in the detection of human telomere in aqueous buffer solution (50 mM KH2PO4, pH 6.8) and found to have better selectivity than the ensemble containing [Pt(tpy)(CCC6H4CH2NMe3-4)](OTf)2 (1), which has a smaller association constant with PPE-SO3− and R0 value than 2. By modulation of the aggregation/deaggregation of the polymer–metal complex aggregates and hence the FRET from the PPE-SO3− donor to the aggregated forms of 2 as acceptor, the PPE-SO3−–2 ensemble has been demonstrated for the sensitive and selective label-free detection of human telomere via the monitoring of emission spectral changes over the visible-NIR region. Ratiometric emission of PPE-SO3−–2 ensemble at 620 and 795 nm has been shown to distinguish the G-quadruplex structure formed by human telomeric DNA from those of other G-quadruplex-forming sequences.
Introduction
Square-planar platinum(II) polypyridyl complexes have been reported to display a strong tendency toward the formation of highly ordered extended linear chains or oligomeric structures in the solid state1 and exhibit interesting spectroscopic properties.1–6 A particular class of platinum(II) complexes that has attracted much attention is the alkynylplatinum(II) terpyridine complexes, in which their d8–d8 metal–metal interaction and the π–π interaction of the terpyridine ligands have led to the observation of interesting spectroscopic and luminescence properties.4 In the presence of innocent anionic polyelectrolytes or biopolymers, the induced self-assembly of terpyridylplatinum(II) complexes has been found to result in remarkable UV-vis and near-infrared (NIR) emission spectral changes,4 and has been demonstrated for the detection of biomolecules4c,e–h and their related conformational changes,4c,e,f as well as probing the activities of some important biological enzymes.4e–gRecently, our group reported the induced self-assembly and FRET study of a water-soluble alkynylplatinum(II) terpyridine complex through its interactions with a non-innocent polyelectrolyte, poly(phenylene ethynylene sulfonate) (PPE-SO3−).4i PPE-SO3− belongs to a class of conjugated polyelectrolytes (CPEs) which show strong absorption and fluorescence properties similar to that of other conjugated polymers.7–12 Due to the amplified quenching effect,7a CPEs have been found to show significant changes in their emission properties with high sensitivity toward various analytes including metal ions, organic ions and biomolecules.7d–o,9b–e However, CPEs may not always give satisfactory results in selectivity as the fluorescence would be affected by non-specific interactions from various polyelectrolytes and biomacromolecules.9b,10b,11 In the study of the two-component PPE-SO3−–platinum(II) complex ensemble,4i the formation of polymer–metal complex aggregates with Pt⋯Pt, electrostatic and π–π interactions not only allows FRET from the PPE-SO3− donor to the aggregated platinum(II) complex acceptor to occur, but also gives a good selectivity and sensitivity in human serum albumin (HSA) detection in pH 3 buffer solution. This improved selectivity is likely due to the extra stabilization gained from the Pt⋯Pt and π–π interactions in addition to the electrostatic and hydrophobic interactions found in the polymer–metal complex aggregates.4i However, the selectivity of the ensemble toward HSA was found to be diminished and significant interference from anionic biopolymers such as single-stranded DNA was observed at higher pH, probably due to the electrostatic interaction between the anionic biopolymers and the cationic platinum(II) metal complex, leading to the deaggregation of the aggregates.4i
In addition to the rich spectroscopic properties, planar platinum(II) complexes are known to bind DNA13,14 and more interestingly the platinum(II) terpyridine complexes have been reported to interact with the G-quadruplex formed from human telomeres with high specificity and binding affinity.14 Telomeres are the DNA sequences capping the ends of chromosomes to protect the chromosomes from recombination, end-to-end fusion and degradation.15 The formation of a G-quadruplex from the single-stranded 3′ G-rich overhangs of telomeres has been reported to directly inhibit the activity of telomerase,16 which is closely related to aging, cancer, HIV and other diseases.17 Therefore, selective and sensitive detection of G-quadruplex structures would be very important in the rational design of drugs and the understanding of biological processes. Luminescence probes which allow non-invasive fluorescence microscopy18 would be advantageous for G-quadruplex sensing, especially for those that show NIR emission as the emission in the NIR region can minimize photo-damage to cells, increase optical transparency and lessen tissue autofluorescence.19 Although a number of luminescence probes with high specificity to G-quadruplex have been developed,12,20,21 none of them would give spectral changes in the NIR region. Moreover, the sensitivity can still be improved as most of the sensors would require the presence of G-quadruplex DNA in the micro-molar range to initiate the emission spectral changes.
In view of the fact that the PPE-SO3−–platinum(II) complex ensemble has been found to respond to HSA in the nano-molar range with spectral changes in both the visible and NIR region4i and planar platinum(II) terpyridine complexes can bind strongly to G-quadruplex with high specificity,14 it is believed that with modifications, the two-component ensemble could be a good candidate for selective and sensitive detection of G-quadruplex with remarkable UV-vis and NIR emission spectral changes. Herein, we present the synthesis and FRET study of water-soluble alkynylplatinum(II) terpyridine complexes with PPE-SO3− (Scheme 1). By comparing the selectivity of different two-component ensembles toward a number of substrates, a label-free detection of human telomeric G-quadruplex DNA with emission changes in the visible and NIR region is demonstrated by a suitable PPE-SO3−–platinum(II) complex ensemble through the modulation of the FRET properties and the assembly of the platinum(II) complexes.
 | ||
| Scheme 1 Chemical structures of complexes 1–5 and conjugated polyelectrolyte, PPE-SO3− Na+. | ||
Results and discussion
FRET study of PPE-SO3−–Pt(II) complex ensembles
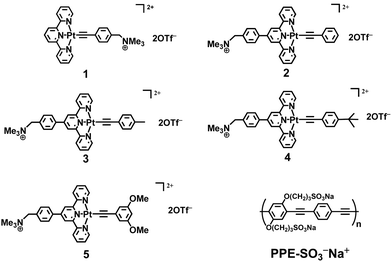
Water-soluble alkynylplatinum(II) complex 1 was synthesized according to the literature method,4d,g,i while complexes 2–5 were prepared by the reaction of functionalized alkynes with the corresponding chloroplatinum(II) precursors2a,22 and were characterized by 1H NMR, IR spectroscopy, FAB-MS and elemental analyses. These complexes with different hydrophobicity, steric bulkiness and electronic absorption behaviour were designed for the comparison of the induced self-assembly and FRET study with PPE-SO3−.The UV-vis absorption, resonance light scattering (RLS), steady-state emission spectra and time-resolved emission decay profiles of PPE-SO3− with different concentrations of complex 2 in the pH 9 buffer solution (30 mM Tris–HCl, 30 mM NaCl) are shown in Fig. S1–S4 in the ESI† respectively. Upon addition of 2, the electronic absorption spectra of PPE-SO3− show red shifts of the absorption bands centered at 337 and 440 nm to 343 and 460 nm respectively, with a well-defined isosbestic point at 374 nm. Also, a growth of the maxima at ca. 495 and 553 nm corresponding to the absorption of aggregated PPE-SO3− and the aggregated forms of complex 2 respectively is found with increasing concentration of 2 in the RLS spectra (Fig. S2†). Corresponding changes in the steady-state emission spectra are observed (Fig. S3†), with a drop of the emission centered at 535 nm and an increase in NIR emission intensity at 795 nm upon an increase in the concentration of 2 at or above 15 μM. The emission band at 535 nm is also found to be quenched, with the quenching being more effective at higher concentrations of 2 with an increased KSV value as illustrated in the Stern–Volmer (SV) plot (Fig. 1a). Similar spectral changes have been reported in the related study of PPE-SO3− with complex 1,4i indicating the formation of polymer–metal complex aggregates with Pt⋯Pt, electrostatic and/or π–π interactions. An obvious decrease in the excited state lifetimes τ1 and τ2 in the time-resolved emission decay profiles (Fig. S4 and Table S1†) has also been observed, probably resulting from the formation of polymer–metal complex aggregates that would increase the chance of interchain diffusion of excitons from PPE-SO3− to complex 2. As the absorption of the aggregated form of complex 2 would show a better spectral overlap with the emission spectrum of PPE-SO3− (Fig. S5†), it is likely that FRET would occur and contribute to the drop of the PPE-SO3− fluorescence lifetimes, τ1 and τ2, in the time-resolved emission decay profiles (Table S1†), leading to the drop in the 1π–π* fluorescence of PPE-SO3− and the growth of the triplet metal–metal-to-ligand charge transfer (3MMLCT) emission centered at ca. 795 nm at 15 μM of 2 in the steady-state emission spectra (Fig. S3†). The FRET process, which provides an additional quenching pathway on top of the ground state static quenching that mainly occurs at low concentrations of 2, would account for the increased KSV value.
 | ||
| Fig. 1 (a) Stern–Volmer (SV) plot for the quenching of PPE-SO3− by 1 (black), 2 (red), 3 (green), 4 (blue), 5 (yellow) in the aqueous buffer solution (30 mM Tris–HCl, 30 mM NaCl, pH 9.0). The concentration of sulfonate groups in PPE-SO3− (PE-SO3−) was 45 μM. I0 and I are the emission intensity at 535 nm without the complex and with different concentrations of the complex respectively. (b) The SV plot for the quenching of PPE-SO3− at low concentrations of the complexes. | ||
The spectral changes of PPE-SO3− with 3–5 are similar to that with 1 and 2, with the formation of polymer–metal complex aggregates and the FRET from PPE-SO3− to the aggregated complex moieties (Fig. S6–S14 and Table S1†). However, the quenching efficiencies of the PPE-SO3− fluorescence of 1–5 are different, which have been summarized in the SV plots in Fig. 1. It is found that the quenching efficiency of 1–5 varies linearly with the concentration of the complex at low concentrations (<3 μM) and the KSV values of the complexes are in the order of 2 > 3 > 1 > 5 > 4 (Table 1). The large KSV values suggest that the fluorescence quenching at low concentrations of the complex arises mainly from the ground state static quenching through rapid exciton diffusion along the PPE-SO3− chain to the platinum(II) complex that is bound onto the anionic polymer chain by electrostatic and/or π–π interactions. Therefore, at low concentrations of the platinum(II) complexes, the KSV value reflects the overall quenching efficiency which is related to the association constant of the cationic quencher on the anionic PPE-SO3− chain as reported in the literature.7f,k,8a,9a,c,d For 2 and 3, the additional phenyl ring at the 4′-position of the terpyridine ligand would lead to stronger π–π interaction with the PPE-SO3−, resulting in a larger association constant and thus a larger KSV value than 1. Although 5 also has an extra phenyl ring at the 4′-position of the terpyridine ligand than 1, the dimethoxy groups on the alkynyl ligand of 5 would probably present a certain extent of steric hindrance for the binding of 5 onto the PPE-SO3− chain, resulting in a smaller KSV value than 1. For 4 which has a tert-butyl group with greater steric hindrance, its KSV value is found to be the smallest amongst the complexes studied, suggesting that its high steric bulkiness would lead to weak association on PPE-SO3− and hence an inefficient quenching of the PPE-SO3− fluorescence.
| Complex | K SV a/105 M−1 s−1 | K SV b/105 M−1 s−1 | R 0 c/Å |
|---|---|---|---|
| a Stern–Volmer (SV) quenching constant calculated from the linear fit of the SV plot with concentration of the complex ranging from 0 to 3 μM. b SV quenching constant obtained at 45 μM of the complex. c Förster radius of the platinum(II) complex with PPE-SO3−. | |||
| 1 | 3.33 | 24.2 | 45 |
| 2 | 4.91 | 652.1 | 51 |
| 3 | 4.16 | 428.6 | 48 |
| 4 | 2.22 | 348.4 | 47 |
| 5 | 2.70 | 305.6 | 46 |
At higher concentrations of platinum(II) complexes, the SV plots for 1–5 are found to show an upward deviation (Fig. 1), suggesting that the fluorescence quenching of PPE-SO3− is more effective at higher concentrations of the complexes. According to the spectral changes of PPE-SO3− with the platinum(II) complexes (Fig. S1–S14†) and the reported study of PPE-SO3− with 1,4i the formation of polymer–metal complex aggregates and the FRET from PPE-SO3− to the aggregated complex moieties would enhance the fluorescence quenching, in addition to the ground state static quenching, giving rise to the increase in KSV value. The KSV values at 45 μM of the platinum(II) complexes are found to follow the order of 2 > 3 > 4 > 5 > 1 (Table 1), which are different from the order at low concentrations of the complexes. This can be explained by the fact that FRET efficiency not only depends on the distance between the donor and the acceptor which is related to the interactions between the metal complex and PPE-SO3−, but also depends on the spectral overlap between the emission spectrum of the donor and the absorption spectrum of the acceptor which can be reflected by the Förster radius, R0.23 A larger R0 value means a more effective dipole–dipole coupling between the donor and the acceptor and favours an efficient FRET to occur.23 The R0 values of the complexes with PPE-SO3− in the aqueous buffer solution (30 mM Tris–HCl, 30 mM NaCl, pH 9) are determined and are shown in Table 1. With the largest R0 value, as well as the strongest interactions with PPE-SO3− as suggested from the quenching at low concentrations, 2 is found to be the most efficient quencher of PPE-SO3−. The R0 value is found to be in the order of 2 > 3 > 4 > 5 > 1. Since 1 has the smallest R0 value, the FRET would probably be not as efficient as the other complexes which could be a reason for its small KSV value at 45 μM, despite its rather good interactions with PPE-SO3− as reflected from the quenching study at low concentrations. On the other hand, 3 is a better quencher at 45 μM than 4 and 5 as it has a larger R0 value and stronger interactions with PPE-SO3−. For 4 and 5, which have similar interactions with PPE-SO3−, the larger KSV value of 4 than 5 at 45 μM can be explained by its larger R0 value than that of 5.
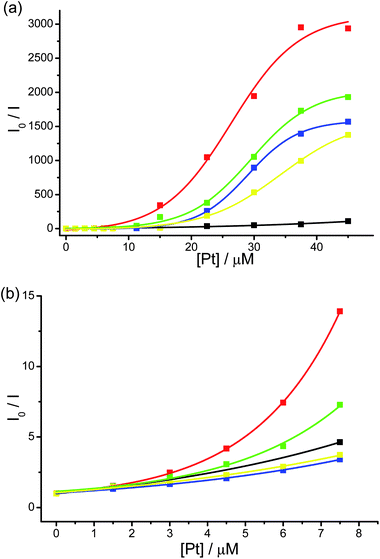
Comparison study of PPE-SO3−–Pt(II) complex ensembles in the presence of polyelectrolytes and biomolecules in physiological buffer solution
In order to investigate the correlation of the efficiency of fluorescence quenching of PPE-SO3− by the platinum(II) complexes and the interactions in the polymer–metal complex aggregates with the selectivity and sensitivity for the detection of biological samples, a comparison study of the spectral changes of the PPE-SO3−–2 ensemble with the PPE-SO3−–1 ensemble toward various biological substrates has been pursued. The PPE-SO3−–1 ensemble has been reported to have good selectivity and sensitivity toward HSA in pH 3 buffer solution, but to experience significant interference from other anionic biopolymers due to the stronger electrostatic interaction with the cationic platinum(II) complexes at higher pH.4i On the other hand, 2 is found to be a more efficient quencher of PPE-SO3− and has stronger interactions to form the polymer–metal complex aggregates than 1. As the detection of biological samples is more desirable at physiological condition, the two ensembles are studied in pH 6.8 buffer solution (50 mM KH2PO4). From the spectral changes in UV-vis absorption, RLS, steady-state emission spectra and time-resolved emission decay profiles of PPE-SO3− with different concentrations of 1 and 2, the two ensembles are both found to form polymer–metal complex aggregates with FRET from PPE-SO3− to the platinum(II) complex, similar to that in pH 9 buffer solution. This is due to the fact that there is still an electrostatic interaction between the sulfonate groups in PPE-SO3− and the platinum(II) complex as the sulfonate groups are strongly acidic (pKa = −2.6) and remain negatively charged at pH 6.8.24 The emission intensity at 795 nm of the two ensembles in the pH 6.8 aqueous buffer solution toward a number of substrates are shown in Fig. 2. Despite the significant decrease in the emission intensity, the PPE-SO3−–1 ensemble shows a lack of selectivity toward a particular substrate, probably due to the fact that the electrostatic and π–π interactions that hold the polymer–metal complex aggregate together are rather weak such that the electrostatic and π–π interactions between the substrate and the ensemble are strong enough to destroy the PPE-SO3−–1 aggregates, leading to the decrease in FRET and the drop in 3MMLCT emission. For the PPE-SO3−–2 ensemble which has stronger interactions in the polymer–metal complex aggregates as revealed from the fluorescence quenching studies, the emission at 795 nm is only responsive to the presence of human telomeric DNA among the twelve substrates tested. These, together with the lack of observable differences in the emission properties of the ensemble in the studies with 1.5 and 3 μM of duplex DNA (dA25–dT25 and dC25–dG25), respectively, where the latter should exhibit stronger electrostatic and/or π–π interactions with the ensemble, suggest that in general electrostatic and π–π interactions between the substrate and the ensemble are not strong enough for the deaggregation of the ensemble. It is only the more specific and stronger interactions found between the human telomeric DNA and the ensemble that can destroy the polymer–metal complex aggregates, leading to the decrease in FRET and the emission intensity at 795 nm. Although the spectral changes of the PPE-SO3−–2 ensemble toward human telomeric DNA are slightly smaller than those of the PPE-SO3−–1 ensemble, the significant improvement in selectivity by the stronger interactions in the polymer–metal complex aggregates makes the PPE-SO3−–2 ensemble a better candidate for the detection of human telomeric DNA in the pH 6.8 aqueous buffer solution.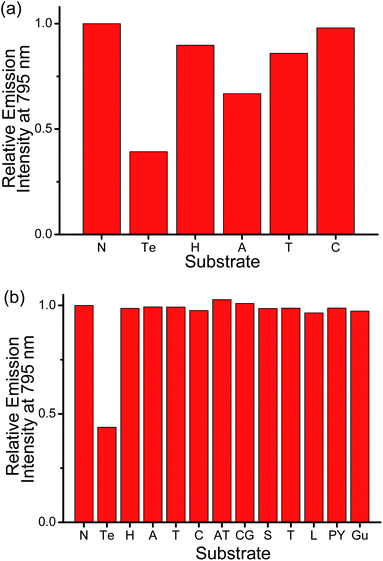 | ||
| Fig. 2 Relative emission intensity of PPE-SO3− and (a) 1 and (b) 2 at 795 nm in the presence of different substrates in the aqueous buffer solution (50 mM KH2PO4, pH 6.8). Substrate tested: N: no substrate added, Te: 3 μM human telomeric DNA (5′-TTAGGGTTAGGGTTAGGG-TTAGGGTTA-3′), H: 3 μM HSA, A: 3 μM poly(dA)25, T: 3 μM poly(dT)25, C: 3 μM poly(dC)25, AT: duplex DNA with 3 μM poly(dA)25 and 3 μM poly(dT)25, CG: duplex DNA with 3 μM poly(dC)25 and 3 μM poly(dG)25, S: 300 μM spermine, T: 3 μM trypsin, L: 3 μM lysozyme, PY: 3 μM poly(tyrosine), Gu: 300 μM guanine. Concentration of PE-SO3− and the platinum(II) complex in the final solution mixture were both 45 μM. Excitation of 1 and 2 were at 362 and 371 nm respectively. | ||
Selective label-free detection of human telomeric DNA by emission spectral changes over visible-NIR region
A more detailed spectroscopic study of the PPE-SO3−–2 ensemble with human telomeric DNA in the pH 6.8 aqueous buffer solution was performed. The electronic absorption spectra of the ensemble (Fig. S15†) show a drop of the absorption at ca. 580 nm with increasing concentrations of human telomeric DNA. Although the aggregated PPE-SO3− might contribute to a lower-energy absorption, the drop of the absorption at 580 nm, which lies in the region of the MMLCT absorption typical of alkynylplatinum(II) terpyridine complexes,4 suggests that deaggregation of the aggregated complex moieties occurs, in agreement with the emission spectral changes of the PPE-SO3−–2 ensemble with human telomeric DNA (Fig. 3 and 4). The lack of a hypsochromic shift, which is the reverse of the bathochromic shift as observed upon the addition of 2 to PPE-SO3−, in the absorption bands of the ensemble upon addition of the human telomeric DNA (Fig. S1†) indicates that some of the complex molecules would still likely bind onto the anionic PPE-SO3− in the presence of human telomeric DNA. More interestingly, the ensemble shows significant changes in the emission over the whole visible-NIR region with human telomeric DNA (Fig. 3). There is a drop in the emission intensity centered at 795 nm with a concomitant growth of the emission at both 435 and 620 nm. The two-component PPE-SO3−–2 ensemble is found to have high sensitivity towards human telomeric DNA as the spectral changes at 435, 620 and 795 nm are detectable even at a concentration of 26.7 nM telomeric DNA. The linear relationship of the emission intensity at the three distinguishable wavelengths at low concentrations of human telomeric DNA in the range of 26.7 to 112.5 nM is another attractive feature for the detection (Fig. 4). | ||
| Fig. 3 Emission spectral changes of PPE-SO3− and 2 with an increasing concentration of human telomeric DNA (26.7 nM–37.5 μM) in pH 6.8 aqueous buffer solution (50 mM KH2PO4). Concentration of PE-SO3− and 2 in the final solution mixture were both 45 μM. Excitation was at 371 nm. | ||
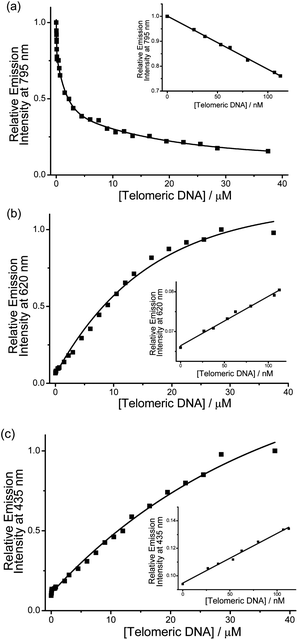 | ||
| Fig. 4 Relative emission intensity of PPE-SO3− and 2 at (a) 795 nm, (b) 620 nm and (c) 435 nm with an increasing concentration of human telomeric DNA in pH 6.8 aqueous buffer solution (50 mM KH2PO4). Concentration of PE-SO3− and 2 in the final solution mixture were both 45 μM. Excitation was at 371 nm. Inset: plot of relative emission intensity at (a) 795 nm, (b) 620 nm, and (c) 435 nm versus human telomeric DNA in the low concentration range. | ||
In order to rationalize the emission spectral changes of the ensemble with different concentrations of human telomeric DNA as well as to gain more insights into the specific interactions between the PPE-SO3−–2 ensemble and the human telomeric DNA, circular dichroism (CD) study of the PPE-SO3−–2 ensemble with different concentrations of human telomeric DNA in aqueous buffer solution (50 mM KH2PO4, pH 6.8) was conducted (Fig. 5). In the absence of human telomeric DNA, the PPE-SO3−–2 ensemble shows no observable CD signal, suggesting that the polymer–metal complex aggregates are achiral. On the other hand, with increasing concentrations of human telomeric DNA, an increase in the positive band at 290 nm and the shoulder at ca. 270 nm, which is characteristic of the “mixed-hybrid” structure of G-quadruplex reported in the literature,14,20d is found. This indicates that the human telomeric DNA exists predominantly in the “mixed-hybrid” G-quadruplex structure in the aqueous buffer solution containing the PPE-SO3−–2 ensemble. On the other hand, the CD spectra of human telomeric DNA with increasing concentrations of complex 2 revealed an increase in the positive band at 290 nm, as well as decreases in magnitude of the bands at ca. 240 and 270 nm (Fig. S16†). These CD spectral changes indicate the strong stabilization of antiparallel G-quadruplex conformation14,20d by complex 2 in the aqueous buffer solution. Similar CD spectral changes, though to smaller extents, were observed in the study of human telomeric DNA and PPE-SO3− (Fig. S17†), suggesting the stabilization of antiparallel G-quadruplex conformation by PPE-SO3−. Despite the human telomeric DNA and PPE-SO3− both being negatively charged, the effect of strong π–π interaction between the G-quadruplex DNA and the rather planar PPE-SO3− with extensive π-conjugation cannot be neglected, and hence the stabilization of antiparallel G-quadruplex conformation by the PPE-SO3− would likely be ascribed to the strong π–π interaction. Interactions of anionic conjugated polyelectrolytes with hydrophobic patches of anionic bovine serum albumin11b and stabilization of G-quadruplex structure by planar π-conjugated molecules12–14,20–22 have been reported in the literature.
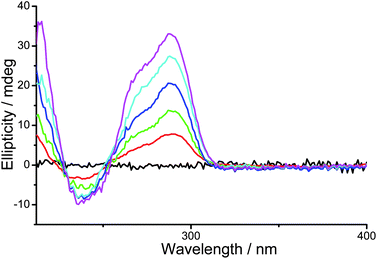 | ||
| Fig. 5 CD spectra of PPE-SO3−–2 ensemble in the aqueous buffer solution (50 mM KH2PO4, pH 6.8) with 0 μM (black), 0.75 μM (red), 1.5 μM (green), 2.25 μM (blue), 3 μM (cyan) and 3.75 μM (magenta) of human telomeric DNA. Concentrations of PE-SO3− and 2 in the final solution mixture were both 45 μM. | ||
The interactions between the ensemble and human telomeric DNA have also been investigated by the UV-vis spectroscopic study using the Scatchard equation25a (Fig. 6) and UV melting study20b,25b (Fig. S18†). The binding constant of the polymer–metal complex aggregates on the human telomeric DNA deduced from the Scatchard equation25a is found to be 8.3 × 10⁷ M−1, while the binding constants on the duplex dA25–dT25 and dG25–dC25 (4.4 × 10⁵ M−1 and 7.4 × 10⁵ M−1 respectively) are at least 111-fold smaller than that with human telomeric DNA. The binding constant of complex 2 on the telomeric DNA in the absence of PPE-SO3− (1.0 × 10⁷ M−1; Fig. S19 and S20†) is also significantly larger than the binding constants of 2 with duplexes dA25–dT25 and dG25–dC25 (4.5 × 10⁵ and 7.5 × 10⁵ M−1 respectively). These, together with the fact that the duplex DNAs do not show much effect on the emission of the ensemble at 795 nm (Fig. 2b), suggest that the specific interactions between the ensemble and human telomeric DNA should not be originated only from the G-rich sequence that is similar to that reported of the binding of cisplatin to DNA,13 but rather more unique interactions should be found between the ensemble and the G-quadruplex structure of human telomeric DNA in the aqueous buffer solution. On the other hand, a UV melting study20b,25b of the human telomeric DNA in aqueous buffer solution (50 mM KH2PO4, pH 6.8) revealed a significant increase in the melting temperature of the G-quadruplex (Tm) in the presence of the ensemble (65 °C) or complex 2 (58 °C), when compared to the Tm without the ensemble or complex 2 (51 °C) (Fig. S18 and S21; Table S2†). This indicates the strong binding affinity as well as the stabilization of the G-quadruplex of the human telomeric DNA by the ensemble and complex 2. Together with the fact that a number of square planar platinum(II) complexes have been reported to bind to G-tetrad as well as the loop adenines of the G-quadruplex through electrostatic and π–π interactions with high specificity and binding affinity over duplex DNA,14,20f it is likely that the cationic complex 2 would have strong interactions with the G-quadruplex formed from the human telomeric DNA, leading to the disassembly of the polymer–metal complex aggregates as well as the stabilization of G-quadruplex DNA.
![A plot of D/Δεapp against D. D is the concentration of the base pairs of human telomeric DNA and Δεapp = [εA − εF], where εA is calculated from the observed absorbance at 580 nm divided by the concentration of PPE-SO3−–2 ensemble (45 μM) and εF is the molar extinction coefficient of the unbound ensemble at 580 nm.](/image/article/2013/SC/c2sc20897k/c2sc20897k-f6.gif) | ||
| Fig. 6 A plot of D/Δεapp against D. D is the concentration of the base pairs of human telomeric DNA and Δεapp = [εA − εF], where εA is calculated from the observed absorbance at 580 nm divided by the concentration of PPE-SO3−–2 ensemble (45 μM) and εF is the molar extinction coefficient of the unbound ensemble at 580 nm. | ||
With the specific binding of the ensemble onto human telomeric G-quadruplex DNA and the stabilization of the G-quadruplex structure by complex 2 as suggested from the UV-vis absorption and CD experiments, the emission spectral changes of the ensemble over the visible-NIR region with different concentrations of human telomeric DNA (Fig. 3 and 4) may be interpreted as follows. The decrease in emission intensity at 795 nm is likely due to the deaggregation of the polymer–metal complex aggregates with Pt⋯Pt, electrostatic and π–π interactions through the strong and specific interactions with the human telomeric DNA, leading to the decrease in FRET from the PPE-SO3− donor to the aggregated 2 moieties. Combined with the fact that the G-quadruplex has a more condensed structure with higher space charge density than single-stranded DNA,12a the stronger electrostatic interaction of the cationic platinum(II) complex with the G-quadruplex than other anionic biopolymers would favour the deaggregation of the PPE-SO3−–2 ensemble. These further explain the high selectivity of the ensemble toward the human telomeric DNA over the other biological substrates tested. For the increase in emission intensity at 620 nm with human telomeric DNA, this would likely be ascribed to the emission of the non-aggregated complex 2 moieties after the deaggregation of the ensemble, and the emission origin is tentatively assigned as the admixtures of triplet metal-to-ligand charge transfer (3MLCT) and triplet ligand-to-ligand charge transfer (3LLCT) states. This assignment is further supported by the emergence of the emission band centered at 643 nm in the study of complex 2 and human telomeric DNA (Fig. S22†).26 In addition, given the fact that hydrophobic interactions between alkynylplatinum(II) terpyridine complexes and adenine bases of poly(dA)25 have been reported to result in 3MLCT/3LLCT emission typical of the monomeric complex molecules,4c the growth of the emission of the ensemble at 620 nm would likely be attributed to the non-aggregated complex 2 molecules bound onto the human telomeric DNA which contains loop adenines. On the other hand, deaggregation of the ensemble would lead to the decrease in FRET, resulting in the recovery of the PPE-SO3− fluorescence which probably accounts for the growth of the emission at 435 nm. The blue shift of the emission of PPE-SO3− compared to the emission in aqueous buffer solution is likely due to the π–π interaction of the human telomeric DNA with PPE-SO3−, so that PPE-SO3− would be in a more hydrophobic environment.27 A similar blue shift in the emission of conjugated polyelectrolyte with increasing concentration of phospholipid has been reported in the literature, and has been rationalized by the hydrophobic interactions between the polymer backbone and the phospholipid.7m
It is worth noting that the deaggregation of the polymer–metal complex aggregates with the turn-off of the 3MMLCT emission at 37.5 μM of human telomeric DNA (only ca. 15% of the emission without human telomeric DNA) is different from the reported study on the induced self-assembly of alkynylplatinum(II) terpyridine complexes by G-quadruplex with remarkable 3MMLCT emission enhancement.4e,f One of the reasons would be the concentration ratio of negative charges on the DNA to platinum(II) complex, which is found to be 22.5![[thin space (1/6-em)]](https://www.rsc.org/images/entities/char_2009.gif) :1 in the present study, while the ratios in the previous works are 2.7:14e and 2.1:1,4f respectively. Such a high ratio in the present study would lead to “dilution” of the local concentration of platinum(II) complex moieties, thus resulting in deaggregation and the diminution of the 3MMLCT emission.
:1 in the present study, while the ratios in the previous works are 2.7:14e and 2.1:1,4f respectively. Such a high ratio in the present study would lead to “dilution” of the local concentration of platinum(II) complex moieties, thus resulting in deaggregation and the diminution of the 3MMLCT emission.
The possible interference from other biological substrates on the emissions at the three distinguishable wavelengths of the ensemble has also been probed (Fig. 2b and 7). The emission of the ensemble at 435 nm, which should originate from the 1π–π* fluorescence of PPE-SO3−, is found to be affected significantly by various substrates (Fig. 7a). For example, HSA and poly(dA)25 would lead to ca. 4- and 2.5-fold enhancement of the emission intensity, respectively, which are even larger than the enhancement by human telomeric DNA (ca. 2.4-fold). This can be explained by the fact that the fluorescence of CPEs have been reported to be affected by the presence of polyelectrolytes.9b,10b,11 Although these biological substrates will not destroy the polymer–metal complex aggregates, they can still interact with PPE-SO3− by electrostatic and/or π–π interactions and this in turn results in changes in the emission intensity of the polymer. On the other hand, the emission bands of the ensemble at 620 and 795 nm show much better and even excellent selectivity, respectively, toward human telomeric DNA (Fig. 2b and 7b). This is because the two emissions are closely related to the deaggregation/aggregation process of the polymer–metal complex aggregates. Among the substrates tested, only the G-quadruplex structure formed by human telomeric DNA would show strong interactions with the cationic square planar platinum(II) complex 2, thus resulting in the deaggregation and unique spectral changes in the emissions at the two different wavelengths. Competition experiments on the detection of human telomeric DNA by the ensemble in the presence of various biological substrates have also been performed and the discrepancy on the emission intensities at 620 and 795 nm is found to be small as compared to the emission intensities in the presence of human telomeric DNA (Fig. 8). Therefore, in addition to the high sensitivity toward the detection of the target which is commonly observed in the sensing study of CPEs,7d–o,9b–e the strong Pt⋯Pt, electrostatic and π–π interactions in the polymer–metal complex aggregates and the FRET from PPE-SO3− to the aggregated 2 can significantly enhance the selectivity for the detection of human telomeric DNA by monitoring the 3MLCT/3LLCT and 3MMLCT emission of the non-aggregated and aggregated platinum(II) complex respectively. Together with the NIR emitting feature of the 3MMLCT emission, the PPE-SO3−–2 ensemble is especially attractive and should represent the first reported example that shows spectral changes in both the visible and NIR region with high sensitivity and selectivity toward human telomeric DNA according to the best of our knowledge.
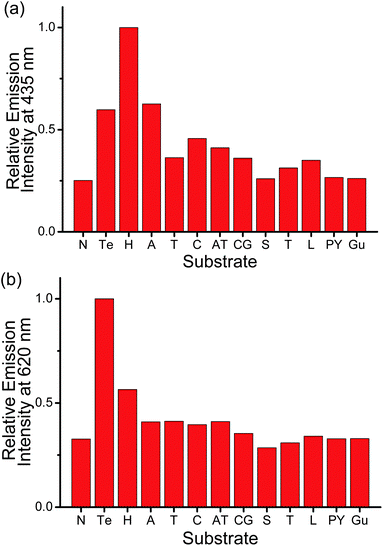 | ||
| Fig. 7 Relative emission intensity of PPE-SO3− and 2 at (a) 435 nm and (b) 620 nm in the presence of different substrates in the aqueous buffer solution (50 mM KH2PO4, pH 6.8). Substrate tested: N: no substrate added, Te: 3 μM human telomeric DNA, H: 3 μM HSA, A: 3 μM poly(dA)25, T: 3 μM poly(dT)25, C: 3 μM poly(dC)25, AT: duplex DNA with 3 μM poly(dA)25 and 3 μM poly(dT)25, CG: duplex DNA with 3 μM poly(dC)25 and 3 μM poly(dG)25, S: 300 μM spermine, T: 3 μM trypsin, L: 3 μM lysozyme, PY: 3 μM poly(tyrosine), Gu: 300 μM guanine. Concentration of PE-SO3− and 2 in the final solution mixture were both 45 μM. Excitation was at 371 nm. | ||
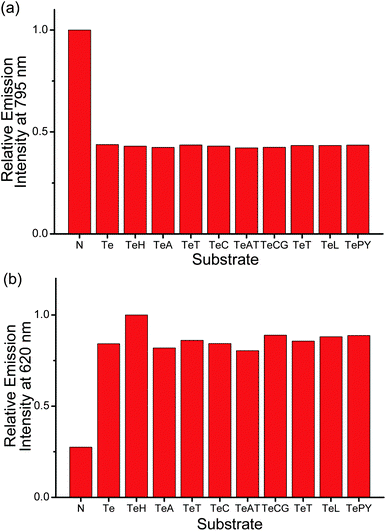 | ||
| Fig. 8 Relative emission intensity of PPE-SO3− and 2 at (a) 795 nm and (b) 620 nm in the presence of different substrates in the aqueous buffer solution (50 mM KH2PO4, pH 6.8). Substrate tested: N: no substrate added, Te: 3 μM human telomeric DNA, TeH: 3 μM human telomeric DNA + 3 μM HSA, TeA: 3 μM human telomeric DNA + 3 μM poly(dA)25, TeT: 3 μM human telomeric DNA + 3 μM poly(dT)25, TeC: 3 μM human telomeric DNA + 3 μM poly(dC)25, TeAT: 3 μM human telomeric DNA + duplex DNA with 3 μM poly(dA)25 and 3 μM poly(dT)25, TeCG: 3 μM human telomeric DNA + duplex DNA with 3 μM poly(dC)25 and 3 μM poly(dG)25, TeT: 3 μM human telomeric DNA + 3 μM trypsin, TeL: 3 μM human telomeric DNA + 3 μM lysozyme, TePY: 3 μM human telomeric DNA + 3 μM poly(tyrosine). Concentration of PE-SO3− and 2 in the final solution mixture were both 45 μM. Excitation was at 371 nm. | ||
As a number of DNA sequences in human genome has been reported to form G-quadruplex structures,28 an attempt in distinguishing the G-quadruplex structure formed by human telomeric DNA from other G-quadruplex structures28b has been made. By UV melting assays,20b,25b complex 2 is found to stabilize the G-quadruplex structures formed by bcl-2, c-kit and c-myc, as revealed from the increase in melting temperatures compared to the values without complex 2 (Table S2†). This suggests that complex 2 would show strong interactions with these G-quadruplex structures, similar to those observed in the study with human telomeric DNA. The emission spectra of the PPE-SO3−–2 ensemble in the aqueous buffer solution (50 mM KH2PO4, pH 6.8) with different concentrations of bcl-2, c-kit and c-myc are shown in Fig. S24–S26† respectively. The two-component ensemble is found to show a decrease in emission intensity centered at 795 nm and a growth of emission at 435 nm with increasing concentration of bcl-2, c-kit and c-myc. According to the study of the ensemble with human telomeric DNA, these emission spectral changes would likely be attributed to the strong and specific interactions between the polymer–metal complex aggregates and the G-quadruplex DNAs, resulting in deaggregation and the decrease in FRET. Interestingly, emergence of an emission band at 620 nm, which is observed in the study of the ensemble and human telomeric DNA, cannot be found in the presence of bcl-2, c-kit or c-myc. This could be rationalized by fewer loop adenines in the G-quadruplex structures formed by bcl-2, c-kit and c-myc, as well as the different G-quadruplex structures of c-kit and c-myc from the structure of human telomeric DNA.28 Based on the significant decrease in 3MMLCT emission intensity at 795 nm and the growth of 3MLCT/3LLCT emission at 620 nm of the deaggregated complex 2 molecules, which would probably interact with loop adenines and G-tetrad of human telomeric DNA, ratiometric emission of the ensemble at 620 and 795 nm, I620/I795, is found to be able to distinguish human telomeric DNA from bcl-2, c-kit and c-myc, with interference of less than 29% at 10 μM of the DNAs (Fig. 9). Together with the self-calibrating feature brought by the ratiometric measurement, the PPE-SO3−–2 ensemble could be a potential candidate in distinguishing human telomeric DNA from other G-quadruplex DNAs.
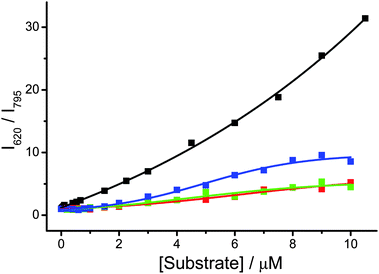 | ||
| Fig. 9 Ratiometric emission of PPE-SO3− and 2 at 620 and 795 nm in the aqueous buffer solution (50 mM KH2PO4, pH 6.8) with different concentration of human telomeric DNA (black), bcl-2 (red), c-kit (green) and c-myc (blue). Concentration of PE-SO3− and 2 in the final solution mixture were both 45 μM. Excitation was at 371 nm. | ||
Conclusions
The interactions between PPE-SO3− and water-soluble cationic alkynylplatinum(II) complexes have been reported. With different hydrophobicity, steric bulkiness and R0 values, the platinum(II) complexes have been found to show different association constants as well as quenching efficiencies on PPE-SO3− fluorescence as indicated from the KSV values. 2 is found to be the most efficient quencher and shows the largest association constant on PPE-SO3−, thus probably forming the polymer–metal complex aggregates with the strongest interactions compared to the other complexes studied. The PPE-SO3−–2 ensemble has been demonstrated to have much better selectivity in the detection of human telomere in aqueous buffer solution (50 mM KH2PO4, pH 6.8) than the PPE-SO3−–1 ensemble, as stronger and more specific electrostatic and π–π interactions between the cationic square planar platinum(II) complex and the G-quadruplex formed from human telomeric DNA are required to destroy the polymer–metal complex aggregates with stronger interactions in the PPE-SO3−–2 ensemble. The emission spectral changes over the visible-NIR region, which are modulated by the aggregation/deaggregation of the polymer–metal complex aggregates and the FRET from the PPE-SO3− donor to the aggregated form of 2 as acceptor, allow the PPE-SO3−–2 ensemble to serve as an attractive candidate for the label-free detection of human telomere with high sensitivity and selectivity.Acknowledgements
V.W.-W.Y. acknowledges support from the University Grants Committee Areas of Excellence Scheme (AoE/P-03/08), the Research Grants Council of Hong Kong Special Administrative Region, China (HKU 7064/11P) and a Collaborative Research Fund (CRF) grant (HKUST2/CRF/10). C.Y.-S.C acknowledges the receipt of a Postgraduate Studentship administered by The University of Hong Kong. We are thankful to Prof. P. Li and Dr E. K.-M. Ho at The Hong Kong Polytechnic University for their technical assistance in the ultrafiltration characterization. Dr A. Y.-Y. Tam is acknowledged for his helpful discussions.Notes and references
-
(a) R. S. Osborn and D. Rogers, J. Chem. Soc., Dalton Trans., 1974, 1002 RSC
; (b) K. W. Jennette, J. T. Gill, J. A. Sadownick and S. J. Lippard, J. Am. Chem. Soc., 1976, 98, 6159 CrossRef CAS
-
(a) V. W. W. Yam, R. P. L. Tang, K. M. C. Wong and K. K. Cheung, Organometallics, 2001, 20, 4476 CrossRef CAS
-
(a) K. M. C. Wong, W. S. Tang, X. X. Lu, N. Zhu and V. W. W. Yam, Inorg. Chem., 2005, 44, 1492 CrossRef CAS
-
(a) C. Yu, K. M. C. Wong, K. H. Y. Chan and V. W. W. Yam, Angew. Chem., Int. Ed., 2005, 44, 791 CrossRef CAS
-
(a) H. K. Yip, C. M. Che, C. M. Zhou and T. C. W. Mak, J. Chem. Soc., Chem. Commun., 1992, 1369 RSC
-
(a) F. Camerel, R. Ziessel, B. Donnio, C. Bourgogne, D. Guillon, M. Schmutz, C. Iacovita and J. P. Bucher, Angew. Chem., Int. Ed., 2007, 46, 2659 CrossRef CAS
-
(a) Q. Zhou and T. M. Swager, J. Am. Chem. Soc., 1995, 117, 12593 CrossRef CAS
-
(a) B. S. Harrison, M. B. Ramey, J. R. Reynolds and K. S. Schanze, J. Am. Chem. Soc., 2000, 122, 8561 CrossRef CAS
-
(a) L. Chen, D. W. McBranch, H. L. Wang, R. Helgeson, F. Wudl and D. Whitten, Proc. Natl. Acad. Sci. U. S. A., 1999, 96, 12287 CrossRef CAS
-
(a) K. E. Achyuthan, T. S. Bergstedt, L. Chen, R. M. Jones, S. Kumaraswamy, S. A. Kushon, K. D. Ley, L. Lu, D. McBranch, H. Mukundan, F. Rininsland, X. Shi, W. Xia and D. Whitten, J. Mater. Chem., 2005, 15, 2648 RSC
-
(a) J. J. Lavigne, D. L. Broughton, J. N. Wilson, B. Erdogan and U. H. F. Bunz, Macromolecules, 2003, 36, 7409 CrossRef CAS
-
(a) F. He, Y. Tang, S. Wang, Y. Li and D. Zhu, J. Am. Chem. Soc., 2005, 127, 12343 CrossRef CAS
-
(a) K. W. Jennette, S. J. Lippard, G. A. Vassiliades and W. R. Bauer, Proc. Natl. Acad. Sci. U. S. A., 1974, 71, 3839 CrossRef CAS
-
(a) H. Bertrand, D. Monchaud, A. D. Cian, R. Guillot, J. L. Mergny and M. P. Teulade-Fichou, Org. Biomol. Chem., 2007, 5, 2555 RSC
- C. W. Greider, Proc. Natl. Acad. Sci. U. S. A., 1998, 95, 90 CrossRef CAS
- D. E. Gilbert and J. Feigon, Curr. Opin. Struct. Biol., 1999, 9, 305 CrossRef CAS
-
(a) M. Gellert, M. N. Lipsett and D. R. Davies, Proc. Natl. Acad. Sci. U. S. A., 1962, 48, 2013 CrossRef CAS
- H. R. Kermis, Y. Kostov, P. Harms and G. Rao, Biotechnol. Prog., 2002, 18, 1047 CrossRef CAS
-
(a) E. Soini and I. Hemmila, Clin. Chem., 1979, 25, 353 CAS
-
(a) J. L. Mergny, L. Lacroix, M. P. Teulade-Fichou, C. Hounsou, L. Guittat, M. Hoarau, P. B. Arimondo, J. P. Vigneron, J. M. Lehn, J. F. Riou, T. Garestier and C. Hélène, Proc. Natl. Acad. Sci. U. S. A., 2001, 98, 3062 CrossRef CAS
-
(a) J. Alzeer, B. R. Vummidi, P. J. C. Roth and N. W. Luedtke, Angew. Chem., Int. Ed., 2009, 48, 9362 CrossRef CAS
-
(a) K. Sonogashira, S. Takahashi and N. Hagihara, Macromolecules, 1977, 10, 879 CrossRef CAS
-
(a) T. Förster, Ann. Phys., 1948, 2, 55 CrossRef
- K. A. Schug and W. Lindner, Chem. Rev., 2005, 105, 67 CrossRef CAS
-
(a) C. V. Kumar and E. H. Asuncion, J. Am. Chem. Soc., 1993, 115, 8541 Search PubMed
- At relatively low concentrations of human telomeric DNA, induced self-assembly of complex 2 occurs through electrostatic interaction with the anionic DNA, resulting in a significant growth of 3MMLCT emission intensity (Fig. S22†) which was similar to those reported previously in ref. 4e and f. On the other hand, at higher concentrations of human telomeric DNA, the larger number of negatively charged telomeric DNA molecules as well as the presence of a larger number of hydrophobic G-tetrad and loop adenines would likely result in re-distribution of the complex 2 molecules, leading to a reduced self-aggregation of the complex and the observation of 3MLCT/3LLCT emission at 643 nm (Fig. S22†).
- A control experiment on PPE-SO3− with increasing concentrations of human telomeric DNA revealed a quenching of the PPE-SO3− emission at 550 nm and a growth of a higher-energy emission centered at 435 nm (Fig. S23†). These, together with the CD spectral changes of human telomeric DNA in the presence of PPE-SO3− (Fig. S17†), suggest that PPE-SO3− would probably bind onto the G-quadruplex DNA through π–π interaction.
-
(a) S. Burge, G. N. Parkinson, P. Hazel, A. K. Todd and S. Neidle, Nucleic Acids Res., 2006, 34, 5402 CrossRef CAS
Footnote |
| † Electronic supporting information (ESI) available: experimental details, electronic absorption spectra, steady-state emission spectra, time-resolved emission decay profiles, resonance light scattering (RLS) and table summarizing the parameters obtained from the time-resolved emission decay profiles of PPE-SO3− with different concentrations of 2–5, electronic absorption and emission spectra of PPE-SO3− and 2 with an increasing concentration of human telomeric DNA, bcl-2, c-kit and c-myc, UV melting assays. See DOI: 10.1039/c2sc20897k |
| This journal is © The Royal Society of Chemistry 2013 |