Preparation and characterization of a biodegradable hydrogel containing oligo(2,2-dimethyltrimethylene carbonate) moieties with tunable properties
Changjiang
Fan
a,
Chao
Zhang
b,
Yihan
Jing
b,
Liqiong
Liao
*a and
Lijian
Liu
a
aDepartment of Polymer Science, Wuhan University, Wuhan, Hubei 430072, P. R. China. E-mail: liqiongliao@whu.edu.cn
bSchool of Engineering, Sun Yat-sen University, Guangzhou, Guangdong 510006, P. R. China
First published on 13th November 2012
Abstract
A series of biodegradable hydrogels based on oligo(2,2-dimethyltrimethylene carbonate)-block-poly(ethylene glycol)-block-oligo(2,2-dimethyltrimethylene carbonate) diacrylate (DPD-DA) precursor with varied length of hydrophilic poly(ethylene glycol) (PEG) segment and hydrophobic oligo(2,2-dimethyltrimethylene carbonate) (ODTC) segment were prepared by photopolymerization. Hydrophobic interaction was found to affect the properties of the hydrogel. The elastic modulus and toughness of the hydrogel could be tuned by altering the lengths of the hydrophobic ODTC segment as well as the hydrophilic PEG segment. In a monolayer culture, the number of swine cartilage chondrocytes (SCCs) attached to the hydrogel surface increased along with an increase in the length of ODTC segment in the precursor. SCCs cultured on the surface of hydrogel and photo-encapsulated in the hydrogel demonstrated comparable cytocompatibility with the widely recognized PEG hydrogel.
Introduction
Due to their hydrophilic nature and similarity to mammalian tissue, hydrogels based on synthetic or natural polymers have been extensively studied as tissue engineering scaffolds to mimic the micro-environment of cells.1–7 Among the synthetic hydrogels, poly(ethylene glycol) (PEG) hydrogels have been extensively studied although it is considered to be non-biodegradable under physiological conditions.8–14 The degradation of a hydrogel scaffold may affect secretion of extracellular matrix (ECM) in three-dimensional culture of cells.15 Incorporation of biodegradable segments into the PEG backbone, such as poly(lactic acid) (PLA),11,15–17 poly(ε-caprolactone) (PCL),12,13 and poly(trimethylene carbonate) (PTMC),14 is a commonly used strategy to fabricate biodegradable PEG hydrogels. Aliphatic polycarbonate hydrogel has emerged14,18,19 as a new class of biodegradable tissue engineering scaffold with unique degradation products, diols and carbon dioxide,20 which are believed to be much less acidic compared to those of PLA, and thus will not seriously deactivate the growth and differentiation factors during degradation.21 Varghese et al.18 reported a biodegradable hydrogel from oligo(trimethylene carbonate)-PEG-oligo(trimethylene carbonate) diacrylate precursor; excellent toughness of hydrogels, enhanced adhesion and spreading of mesenchymal stem cells on the surface of polycarbonate hydrogels was observed when compared with pure PEG hydrogels.In cartilage tissue engineering, a scaffold with both appropriate elastic modulus and toughness is highly desirable.22 Generally, increasing the concentration of precursor or decreasing the molecular weight of precursor would increase the crosslink density and result in elevated elastic modulus and brittleness of hydrogel.23
In addition to covalent bonding that constructs the backbone of the hydrogel network, hydrophobic interaction, hydrogen bonding, and static charge interactions can be used to enhance the inter-/intra-molecular interactions between polymer chains and so help maintain the physical properties of the hydrogel. Hydrophobic interaction is an efficient strategy to improve the physical and mechanical properties of the hydrogel.24–28 Recently, Li et al. synthesized a hydrophobically associated hydrogel with high mechanical strength,26 the hydrophobic side chains assembled into aggregates, which served as physical crosslinked points in the hydrogel which act to dissipate energy. A report by Dijkstra et al.27 showed that hydrogel nanoparticles based on eight-armed poly(ethylene glycol)-poly(trimethylene carbonate) acrylate (PEG-(PTMC9)8) block copolymers was prepared through hydrophobic aggregation and subsequent photo-crosslinking, and the results obtained suggest that photopolymerization occurred only in hydrophobically associated PTMC domains in which the acrylate end-groups are condensed.
Due to the presence of methyl groups on the side chain of poly(dimethyltrimethylene carbonate) (PDTC), stronger intermolecular hydrophobic interaction is foreseeable compared to poly(trimethylene carbonate) (PTMC); this has been evidenced by the much lower critical micelle concentration of PDTC–PEG–PDTC triblock copolymers than that of PTMC–PEG–PTMC micelles in aqueous solution.29,30 In the present work, a hydrogel based on oligo(2,2-dimethyltrimethylene carbonate)–PEG-oligo(2,2-dimethyltrimethylene carbonate) (ODTC–PEG–ODTC) diacrylate was prepared by UV photopolymerization. Hydrophobic interaction in the hydrogel can be adjusted by altering the chain length of the hydrophilic (PEG) and hydrophobic (ODTC) segments. By varying the length of the ODTC segment in the triblock copolymer precursor, hydrogels with tunable mechanical properties (both modulus and toughness) were prepared. The swelling ratio, interior morphology, degradability, and cytocompatibility of this type of hydrogel is evaluated in detail.
Materials and methods
Materials
Poly(ethylene glycol)s (PEGs) with molecular weights of 6000 g mol−1 (PEG6K) and 20![[thin space (1/6-em)]](https://www.rsc.org/images/entities/char_2009.gif) 000 g mol−1 (PEG20K) were purchased from Shanghai Chemical Reagent Co. (China), precipitated in ether and dried under vacuum before use. Lipase from porcine pancreas (EC3.1.1.3, PPL) and Irgacure 2959 (2-hydroxy-4′-(2-hydroxyethoxy)-2-methylpropiophenone) was purchased from Sigma and used as received. Acryloyl chloride was distilled before use. Stannous 2-ethylhexanoate (Sn(Oct)2) was obtained from Shanghai Chemical Reagent Co. (China) and used after distillation under reduced pressure. Toluene and tetrahydrofuran (THF) werer refluxed over CaH2 and distilled before use. 2,2-Dimethyltrimethylene carbonate (DTC) was synthesized and purified according to literature.19
000 g mol−1 (PEG20K) were purchased from Shanghai Chemical Reagent Co. (China), precipitated in ether and dried under vacuum before use. Lipase from porcine pancreas (EC3.1.1.3, PPL) and Irgacure 2959 (2-hydroxy-4′-(2-hydroxyethoxy)-2-methylpropiophenone) was purchased from Sigma and used as received. Acryloyl chloride was distilled before use. Stannous 2-ethylhexanoate (Sn(Oct)2) was obtained from Shanghai Chemical Reagent Co. (China) and used after distillation under reduced pressure. Toluene and tetrahydrofuran (THF) werer refluxed over CaH2 and distilled before use. 2,2-Dimethyltrimethylene carbonate (DTC) was synthesized and purified according to literature.19
Synthesis of precursors
A series of ODTC–PEG–ODTC (abbreviated as DPD) triblock copolymers were synthesized. Briefly, PEG, DTC, and Sn(Oct)2 (0.1% molar ratio to DTC) were sealed in a silanized glass ampoule under vacuum (<50 Pa). The sealed ampoule was immersed in an oil bath at 140 °C for 24 h and 120 °C for another 24 h. After being cooled to room temperature, the product was dissolved in dichloromethane, precipitated in ether, filtered, and dried in vacuum.The DPD diacrylate (DPD-DA) precursor was synthesized by endcapping DPD triblock copolymer with acrylate group. The dried copolymer (0.8 mmol) was dissolved in 150 mL of toluene and refluxed at 140 °C for 5 h; azeotropic distillation was performed to remove trace amounts of water. Subsequently, the reaction mixture was cooled to room temperature and 3.2 mmol of triethylamine was added. The reaction mixture was further cooled to 0 °C, and 3.2 mmol of acryloyl chloride in 10 mL of THF was added dropwise to the reaction mixture and stirred for 2 h. After that, the reaction mixture was stirred at 40 °C for 12 h. The reaction mixture was then filtered; the filtrate was concentrated, precipitated in excessive anhydrous ether, and dried in vacuum. The precursor was further purified by dialysis in deionized water and lyophilized. For the cell culture experiment, the precursor solution after dialysis was filter-sterilized through a 0.22 μm membrane filter and lyophilized.
Preparation of hydrogels
Solution of DPD-DA precursor (10%, g mL−1) and Irgacure 2959 (0.05%, g mL−1) in phosphate buffered saline (PBS, pH 7.4) in cylindrical molds (diameter 8 mm, height 4.2 mm) was exposed to 365 nm UV light (30 mW cm−2) for 5 min to form hydrogels, and then the hydrogels were removed from the molds and washed in fresh PBS before further characterization.Isolation and culture of swine cartilage chondrocytes (SCCs)
Swine cartilage chondrocytes (SCCs) were isolated and cultured according to established protocol.18,31 Chondrocyte culture medium (CCM) (Dulbecco's Modified Eagles Medium (DMEM high glucose, Hyclone) supplemented with 10 mM HEPES, 0.1 mM nonessential amino acids, 0.4 mM proline, 50 mg L−1 Vitamin C, 10% fetal bovine serum, and 1% penicillin-streptomycin (PenStrep, Invitrogen)) was used in the isolation, expansion, and in the following experiments. Passage 1 cells were used for monolayer culture and three-dimensional encapsulation.Three-dimensional (3D) photoencapsulation of SCCs
A mixture of precursor (10%, g mL−1) and Irgacure 2959 (0.05%, g mL−1) in PBS was prepared under the asepsis condition. SCCs were suspended at a density of 20 × 106 cells mL−1 in sterilized PBS containing precursor and photoinitiator. 60 μL of the SCCs suspensions was transferred to a cylindrical mold and exposed to 365 nm UV light for 5 min. After photopolymerization, the cell-laden constructs were transferred to a 24-well plate containing chondrocyte culture medium and incubated at 37 °C in 5% CO2 atmosphere.Proton nuclear resonance spectroscopy (1H NMR)
The 1H NMR spectra of the precursor was recorded on a Mercury VX-300 spectrometer (Varian, USA) using tetramethylsilane (TMS) as internal standard and d-cholorform as solvent.Rheological study
Steady shear viscosity of 10% precursor aqueous solution was performed on a Haake RS 600 rheometer equipped with concentric cylinder (DG41Ti, height 33 mm, gap 5 mm). The shear rate was increased from 0.01 to 1 s−1 (25 °C).Interior morphology of the hydrogel
Fully swollen hydrogel was frozen in liquid nitrogen and then freeze-dried for two days. The freeze-dried hydrogel was fractured carefully in liquid nitrogen, sputtered-coated with gold, and examined by a scanning electron microscope (SEM, FEI-QUANTA 200, Holland). The wall thickness and pore size was manually measured on the SEM picture; and the mean value of width and height of a pore was defined as pore size.Swelling and degradation behavior
Synthesized hydrogels were immersed in distilled water for three days to reach the swelling equilibrium and the unreacted precursor washed off. The samples were weighed (Ws0) after wiping off the water on the surface and weighed (Wd0) after dried under vacuum at room temperature for two days. Samples (n = 5) were incubated in a lipase solution (0.2 mg mL−1) at 37 °C with mild shaking,33 taken out at predetermined time and dried under vacuum to measure the dry weight (Wdt) of the hydrogels. Fresh enzyme solution was replaced every other day. The swelling ratios and weight loss fraction was determined as follows:| Equilibrium swelling ratio = Ws0/Wd0 |
| Weight loss fraction% = (1 − Wdt/Wd0) × 100 |
Determination of crosslink density
The crosslink density and mesh size of hydrogels was calculated based on a modified Flory–Rehner equation for hydrogels prepared in the existence of water.1 Volume fractions before and after fully swelling of hydrogels were calculated with the following formulas: | (1) |
 | (2) |
Where Vp is the volume of dry polymer; υ2,r and υ2,s is polymer volume fractions in the relaxed and swollen state, respectively; Vg,r and Vg,s is volume of hydrogels before and after swelling, respectively.
The molecular weight between crosslinks (Mc) of the hydrogel can be determined by equation:
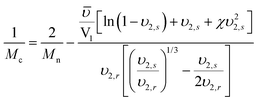 | (3) |
Where Mn is the molecular weight of the precursor, ![[small upsilon, Greek, macron]](https://www.rsc.org/images/entities/i_char_e0d5.gif) is the specific volume of the polymer, V1 is the molar volume of water (18 cm3 mol−1), χ is the Flory polymer–solvent interaction parameter. The values of χ (0.426) and
is the specific volume of the polymer, V1 is the molar volume of water (18 cm3 mol−1), χ is the Flory polymer–solvent interaction parameter. The values of χ (0.426) and ![[small upsilon, Greek, macron]](https://www.rsc.org/images/entities/i_char_e0d5.gif) (0.893 cm3 g−1) of PEG were used as that of the copolymer, assuming the short ODTC segments do not significantly change the value of χ and
(0.893 cm3 g−1) of PEG were used as that of the copolymer, assuming the short ODTC segments do not significantly change the value of χ and ![[small upsilon, Greek, macron]](https://www.rsc.org/images/entities/i_char_e0d5.gif) .32
.32
The effective crosslink density (νe) of hydrogel was calculated by the following formula:
 | (4) |
Mesh size (ξ) is defined as the average linear distance between two neighboring cross-link joints and can be obtained by the following equation:9
 | (5) |
Where  is the root-mean-square of end-to-end distance of the polymer chain in unperturbed state and can be calculated by the following equation:
 | (6) |
 | (7) |
Where L is the average bond length (0.146 nm for PEG), and Cn is the Flory characteristic ratio of the polymer (4.0 for PEG). Mr is the molecular weight of repeating units in polymer chain, and N is the number of repeating units per chain between crosslinks.
Mechanical test
Fully swollen hydrogels in PBS were taken for the mechanical test. Compression test was performed on an Instron 3342 Universal Testing System (Instron, Norwood, MA, USA) equipped with a Model 2519-104 force transducer at a compression rate of 0.5 mm min−1. The elastic modulus of hydrogel was calculated from the slope of the initial linear range of stress-strain curve according to Hookean model.18 Toughness was defined as the area integration of stress-strain curves until to fracture points and calculated using Origin 8 software. Five samples for each type of hydrogel were examined in this experiment.Two-dimensional (2D) culture of SCCs
The precursor solution (10%, g mL−1) was photopolymerized in a mold with thickness of 1 mm under 365 nm UV light (30 mW cm−2) for 5 min, using Irgacure 2959 (0.05%, g mL−1) as the photoinitiator. After photopolymerization, the hydrogel sheet was immersed in PBS for 48 h to leach out un-reacted precursor, and then cut into 1 × 1 cm pieces. The 1 × 1 cm piece of the hydrogel was sterilized in 70% ethanol for 24 h, followed by washing in PBS with 2% PenStrep for another 24 h. Then the hydrogel was incubated in CCM for 24 h in a 24-well plate. SCC suspensions were seeded on top of the hydrogel at a density of 1 × 10⁵ cells/well. The hydrogel sheet with SCCs was incubated at 37 °C in 5% CO2 atmosphere for one hour to allow cell adhesion, after that 1 mL of CCM was added to each well. Pictures were taken under microscope at two hours and three days to examine the cell adhesion and spreading by counting the cell number and observing the morphologies of cells on the surface of the hydrogels.MTT assay
Hydrogels were fabricated on the bottom of the wells of 96-well plate, and sterilized according to the same protocol as the two-dimensional culture of SCCs. SCCs with density of 5 × 10³ cells/well in 200 μL of CCM was seeded on top of the hydrogel and incubated at 37 °C in 5% CO2 atmosphere. After 1, 3, and 5 days, the culture medium was removed; 180 μL of DMEM and 20 μL of MTT (3-(4,5-dimethylthiazole-2-yl)-2,5-diphenyltetrazolium bromide, 0.5 mg mL−1 in PBS) solution was added to each well and incubated for four hours. 200 μL of dimethyl sulfoxide (DMSO) was added after DMEM and MTT solution was removed, and the 96-well plate was shaken at a speed of 100 rpm for 30 min in an incubator. The solution was transferred into another 96-well plate, and the absorbance was measured at 570 nm on a plate reader (Bio-tek Synergy MX, USA).Cell viability
SCCs were encapsulated in the hydrogel by photopolymerization of cell suspension in the precursor solution.18 Cell viability was investigated using a Live/Dead assay kit after 24 h of 3D photo-encapsulation. Thin slices of the cell-laden construct were incubated in Live/Dead assay dye solution (0.5 μL of calcein-AM dye and 2.0 μL of ethidium homodimer-1 dye in 1 mL of high glucose DMEM) for 30 min. After incubation, the construct slices were rinsed with PBS and observed under fluorescence microscope (OLYMPUS-LX71 Inverted Microscope with U-RFL-T Fluorescence lamp). The viability of SCCs was evaluated by counting the live cells, which were stained with green dye, relative to the total cells (stained with green and red dye) presented in the fields.Statistical analysis
The degree of statistical significance between the experimental data of two groups was estimated by Student's t-test. Statistical significance was defined as p ≤ 0.05 and the values in this article were reported as means ± standard deviation (SD).Results and discussion
Synthesis of the precursor
A typical 1H-NMR spectrum of DPD-DA precursor was shown in Fig. 1. The peaks at δ 4.1 ppm (–O–CH2–) and δ 1.4 ppm (–CH3) belong to protons in the repeating unit of the ODTC segments. The peak at δ 3.66 ppm (–CH2–CH2–O–) can be assigned to protons in the repeating unit of PEG segment. The peak at δ 3.74 and 4.29 ppm (-PEG–CH2–CH2–O-DTC-) belongs to protons in the methylene groups close to ODTC segments in PEG. The peaks at δ 5.86–6.44 ppm belong to the diacrylate end group of DPD-DA precursor. The degree of polymerization (DP) of DTC repeating unit in the copolymer was calculated using integral intensities of –CH3– (δ 1.4 ppm) from ODTC and –CH2– (δ 3.66 ppm) from PEG as previously described.19 The degree of acrylation of the precursors was 65%–70% (Table 1).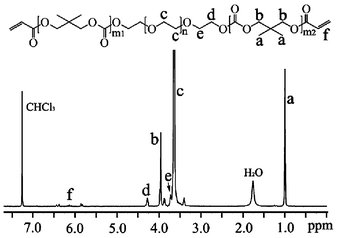 | ||
| Fig. 1 1H NMR spectrum of DPD-DA2. | ||
| Hydrogel | Precursor | PEG | DPDTC | Degree of acrylation (%) |
|---|---|---|---|---|
| Gel-1 | DPD-DA1 | PEG6K | 2.4 | 66.4 |
| Gel-2 | DPD-DA2 | PEG6K | 5.4 | 68.3 |
| Gel-3 | DPD-DA3 | PEG6K | 8.0 | 65.6 |
| Gel-4 | DPD-DA4 | PEG20K | 4.8 | 67.4 |
Physical properties
Crosslink density is a key structural parameter of the hydrogel. Since the hydrogel network is formed by covalent bonding between acrylate end groups of precursors, the crosslink density of the hydrogel can be adjusted by tuning the molecular weight of the corresponding precursor.34 As for Gel-2 and Gel-4, with the molecular weight of PEG segment in the precursor increasing from 6000 (DPD-DA2) to 20![[thin space (1/6-em)]](https://www.rsc.org/images/entities/char_2009.gif) 000 g mol−1 (DPD-DA4), the crosslink density of the hydrogel decreased from 574.7 ± 16.7 to 149.6 ± 6.5 mol m−3 (Table 2).
000 g mol−1 (DPD-DA4), the crosslink density of the hydrogel decreased from 574.7 ± 16.7 to 149.6 ± 6.5 mol m−3 (Table 2).
| Hydrogel | Equilibrium swelling ratioa | M c (g mol−1) | ν e (mol m−3) | ξ (nm) |
|---|---|---|---|---|
| a Values of equilibrium swelling ratio, Mc, νe, and ξ were means ± SD (n = 4). | ||||
| Gel-1 | 21.4 ± 2.2 | 2259.2 ± 97.8 | 496.4 ± 22.5 | 8.8 ± 0.4 |
| Gel-2 | 19.3 ± 1.9 | 1962.9 ± 94.2 | 574.7 ± 16.7 | 7.6 ± 0.3 |
| Gel-3 | 15.4 ± 0.2 | 1635.8 ± 20.5 | 684.7 ± 8.5 | 6.5 ± 0.06 |
| Gel-4 | 43.2 ± 2.8 | 7495.4 ± 320.2 | 149.6 ± 6.5 | 19.9 ± 0.9 |
Besides chemical crosslinking, hydrophobic interaction between the ODTC segments also contributes to the crosslink density in that the hydrophobic interaction may increase the apparent crosslink density of hydrogel. Rheometric measurements of precursors were performed to evaluate the hydrophobic interaction between ODTC segments in the precursors (Fig. 2). For precursors with the same length of hydrophilic PEG segment (PEG6K), the viscosity of their solutions follows the trend of DPD-DA3 > DPD-DA2 > DPD-DA1 due to the increase in the chain length of hydrophobic ODTC segment. In addition to the hydrophobic segment, hydrophilic block can also affect the rheological behavior of precursor in solution. For example, DPD-DA2 and DPD-DA4 have similar length of ODTC segment, while DPD-DA2 has a hydrophilic PEG segment with molecular weight of 6000 g mol−1 that is much shorter than that in DPD-DA4 (20![[thin space (1/6-em)]](https://www.rsc.org/images/entities/char_2009.gif) 000 g mol−1); thus DPD-DA2 tends to have stronger intermolecular hydrophobic interaction compared with DPD-DA4, and this was validated by the significantly higher viscosity of DPD-DA2 in solution, especially at low shear rate. Due to the highly dynamic motion of hydrophilic PEG block in water, the hydrophobic interaction of the DPD-DA decreased as the PEG block length increased.35 This phenomenon indicates the hydrophobic-hydrophilic interaction of amphiphilic precursor in aqueous is not only governed by the length of hydrophobic segment but also affected by the hydrophilic moieties.36
000 g mol−1); thus DPD-DA2 tends to have stronger intermolecular hydrophobic interaction compared with DPD-DA4, and this was validated by the significantly higher viscosity of DPD-DA2 in solution, especially at low shear rate. Due to the highly dynamic motion of hydrophilic PEG block in water, the hydrophobic interaction of the DPD-DA decreased as the PEG block length increased.35 This phenomenon indicates the hydrophobic-hydrophilic interaction of amphiphilic precursor in aqueous is not only governed by the length of hydrophobic segment but also affected by the hydrophilic moieties.36
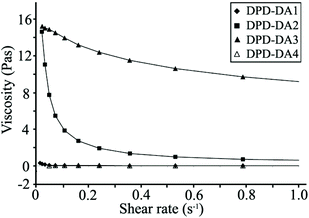 | ||
| Fig. 2 Steady shear viscosity of precursor solutions. | ||
The disruption of physical crosslinking of amphiphilic block copolymers in solution is usually characterized by the so-called shear-thinning effect.37 In this study, obvious shear thinning behaviors were observed for DPD-DA2 and DPD-DA3, and the viscosity of DPD-DA2 and DPD-DA3 solution was higher than DPD-DA1 and DPD-DA4 solution. When increasing the shear rate, the viscosity of the DPD-DA2 solution decreased rapidly, while the viscosity of the DPD-DA3 solution decreased more slowly. The shear-thinning pattern of the DPD-DA3 solution suggested a strong intermolecular hydrophobic interaction, which is beneficial to the formation of physically crosslinked hydrogel.25 Different viscosity and shear-thinning patterns of these precursor solutions reflected the structural characteristics and hydrophobic-hydrophilic interaction of different precursors.
The above rheological observations showed that stronger intermolecular hydrophobic interactions can be achieved by increasing the chain length of ODTC. According to Dijkstra and co-workers,27 acrylate end-groups are condensed in hydrophobic domains in aqueous solution of amphiphilic PEG–(PTMC9)8 precursor; when applying UV irradiation to the solution, radical polymerization of the acrylate end-groups mainly occurs in the hydrophobic PTMC domain, which in turn further confines the PTMC segment as well as polyacrylate main chain in this hydrophobic domain after polymerization as evidenced by NMR spectroscopy. The apparent crosslink density of hydrogel, which can be attributed to both chemical and physical crosslinking, increases upon increasing intermolecular hydrophobic interactions between ODTC segments in the hydrogel while keeping the same hydrophilic segment length. For example, when the degree of polymerization (DP) of DTC in the ODTC segment increased from 2.4 (DPD-DA1) to 5.4 (DPD-DA2) and 8.0 (DPD-DA3) with a constant length of PEG (PEG6K), Mc of corresponding hydrogel decreased from 2259.2 ± 97.8 to 1962.9 ± 94.2 and 1635.8 ± 20.5 g mol−1, and the crosslink density of hydrogel increased from 496.4 ± 22.5 to 574.7 ± 16.7 and 684.7 ± 8.5 mol m−3 (Table 2). For the hydrogel with lower Mc and higher crosslink density, the equilibrium swelling ratio of hydrogels is lower and showed a tendency of Gel-4 > Gel-1 > Gel-2 > Gel-3.
Interior morphologies of the fully swollen hydrogels were examined by SEM (Fig. 3). Three-dimensional porous structure was observed for all the hydrogels. The pore structure and pore size of the hydrogel is obviously related to the molecular weight of the precursor. The pore of hydrogels changed from a well defined structure with thick-wall (Gel-1, Gel-2 and Gel-3) to a loose structure with thin-wall (Gel-4), and the average diameters of pores increased from about 100 to 200 μm. With the increase of the molecular weight of precursor, the crosslink density decreased (Table 2) and caused a looser interior structure of the hydrogel.38
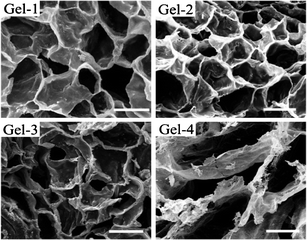 | ||
| Fig. 3 SEM images of the hydrogels, scale bar: 100 μm. | ||
Mechanical property
The mechanical properties of the above hydrogels were investigated using unconfined compression tests. Hydrogels can be seen as modified elastomer,39 and according to rubber elasticity theory, the elastic modulus (E) for imperfect rubber elasticity can be expressed by the equation as modified by L. Brannon-Peppas et al.:39 | (8) |
Where ρ is the density of the polymer, ν is the Poisson's ratio, T is the temperature, ro2/rf2 is the ratio of the end-to-end distance in a real network versus that in the isolated chains and is approximated 1,28 and Mn is the number-average molecular weight of the precursor.
From the above equation, it can be deduced that the elastic modulus of the hydrogel is affected by both Mn and Mc at given temperature.
From Gel-1 to Gel-3, Mc decreased obviously from 2259.2 ± 97.8 to 1635.8 ± 20.5 g mol−1 because of the strong hydrophobic interaction between the ODTC segment, and Mn increased appreciably from 6312 to 7040 g mol−1, resulting in the increase of elastic (compressive) modulus from 19.8 to 34.7 kPa (Table 3). The increase of elastic modulus can also be observed from Fig. 4(A), which showed an obvious increase of the slope of the initial stress-strain curves from Gel-1 to Gel-3.
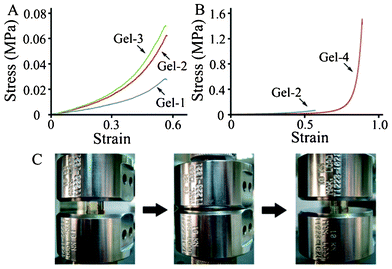 | ||
| Fig. 4 (A, B) Representative stress-strain curves. (C) Photographs of Gel-4 during the compression test over one strain cycle, reaching 92% strain. | ||
| Sample | Toughness (kJ/m3) | Elastic modulus (KPa) | Fracture stress (KPa) | Fracture strain (%) |
|---|---|---|---|---|
| Gel-1 | 5.6 ± 0.8 | 19.8 ± 1.6 | 30.3 ± 3.2 | 61.0 ± 6.1 |
| Gel-2 | 10.0 ± 1.1 | 30.8 ± 1.4 | 54.5 ± 9.3 | 61.0 ± 3.7 |
| Gel-3 | 13.4 ± 0.5 | 34.7 ± 5.5 | 71.9 ± 11.5 | 66.3 ± 4.5 |
| Gel-4 | 92.0 ± 5.7 | 10.1 ± 0.4 | 1477.5 ± 139.1 | 96.0 ± 3.3 |
Hydrogel with lower Mc and higher crosslink density usually exhibits higher elastic modulus and lower fracture stress/toughness. Surprisingly, from Gel-1 to Gel-3, both the fracture stress and toughness increased with the decrease of the Mc. This can be attributed to the increasing hydrophobic interaction of the ODTC segment. Aggregates formed by the hydrophobic interaction of the ODTC segments result in both increased crosslink density and elastic modulus; however, the reversible nature of physical crosslinking40 can help sustain an efficient stress/energy dissipation by temporary loss of its secondary structure and thus improve the fracture stress and toughness of the hydrogel. This result showed that both the elastic modulus and fracture stress/toughness of the hydrogel can be enhanced through hydrophobic interaction.
For Gel-4 with much higher Mc, the hydrogel is lightly crosslinked and the fracture stress was 1477.5 ± 139.1 kPa (Table 3) with a low elastic modulus of 10.1 ± 0.4 kPa. In addition, Gel-4 exhibited a good recoverability (Fig. 4(c)) after compression. Similar phenomena was reported by Varghese et al. for hydrogel prepared from PTMC–PEG–PTMC precursor.18 Deformation and fracture of the hydrogels under stress can be regarded as the process of absorbing and dissipating energy through the polymer chains.41,42 The flexible polymer chains adopt random coil conformation before applying stress, and the polymer chains ruptured by Lake–Thomas mechanism after the chains become fully extended and store enough energy (fracture energy) till fracture under stress.43,44 Compared to the energy needed for fully extending the polymer chain, fracture energy contributes to the dominant term in total energy. However, Gel-2 and Gel-4 with similar length of ODTC segment exhibit significant difference in fracture strain and toughness (Table 3 and Fig. 4(B)).
According to classical thermodynamics and Flory-elasticity theory, the force (ƒ) which resists against deformation can be expressed as:45
 | (9) |
Where T is temperature, S is entropy and L is the deformation ratio. The decrease in entropy and the increase in deformation ratio of hydrogel lead to the increase of ƒ.45
Fig. 5 illustrated the proposed mechanism of conformational change of polymer chains of Gel-2 and Gel-4 in the process of deformation under stress. In Fig. 5(A) and (C), the polymer chains exist as random coil before compression and the chains are extended under stress (Fig. 5(B) and (D)).41–44 In the lightly crosslinked network with high fracture stain of 96%, the polymer chains in Gel-4 became parallel and perpendicular to the direction of stress (Fig. 5(D)), however the parallel alignment of polymer chains in Gel-2 may be hindered by the highly crosslinked network structure (Fig. 5(B)). The parallel alignment of polymer chain in Gel-4 caused the decrease of entropy of the polymer chains,45 thus resulted in an increase of ƒ and higher fracture stress/toughness.
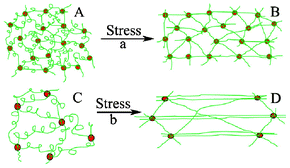 | ||
| Fig. 5 Schematic diagram of the structure changes of Gel-2 (a) and Gel-4 (b) under stress. | ||
Enzymatic degradation
Previous study revealed the molecular weight of PPL was about 45![[thin space (1/6-em)]](https://www.rsc.org/images/entities/char_2009.gif) 000–50
000–50![[thin space (1/6-em)]](https://www.rsc.org/images/entities/char_2009.gif) 000 Da.46 The hydrodynamic radius (Rh) of PPL was about 4.5 nm according to the following equation,47 which is much smaller than the mesh sizes of the above hydrogels (6.5–19.9 nm) (Table 2) and may lead to rapid diffusion of enzyme into the hydrogel network.
000 Da.46 The hydrodynamic radius (Rh) of PPL was about 4.5 nm according to the following equation,47 which is much smaller than the mesh sizes of the above hydrogels (6.5–19.9 nm) (Table 2) and may lead to rapid diffusion of enzyme into the hydrogel network.
R h = 0.0229M1/2W
It can be then deduced that after a short time of initial diffusion of enzymes into the hydrogel network, the enzyme may be uniformly distributed inside and outside the hydrogel.12 Michaelis–Menten (MM) enzyme kinetics can be used to predict the enzyme degradation of hydrogel. The equation is written as:12
 | (10) |
Where N and N0 are the number of ODTC block after and before degradation. k and c were the deactivation constant and initial concentration of the lipase in enzyme solution. k* is the degradation constant and it is mainly related to the concentration of substrate, in this case, the ODTC block.12 According to the above equation, the increase of DP of ODTC is beneficial to the degradation rate of this hydrogel.
Hydrogels based on PEG6K (Gel-1, Gel-2 and Gel-3) have close mesh sizes, and thus the differences in diffusion velocities of enzyme in these three hydrogels are negligible and the degradation rate would be dominated by the DP of ODTC segment. DP of ODTC increased from 2.4 (Gel-1) to 5.4 (Gel-2) and 8.0 (Gel-3), which led to the increased weight loss of hydrogel from 10.3% to 20.1% and 89.3% (Fig. 6) after three weeks' incubation in lipase solution at 37 °C. For Gel-2 and Gel-4 with almost the same DP of ODTC, the degradation rate of ODTC segment is similar; but the mesh size of Gel-4 was much higher than Gel-2, so the weight loss of Gel-4 was higher than Gel-2. By adjusting DP of ODTC and the molecular weight of PEG, the degradation profile of the hydrogel could also be tuned.
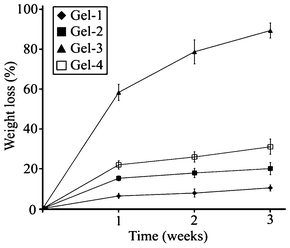 | ||
| Fig. 6 Weight loss of hydrogels with time after incubating in lipase solution at 37 °C. Values were means ± SD (n = 3). | ||
Cell adhesion and proliferation
In this study, Gel-1 and Gel-2 was used to investigate the effect of oligo-DTC segment on the adhesion of cells by culturing SCCs on the surface of the hydrogels (Fig. 7). After two hours of culture, all the cells remained spherical, but the number of cells adhered to the surface of hydrogels increased from control (PEG6K hydrogel) to Gel-1 and Gel-2 (Fig. 8) with cell adhesion percentage of 23.4 ± 3.3%, 31.8 ± 3.2%, and 46.7 ± 1.9% for PEG hydrogel, Gel-1, and Gel-2, respectively. After 72 h, SCCs spread well on the surface of Gel-1 and Gel-2, few cells showed spindle shape and others remained spherical on the surface of control. Fig. 8 is the number of the attached SCCs on the surface of control, Gel-1 and Gel-2 after 2 h incubation. With the increase of the chain length of the hydropobic ODTC segment, the number of cells adhered to the surface increased significantly.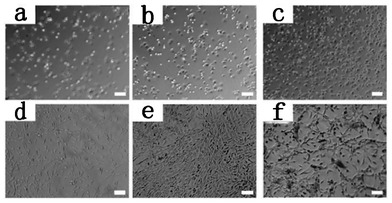 | ||
| Fig. 7 Phase contrast images of adhered SCCs on control (a, d), Gel-1 (b, e) and Gel-2 (c, f). Incubation time: a, b, and c, 2 h; d, e, and f, 3 days. Scale bar is 100 μm. | ||
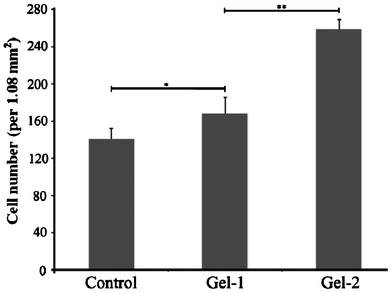 | ||
| Fig. 8 Attached SCCs on the surface of control, Gel-1 and Gel-2 after 2 h incubation at 37 °C. Values were means ± SD (n = 3). Statistical significance was indicated with * (p ≤ 0.05) and ** (p ≤ 0.01). | ||
The proliferation of SCCs on the surface of the hydrogels (Gel-1 and Gel-2) was evaluated via MTT assay. SCC density on the surface of control after 1 day culture was defined as 100, and the relative SCC density after 1, 3, and 5 days culture are shown in Fig. 9. After 1 day culture, there is no statistical difference in SCC density between the control and these hydrogels (Gel-1 and Gel-2). After 5 days culture, statistically significant increase was detected in cell density compared to day 1 and day 3 for Gel-1 and Gel-2, which suggests that this hydrogel is a suitable substrate for the growth of SCCs.
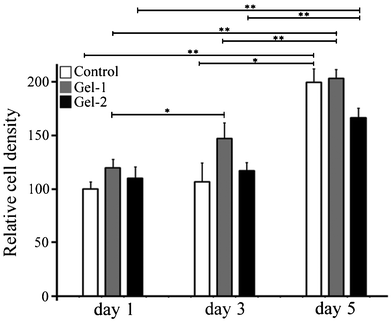 | ||
| Fig. 9 Proliferation of SCCs on the surface of hydrogels. The cell density was determined by MTT assay (n = 5). Statistical significance was indicated with * (p ≤ 0.05) and ** (p ≤ 0.01). | ||
Cell viability in three-dimensional encapsulation
The viability of the photoencapsulated SCCs in pure PEG6K hydrogels (control), Gel-2, and Gel-4 was examined by Live/Dead assay, where live cells were fluoresced green and dead cells were fluoresced red. After 24 h of photoencapsulation, live/dead fluorescence staining results showed no statistically significant difference in SCC viability between the control and the hydrogels (Gel-2 and Gel-4) (Fig. 10). This result suggests that this hydrogel has comparable cytotoxicity with widely recognized PEG hydrogels. | ||
| Fig. 10 Fluorescent micrographs of SCCs encapsulated within control (a), Gel-2 (b) and Gel-4 (c) after 24 h of 3D photo-encapsulation. Percentage of viable cells was means ± SD (n = 3). Scale bar is 100 μm. | ||
Conclusions
Biodegradable hydrogels based on ODTC–PEG–ODTC triblock copolymer precursors were prepared and the properties of the hydrogel can be adjusted by varying the length of hydrophilic (PEG) and hydrophobic (ODTC) segment. For hydrogel based on precursor with the same length of PEG segment, the hydrophobic interaction of the ODTC increased with the increase of the length of the ODTC segment, resulting in higher crosslink density and thus enhanced mechanical properties (both elastic modulus and toughness) of the hydrogel. For the lightly crosslinked hydrogel with high Mc (Gel-4), the fracture stress and toughness is greatly enhanced with a decrease in elastic modulus. The degradation rate increased with the increase of the composition of the ODTC component. The adhesion and spread of chondrocytes enhanced with the increase of the ODTC components. MTT assay and 3D photo-encapsulation of SCCs indicates the hydrogel has comparable cytotoxicity with the recognized PEG hydrogels and this hydrogels is a potential scaffolding material in tissue engineering.Acknowledgements
The authors are grateful to the financial support of the National Natural Science Foundation of China (Grant No. 20904042) and the Fundamental Research Funds for the Central Universities (Grant No.2082005).References
- N. A. Peppas, J. Z. Hilt, A. Khademhosseini and R. Langer, Adv. Mater., 2006, 18, 1345–1360 CrossRef CAS.
- B. Balakrishnan and R. Banerjee, Chem. Rev., 2011, 111, 4453–4474 CrossRef CAS.
- J. L. Drury and D. J. Mooney, Biomaterials, 2003, 24, 4337–4351 CrossRef CAS.
- F. Brandl, F. Sommer and A. Goepferich, Biomaterials, 2007, 28, 134–146 CrossRef CAS.
- K. T. Nguyen and J. L. West, Biomaterials, 2002, 23, 4307–4314 CrossRef CAS.
- S. V. Vlierberghe, P. Dubruel and E. Schacht, Biomacromolecules, 2011, 12, 1387–1408 CrossRef.
- J. Zhu, Biomaterials, 2010, 31, 4639–4656 CrossRef CAS.
- S. J. Bryant, R. J. Bender, K. L. Durand and K. S. Anseth, Biotechnol. Bioeng., 2004, 86, 747–755 CrossRef CAS.
- S. P. Zustiak and J. B. Leach, Biomacromolecules, 2010, 11, 1348–1357 CrossRef CAS.
- J. K. Tessmar and A. M. Göpferich, Macromol. Biosci., 2007, 7, 23–39 CrossRef CAS.
- K. S. Anseth, A. T. Metters, S. J. Bryant, P. J. Martens, J. H. Elisseeff and C. N. J. Bowman, J. Controlled Release, 2002, 78, 199–209 CrossRef CAS.
- M. A. Rice, J. Sanchez-Adams and K. S. Anseth, Biomacromolecules, 2006, 7, 1968–1975 CrossRef CAS.
- J. S. Park, D. G. Woo, B. K. Sun, H. M. Chung, S. J. Im, Y. M. Choi, K. Park, K. M. Huh and K. H. Park, J. Controlled Release, 2007, 124, 51–59 CrossRef CAS.
- Z. Zhang, D. W. Grijpma and J. Feijen, J. Controlled Release, 2006, 111, 263–270 CrossRef CAS.
- M. A. Rice and K. S. Anseth, J. Biomed. Mater. Res., 2004, 70, 560–568 CrossRef.
- S. J. Bryant and K. S. Anseth, J. Biomed. Mater. Res., 2003, 64, 70–79 CrossRef.
- M. J. Mahoney and K. S. Anseth, J. Biomed. Mater. Res., 2007, 81, 269–278 CrossRef.
- C. Zhang, A. Aung, L. Q. Liao and S. Varghese, Soft Matter, 2009, 5, 3831–3834 RSC.
- C. J. Fan, J. X. Tu, X. G. Yang, L. Q. Liao and L. J. Liu, Carbohydr. Polym., 2011, 86, 1484–1490 CrossRef CAS.
- Z. Zhang, R. Kuijer, S. K. Bulstra, D. W. Grijpma and J. Feijen, Biomaterials, 2006, 27, 1741–1748 CrossRef CAS.
- H. Nomura, C. H. Tator and M. S. Shoichet, J. Neurotraum, 2006, 23, 496–507 CrossRef.
- P. Calvert, Adv. Mater., 2009, 21, 743–756 CrossRef CAS.
- H. J. Kong, E. Wong and D. J. Mooney, Macromolecules, 2003, 36, 4582–4588 CrossRef CAS.
- K. Nitta, J. Miyake, J. Watanabe and Y. Ikeda, Biomacromolecules, 2012, 13, 1002–1009 CrossRef CAS.
- S. Y. Kim, H. J. Kim, K. E. Lee, S. S. Han, Y. S. Sohn and B. Jeong, Macromolecules, 2007, 40, 5519–5525 CrossRef CAS.
- W. Li, H. An, Y. Tan, C. Lu, C. Liu, P. Li, K. Xu and P. Wang, Soft Matter, 2012, 8, 5078–5086 RSC.
- S. J. Buwalda, L. B. Perez, S. Teixeira, L. Calucci, C. Forte, J. Feijen and P. J. Dijkstra, Biomacromolecules, 2011, 12, 2746–2754 CrossRef CAS.
- N. Sanabria-DeLong, A. J. Crosby and G. N. Tew, Biomacromolecules, 2008, 9, 2784–2791 CrossRef CAS.
- Y. Zhang and R. X. Zhuo, Biomaterials, 2005, 26, 2089–2094 CrossRef CAS.
- Y. Zhang and R. X. Zhuo, J. Biomed. Mater. Res., 2006, 76A, 674–680 CrossRef CAS.
- H. Tan, C. R. Chu, K. A. Payne and K. G. Marra, Biomaterials, 2009, 30, 2499–2506 CrossRef CAS.
- J. A. Wieland, T. L. Houchin-Raya and L. D. Shea, J. Controlled Release, 2007, 120, 233–241 CrossRef CAS.
- W. Su, H. Wang, J. Feng, X. Luo, X. Zhang and R. Zhuo, J. Mater. Chem., 2011, 21, 6327–6336 RSC.
- S. Lin-Gibson, R. L. Jones, N. R. Washburn and F. Horkay, Macromolecules, 2005, 38, 2897–2902 CrossRef CAS.
- S. Y. Kim, H. J. Kim, K. E. Lee, S. S. Han, Y. S. Sohn and B. Jeong, Macromolecules, 2007, 40, 5519–5525 CrossRef CAS.
- V. Breedveld, A. P. Nowak, J. Sato, T. J. Deming and D. J. Pine, Macromolecules, 2004, 37, 3943–3953 CrossRef CAS.
- F. Song, L. M. Zhang, N. N. Li and J. F. Shi, Biomacromolecules, 2009, 10, 959–965 CrossRef CAS.
- X. Z. Zhang, D. Q. Wu and C. C. Chu, J. Polym. Sci., Part B: Polym. Phys., 2003, 41, 582–593 CrossRef CAS.
- K. S. Anseth, C. N. Bowman and L. Brannon-Peppas, Biomaterials, 1996, 17, 1647–1657 CrossRef CAS.
- A. Hill, F. Candau and J. Selb, Macromolecules, 1993, 26, 4521–4532 CrossRef CAS.
- K. A. Mazich, M. A. Samus, C. A. Smith and G. Rossi, Macromolecules, 1991, 24, 2766–2769 CrossRef CAS.
- T. Baumberger, C. Caroli and D. Martina, Nat. Mater., 2006, 5, 552–555 CrossRef CAS.
- G. J. Lake and A. G. Thomas, Proc. R. Soc. Lond. A, 1967, 300, 108–119 CrossRef CAS.
- T. V. Vliet and P. Walstra, Faraday Discuss., 1995, 101, 359–370 RSC.
- P. Flory, Principles in Polymer Chemistry, Cornell University Press: Ithaca, New York, 1953 Search PubMed.
- R. Verger, G. H. D. Haas, L. Sarda and P. Desnuelle, BBA-Protein Struct., 1969, 188, 272–282 CrossRef CAS.
- M. Schmidt and W. Burchard, Macromolecules, 1981, 14, 210–211 CrossRef CAS.
| This journal is © The Royal Society of Chemistry 2013 |
