DOI:
10.1039/C2RA22619G
(Paper)
RSC Adv., 2013,
3, 148-156
Investigation of a phosphate/1-butyl-3-methylimidazolium trifluoromethanesulfonate/water system for the extraction of 1,3-propanediol from fermentation broth†
Received
24th October 2012
, Accepted 30th October 2012
First published on 31st October 2012
Abstract
The recovery of 1,3-propanediol from fermentation broth is challenging because of its high polarity and high boiling point. Extraction is an attractive alternative to the commonly used distillation process, which is very energy intensive and thus costly. Due to the low solubility of 1,3-propanediol in organic solvents, extraction has not yet been considered. Ionic liquid-based aqueous two-phase systems could constitute an alternative extraction system for the purification of 1,3-propanediol and are therefore investigated in this study. The distribution coefficient of 1,3-propanediol and the selectivity for it over the by-products of the fermentation, i.e., acetic acid and butyric acid, are determined in different ionic liquid-based aqueous two-phase systems. Based on these results, the ionic liquid-based aqueous two-phase system, phosphate/1-butyl-3-methylimidazolium trifluoromethanesulfonate (Im4,1 CF3SO3), is chosen for further investigation. The effects of the temperature, pH and Im4,1 CF3SO3, phosphate and 1,3-propanediol mass fractions on the phase diagram are examined. Furthermore, the influence of the fermentation by-products on the liquid–liquid equilibrium is determined. All experiments were performed using synthetic media to identify the effects of the process parameters independently from non-ideality incorporated through the use of real fermentation broth. To verify that this approach leads to correct results, results obtained with fermentation broth were compared to those obtained with synthetic media prior to these experiments. The recovery and potential re-use of the ionic liquid, Im4,1 CF3SO3, is finally analysed by repeating some of the experiments with recovered ionic liquid.
1 Introduction
The economic interest in 1,3-propanediol (PDO) has increased rapidly over the past several years. While it was only used as a speciality chemical a few years ago, it is now produced as a bulk chemical.1 The main reason for the increase in the demand of PDO is its use as a monomer in the production of poly (trimethylene terephthalate),1 a biodegradable plastic that has high mechanical and chemical stability and is thus used in carpet or textile fibres.
The production of PDO today is mainly accomplished via chemical synthesis. Two chemical synthesis routes are employed at the industrial scale, but both methods require the use of expensive catalysts as well as high temperatures and pressures.2–6 An attractive alternative to the chemical route is the biotechnological route in which glucose or glycerol is converted into PDO under moderate conditions.7–9 However, the purification of PDO from fermentation broth is complex. Firstly, the final concentration of PDO (5 to 100 g L−1 PDO10,11) after the fermentor is low, which depends on the strain of bacteria used and is limited by product inhibition. Secondly, in addition to PDO, the fermentation broth contains the fermentation metabolites [e.g., acetic acid (AA) and butyric acid (BA)12], the residuals from the feed medium and macromolecules, such as cells and proteins.
This complexity makes the purification challenging. The use of distillation is very energy intensive, and thus costly, due to the high boiling point of PDO.13 Extraction, even though promising, has not yet been employed14 because of the low solubility of PDO in organic solvents.
Ionic liquids (ILs) could offer an alternative to organic solvents to develop a suitable extraction process, because chemical and physical properties of ILs are tunable by choosing the appropriate anion and cation pair. ILs are defined as salts with a melting point below 100 °C. They consist of a large, asymmetrical organic cation and an organic or inorganic anion. Due to the large number of possible ions, it has been shown that 106 simple ionic liquids (one anion with one cation) and even more binary or ternary combinations can be prepared.15 The tunability of their properties led to the description of ionic liquids as “designer solvents”. However, all ILs are salts which possess a wide liquidus range and a negligible vapour pressure.15,16 They have a high thermal stability, and most of them are non-flammable. However, they can strongly differ in their other properties.
Fermentation broth mainly consists of water, so there are two ways to use ILs as extraction solvents: hydrophobic ILs can be used as conventional extraction solvents,17–22 and hydrophilic ones can serve as phase-forming components in aqueous two-phase systems (ATPSs).23
ATPSs are liquid–liquid systems, which consist of two immiscible liquid phases which both have high water contents and thus create, in comparison to organic solvents, an environment where the denaturation of biomolecules can be minimised. The addition of a sufficient amount of two phase-forming components (PFC) leads to the formation of two liquid phases. The PFCs are generally hydrophilic and thus water soluble. Below a critical concentration of the two PFCs, a single phase exists. By increasing their concentrations, two phases that differ in their hydrophobicity are formed and can thus be used as an extraction system. Typical combinations of PFCs are polymer/polymer or polymer/salt, but the combinations of alcohol/salt and IL/salt can also be used.24 The principles of an ATPS formed by using an IL and K2HPO4/NaH2PO4 as PFCs are shown in Fig. 1. If this system is used for the extraction of PDO, the two PFCs are added to water in a sufficient amount to build the two phases and PDO distributes between the two phases.
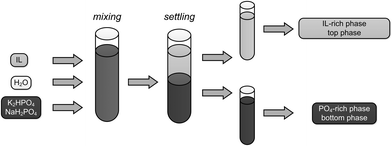 |
| | Fig. 1 Principles of an IL-based ATPS. | |
To develop an extraction process for the separation of PDO from fermentation broth using an IL-based ATPS, a suitable IL must be identified first. Secondly, this suitable IL-based ATPS is investigated in detail, meaning that the decisive parameters, e.g. temperature, pH and mass fractions of the involved components, are varied to investigate their influence on the liquid–liquid equilibrium of the system. This is done to identify the parameters which influence the extraction of PDO, the main influencing parameters can be used to increase the extraction of PDO in a latter process. The determined liquid–liquid equilibrium can also serve as a basis for the development of correlations of the distribution coefficients to model the process. This 3-step approach is shown in Fig. 2, where the grey fields represent the content of this paper. The first substep of the screening (step 1), the screening on PDO, was performed to identify if IL-based ATPSs are potentially suitable for the targeted extraction of PDO.25 The distribution coefficient turned out to be dependent on the polarity of the IL and all investigated IL-based ATPSs seemed suitable for the extraction of PDO. In the second substep of the screening (step 1), which is the starting point of this paper, the selectivities of PDO over acetic acid (AA) and butyric acid (BA) were determined. This was done with a reduced number of ILs. The determined selectivities describe an additional criterion for the selection of an appropriate IL as AA and BA are the main by-products of the fermentation and their co-extraction would increase the complexity of the final purification of PDO after the extraction.
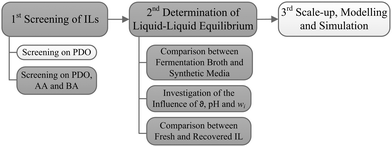 |
| | Fig. 2 Structure of the investigation. Grey: this study. | |
The investigated ILs include a wide range of PDO extraction abilities as demonstrated by their measured PDO distribution coefficients in the first study, which are large [1-butyl-3-methylimidazolium methylsulfate (Im4,1 CH3SO4)], medium [1-butyl-3-methylimidazolium thiocyanate (Im4,1 SCN) and 1-ethyl-3-methylimidazolium trifluoromethanesulfonate (Im2,1 CF3SO3)] and small (Mo4,1 CF3SO3). The IL previously chosen as the basis for the structural variation in the ILs [1-butyl-3-methylimidazolium trifluoromethanesulfonate (Im4,1 CF3SO3)] is additionally investigated. Based on these results the IL Im4,1 CF3SO3 is chosen and further investigated in the second step.
The detailed investigation of the liquid–liquid equilibrium is divided into different steps. Synthetic media consisting of a mixture of pure chemicals representing the main components of the fermentation broth are employed in the previous measurements. To verify if this substitution is acceptable and if further measurements can be performed using synthetic media, experiments using real fermentation broth and synthetic media in the same concentration range are performed, and their results are compared. This comparison is essential to ensure that the use of synthetic media to investigate the liquid–liquid equilibrium does not lead to deviations in the results. The use of synthetic media is preferable for identifying the effects of different parameters because the mass fraction of the involved components can be varied independently. Because the results obtained using the fermentation broth and those obtained using the synthetic media are similar (see section 3.2.1), the following experiments are performed with the latter. To investigate the dependence of the liquid–liquid equilibrium on the temperature, pH and mass fraction of the involved components, these parameters are varied independently. The temperature, pH and the mass fraction of phosphate and the IL represent process parameters which can be varied to enhance the extraction of PDO during a multi-stage extraction process. Hence, their influence on the distribution coefficient of PDO has to be identified. The influence of different PDO mass fractions on the liquid–liquid equilibrium was investigated because the PDO mass fraction changes in the different stages of a multi-stage extraction process. The obtained data can be used in future investigations (3rd step) to correlate the distribution coefficients and to use this equation in the modelling of the process.
Finally, experiments are performed to investigate the differences in the phase formation and distribution coefficients when recovered IL is used. This is important to ensure that the IL can be recovered and a continuous process is thus possible without requiring the use of fresh IL.
2 Experimental
2.1 Chemicals
2.1.1 Screening.
The ILs used for the screening were obtained from Merck with a purity of ≥99.0% and are given in Table 1. PDO and AA were purchased from Fulka and had a purity of ≥99.0% and ≥99.8%, respectively. BA was purchased from Riedel de Haën with a purity of ≥99.0%. K2HPO4 (trihydrate, ≥99.0%) and KH2PO4 (water free, ≥99%) were obtained from AppliChem and Roth, respectively.
Table 1 ILs considered in the screening
| IL |
Abbreviation |
| 1-Butyl-3-methylimidazolium trifluoromethanesulfonate |
Im4,1 CF3SO3 |
| 1-Butyl-3-methylimidazolium thiocyanate |
Im4,1 SCN |
| 1-Butyl-3-methylimidazolium methylsulfate |
Im4,1 CH3SO4 |
| 1-Butyl-1-methylmorpholinium trifluoromethanesulfonate |
Mo4,1 CF3SO3 |
| 1-Ethyl-3-methylimidazolium trifluoromethanesulfonate |
Im2,1 CF3SO3 |
The following chemicals were used for the different analysis methods. Sulphuric acid (≥98.0%) was purchased from Merck and was used for the HPLC analysis of PDO, AA and BA. Hydrochloric acid and sodium hydroxide, which were used in equivalence-point titrations to determine the mass fraction of PO3−4, were purchased from Merck (0.1 M with a titer of 1.000). Hydranal® Composite 5 and Hydranal® Methanol Dry obtained from Sigma Aldrich were used for Karl Fischer titration. Water purified by a Milli-Q Synthesis A10 system (Millipore, κ ≤ 0.06 μS cm−1) was used in all of the experiments.
2.1.2 Liquid–liquid equilibrium.
Im4,1 CF3SO3 was obtained from Merck with a purity of ≥99.0%. PDO and AA were purchased from Fulka and had a purity of ≥99.0% and ≥99.8%, respectively. BA was purchased from Riedel de Haën with a purity of ≥99.0%. K2HPO4 (trihydrate, ≥99.0%) and NaH2PO4 (dehydrate, ≥99.9%) were obtained from AppliChem and VWR, respectively.
For the analytical methods, the following chemicals were used. Sulphuric acid (≥98.0%) and NaH2PO4 (dehydrate, ≥99.9%) were purchased from Merck and VWR, respectively. Phosphoric acid and acetonitrile were obtained from VWR and had a purity of ≥85.0% and ≥99.9%, respectively. Water purified by a Milli-Q Synthesis A10 system (Millipore, κ ≤ 0.06 μS cm−1) was used in all of the experiments.
Fermentation broth.
In addition to the previously described chemicals, real fermentation broth was used. The fermentation broth was provided by the Institute of Bioprocess and Biosystems Engineering of the Technische Universität Hamburg–Harburg. The microorganism, Clostridium Pasteurianum, was used with raw glycerol as the substrate in a fed-batch operation mode at a temperature of 37 °C and a pH of 6. The fermentation broth was centrifuged (25 min at 7500 rpm) to obtain a cell-free medium. The achieved mass fraction of PDO was 0.03.
Recovered IL.
The previously mentioned chemicals were used except the IL. In this case, recovered IL was used. The IL phase of all the performed experiments was collected and recovered. The recovery is split into two steps: the IL phase was first placed in a rotary evaporator (p = 5 mbar, ϑ = 50 °C) and subsequently stripped with compressed air.
2.2 Procedure
2.2.1 Screening.
Specially designed extraction vessels were used to measure the distribution coefficients. They were placed in a water quench tempered by a thermostat (Ultratemp 2000, Julabo) to ensure a constant temperature of 37 °C. The mixture was stirred for 16 h at 300 rpm (magnetic stirrer 2mag, Magnetic Motion) and subsequently allowed to settle for 3 h. These time periods were chosen to ensure that thermodynamic equilibrium and complete separation of the phases were achieved. The volumes of the phases were determined, and the phases were separated and further analysed.
An oscillating U-tube was used to determine the density (DMA 46, Anton Paar), and the pH was measured with a WTW pH720 (inoLab). The PDO, AA and BA mass fractions were determined by HPLC (1200 Series, Agilent), and equivalence-point titration was used to analyse the phosphate mass fraction (DL58, Mettler Toledo). The water mass fraction was determined using Karl Fischer titration (DL31, Mettler–Toledo). The measured mass fractions were used to calculate the mass fraction of IL utilising the summation condition of both phases, which assumes that no ion exchange or ion pairing occurs. For the IL-based ATPS, Im4,1 Cl/K3PO4, Bridges et al. showed that this assumption produces only a small error.26 Hence, it was assumed that this simplification can also be used in this case.
The HPLC was equipped with an RI and UV detector. PDO, AA and BA were analysed with a VA 300/7.8 NUCLEOGEL® SUGAR 810 H column purchased from Macherey–Nagel. A 9 mM solution of H2SO4 at a flow rate of 0.7 mL min−1 was used as the eluent, and the temperature is set to 80 °C. The UV detector was operated at 210 nm.
Based on the results obtained in the screening step, a constant phase-system tie-line length of 0.6 was chosen, and additionally to 5 wt% PDO, 0.5 wt% AA and 0.5 wt% BA were added. The ratio of K2HPO4 to KH2PO4 was adjusted to yield a pH of 7, and the temperature was set to 37 °C, which is the fermentation temperature.
2.2.2 Liquid–liquid equilibrium.
The experimental procedure was generally the same as that for the screening experiments. However, the post-experimental treatment of the samples was enlarged, and the experimental conditions were varied. These conditions are described in Table 2. The necessary mixing and settling time was determined in preliminary studies and were set to 2 h and 16 h for mixing and settling, respectively. The results of these measurements can be taken from the ESI.†
Table 2 Overview of the performed experiments
| Measurement |
Tie-line |
w
PO3−4
|
w
Im4,1CF3SO3
|
w
PDO
|
w
AA
|
w
BA
|
Temperature |
pH |
| [wt%] |
[wt%] |
[wt%] |
[wt%] |
[wt%] |
[°C] |
[–] |
| Fermentation broth |
1st |
20 |
20 |
1.4 |
0.3 |
0.4 |
37 |
7, 10 |
| 2nd |
12 |
28 |
1.4 |
0.3 |
0.4 |
37 |
7, 10 |
| Synthetic medium |
1st |
20 |
20 |
1–10 |
0, 0.5 |
0, 0.5 |
32, 37, 42 |
3, 4, 7, 8, 10 |
| 2nd |
12 |
28 |
1–7 |
0, 0.5 |
0, 0.5 |
32, 37, 42 |
7, 10 |
| Recovered IL |
1st |
20 |
20 |
5 |
0, 0.6 |
0, 0.6 |
37 |
7, 10 |
| 2nd |
12 |
28 |
5 |
0, 0.6 |
0, 0.6 |
37 |
7, 10 |
A HPLC (1200 Series, Agilent) was not only used to determine the mass fractions of PDO, AA and BA, but it was also used to measure the mass fraction of Im+4,1. Ion chromatography (IC) (ICS-2100, Dionex) was used to determine the PO3−4 and CF3SO−3 mass fractions.
For the analysis of Im+4,1, a Supersphere® 60 RP-select B column purchased from Merck was used with 90 vol% of a 25 mM phosphate buffer (pH = 3.3) and 10 vol% of acetonitrile. A flow rate of 1 mL min−1 was applied at a temperature of 35 °C. The UV detector was operated at 210 nm.
A conductivity detector was used in the IC set-up. The analysis was performed with an IonPac® AS 18-fast purchased from Dionex. It was operated using a potassium hydroxide eluent (50–100 mM), which was generated utilising a KOH cartridge (EGC III, Dionex), at a flow rate of 0.2 mL min−1 and a temperature of 35 °C.
2.3 Data processing
The different experimental conditions were evaluated by comparing the tie-lines, the distribution coefficients and the selectivities. The distribution coefficient, Di, is defined as the ratio of the mass fraction of component i in the IL-rich phase, wIIi, to the mass fraction of component i in the phosphate-rich phase, wIi:| |  | (1) |
The selectivity, Si,j, is the ratio of the distribution coefficients of two different components (i and j) and indicates which component is preferably extracted:
| |  | (2) |
The tie-line length is calculated as follows:
| |  | (3) |
Here,
wPO3−4 and
wIL are the mass fractions of phosphate and IL, respectively.
A distribution coefficient higher than one means that the mass fraction of a component in the ionic liquid rich-phase is higher than its mass fraction in the PO3−4-rich phase, hence the distribution coefficient is a guide how much is extracted and how much of a component remains in the feed medium. The selectivity on the other hand helps to compare the extraction behaviour of two components. If the selectivity is one, the distribution coefficients of both components are the same.
The distance between the critical point and an investigated tie-line increases with an increase of the tie-line length. The amount of phase forming components also increases if an increased tie-line length is used.
To determine the errors of the multiple measurements the maximum of the standard deviation of the measurements and of the errors calculated by the error propagation of the single measurements is used.
3 Results and discussion
3.1 Screening
Fig. 3 and 4 show the measured distribution coefficients and selectivities, respectively. Fig. 3 also contains the distribution coefficients obtained from the measurements with only PDO present.25 The addition of AA and BA leads to an increase in the PDO distribution coefficient for all ILs. By comparing the distribution coefficients of AA, BA and PDO, it was observed that AA is extracted to a lesser degree than PDO for all ILs. This leads to selectivities for PDO over AA to be greater than one (see Fig. 4). For BA, the selectivities of Im4,1 CH3SO4, Mo4,1 CF3SO3 and Im2,1 CF3SO3 were below one, but for Im4,1 CF3SO3 and Im4,1 SCN, they were greater than one, which means that PDO is extracted more efficiently than BA under these conditions.
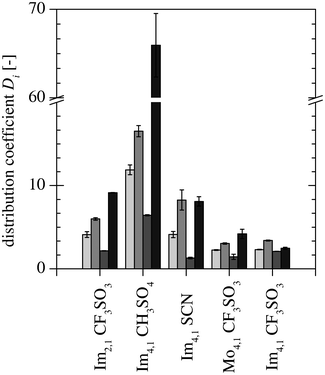 |
| | Fig. 3 Distribution coefficient of PDO ( ) without AA and BA present25 and the distribution coefficients of PDO ( ) without AA and BA present25 and the distribution coefficients of PDO ( ), AA ( ), AA ( ) and BA ( ) and BA ( ) measured in this study with all three components present. ) measured in this study with all three components present. | |
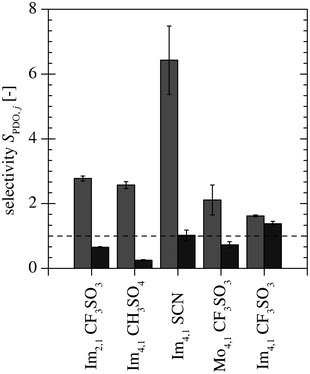 |
| | Fig. 4 Selectivity of PDO over AA ( ) and BA ( ) and BA ( ). ). | |
To choose an appropriate IL, the measured distribution coefficients, selectivities and miscibility gaps, as well as the hydrolysis stability, viscosity and density of the ILs are evaluated. Table 3 gives an overview of the evaluation of the investigated ILs, where the data is presented in bold the criterion is fulfilled. The anion of Im4,1 CH3SO4 forms ethanol in the presence of water at elevated temperatures;27 hence, it is excluded even though it exhibits the highest PDO distribution coefficient (DPDO = 16.4). The hydrolysis stabilities of Im4,1 SCN is unknown, but the CF3SO−3 anion forms stable ILs. The miscibility gap formed in the ATPS with K2HPO4 and KH2PO4 and the IL Im2,1 CF3SO3 is smaller compared to those of the other remaining ILs.25 Because a bigger miscibility gap is preferable, it is also excluded. The ILs, Im4,1 CF3SO3 and Mo4,1 CF3SO3 have similar properties, but Mo4,1 CF3SO3 has a smaller selectivity for PDO over BA than Im4,1 CF3SO3 (SPDO, BA = 0.7 vs. SPDO, BA = 1.4). Hence the ILs Im4,1 SCN and Im4,1 CF3SO3 remain and because the hydrolysis stability of Im4,1 SCN is unknown, Im4,1 CF3SO3 is chosen for further study.
Table 3 Evaluation of the different ILs. Bold if the criterion is fulfilled
| |
Im4,1 CF3SO3 |
Im4,1 CH3SO4 |
Im4,1 SCN |
Im2,1 CF3SO3 |
Mo4,1 CF3SO3 |
|
Measured at Merck KGaA (wH2O = 0.5, ϑ = 50 °C, t = 30 d).
At 25 °C.
|
| Hydrolysis stability |
+
a
|
−27 |
|
+
a
|
+
a
|
|
D
PDO [–] |
3.4
|
16.5
|
8.3
|
6.0
|
3.0
|
| Miscibility gap |
+
|
− |
0 |
− |
+
|
| Δρ [kg m−3] |
0.2
|
0.4
|
0.3
|
0.2
|
0.2
|
|
S
PDO, BA [–] |
1.4
|
0.3 |
1.0
|
0.7 |
0.7 |
|
η
IL at 20 °C [mPa s] |
99
28
|
28929 |
52
b
,
30
|
45
28
|
|
3.2 Liquid–liquid equilibrium
The experimental conditions employed to determine the liquid–liquid equilibrium are listed in Table 2. Unless otherwise noted, all phenomena will be discussed using the 1st tie-line with 5 wt% PDO, 0.5 wt% AA and 0.5 wt% BA at pH 7. The other experimental conditions lead to similar results if they are not discussed elsewhere. All results are discussed using the distribution coefficients of PDO, AA and BA. The results obtained for the tie-lines of the phase system can be taken from the ESI.†
3.2.1 Comparison between fermentation broth and synthetic media.
The distribution coefficients measured in the fermentation broth are shown in Fig. 5 together with those obtained using synthetic media. Here, the PDO distribution coefficient in the fermentation broth (wPDO, mix = 0.014) is compared to those with a PDO mass fraction of wPDO, mix = 0.01 and 0.02 in the synthetic medium with AA and BA present. The distribution coefficients measured in the fermentation broth are slightly higher. AA and BA lead to an increase in the PDO distribution coefficient; hence, it is very likely that additional components present in the fermentation broth lead to an increase in the PDO distribution coefficient. For experiments performed with fermentation broth a precipitate was formed at the interface. The formed precipitate was not analysed, but its consistency and the tendency of proteins to precipitate in ATPS lead to the assumption that it is formed by remaining proteins present in the fermentation broth. Although differences between the measurements made in the fermentation broth and in the synthetic medium are observed, they are quite small and in the range of the error bars. Thus, the substitution of synthetic media is acceptable for the identification of the parameters that influence the liquid–liquid equilibrium, and all further experiments are performed with synthetic media.
![Comparison of the PDO distribution coefficients for the synthetic medium [wPDO, mix = 0.01 () and wPDO, mix = 0.02 ()] and the fermentation broth [wPDO, mix = 0.014 ()].](/image/article/2013/RA/c2ra22619g/c2ra22619g-f5.gif) |
| | Fig. 5 Comparison of the PDO distribution coefficients for the synthetic medium [wPDO, mix = 0.01 ( ) and wPDO, mix = 0.02 ( ) and wPDO, mix = 0.02 ( )] and the fermentation broth [wPDO, mix = 0.014 ( )] and the fermentation broth [wPDO, mix = 0.014 ( )]. )]. | |
3.2.2 Investigation of the different process parameters.
Effect of the temperature.
To investigate the temperature effect, the two tie-lines (see Table 2) are examined at three different temperatures: 32, 37 and 42 °C. Fig. 6 shows the PDO distribution coefficients as a function of the temperature, and no significant differences can be seen. The tie-lines of the phase system and the distribution coefficients of AA and BA also vary little with temperature. A temperature increase is always coupled to the increased energy consumption of the process, and because a temperature increase of 10 K has no significant effect on the phase system and on the distribution coefficients of the extracted components, the temperature dependence of the system is negligible. Thus, the temperature is no longer regarded as an experimental parameter and is set to 37 °C because the fermentation is performed at this temperature.
![Distribution coefficients of PDO for two different tie-lines [1st () and 2nd ()] at different temperatures.](/image/article/2013/RA/c2ra22619g/c2ra22619g-f6.gif) |
| | Fig. 6 Distribution coefficients of PDO for two different tie-lines [1st ( ) and 2nd ( ) and 2nd ( )] at different temperatures. )] at different temperatures. | |
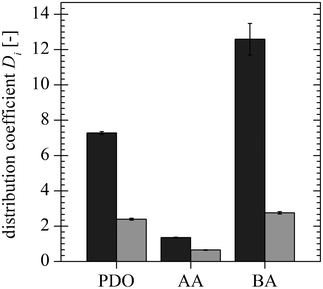 |
| | Fig. 7 Comparison of the distribution coefficients of PDO, AA and BA for the 1st ( ) and 2nd ( ) and 2nd ( ) tie-lines. ) tie-lines. | |
Fig. 8 shows the distribution coefficients for the chosen tie-line at different pHs. The distribution coefficients of BA and AA reach a minimum near their pKa value. The PDO distribution coefficient increases constantly with increasing pH. Hence, the pH is an important factor influencing the distribution of the components as well as the selectivities, SPDO, AA and SPDO, BA.
![Distribution coefficients of PDO [(), AA () and BA () at different pHs (pKA of AA () and BA (⋯)].](/image/article/2013/RA/c2ra22619g/c2ra22619g-f8.gif) |
| | Fig. 8 Distribution coefficients of PDO [( ), AA ( ), AA ( ) and BA ( ) and BA ( ) at different pHs (pKA of AA ( ) at different pHs (pKA of AA (![[dash dash, graph caption]](https://www.rsc.org/images/entities/char_e091.gif) ) and BA (⋯)]. ) and BA (⋯)]. | |
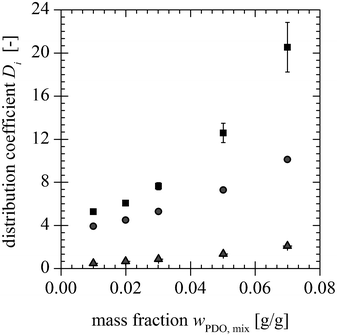 |
| | Fig. 9 Distribution coefficients of PDO ( ), AA ( ), AA ( ) and BA ( ) and BA ( ) for different PDO mass fractions at the mixing point. ) for different PDO mass fractions at the mixing point. | |
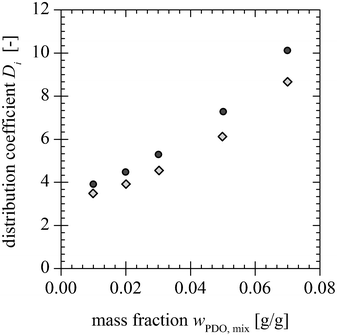 |
| | Fig. 10 Distribution coefficients of PDO with ( ) and without ( ) and without ( ) AA and BA for different PDO mass fractions at the mixing point. ) AA and BA for different PDO mass fractions at the mixing point. | |
A summary of the investigated parameters and their influence on the distribution coefficient of PDO, AA and BA is given in Table 4. The arrows represent the increase or decreasing effect of the individual parameters. The influence of the pH is different above and below the pKa-value of acetic and butyric acid, hence, the sign before pKa represents the behaviour below and the sign after pKa the behaviour above the pKa-value.
Table 4 Summary of the investigated parameter and their influence on the distribution coefficients and selectivities. The plus and minus signs represent the increasing or decreasing effect of the different parameters, 0 indicates no change
| |
D
PDO
|
D
AA
|
D
BA
|
S
PDO,AA
|
S
PDO,BA
|
|
Not determined.
|
|
ϑ + |
0 |
0 |
0 |
0 |
0 |
| pH + |
+ |
− pKa + |
− pKa + |
+ pKa + |
+ pKa 0 |
|
w
PO3−4 + |
+ |
+ |
+ |
+ |
+ |
|
w
Im4,1 CF3SO3 + |
+ |
+ |
+ |
+ |
+ |
|
w
PDO + |
+ |
+ |
+ |
+ |
+ |
|
w
AA, wBA + |
+ |
—a |
—a |
—a |
—a |
3.2.3 Ion exchange between the phases.
The investigated system contains the ions: K+, Na+, PO3−4 CF3SO−3 and Im+4,1. The presence of three cations and two anions makes ion exchange between the two liquid phases likely to occur. The determination of the IL anion and cation mass fractions reveals if ion exchange occurs and thus if recovery of the IL is generally possible. Recovery of the IL is only possible if no ion exchange occurs, meaning the anion and cation are present in the same phase.
The mole fractions of Im+4,1 and CF3SO−3 are calculated for all experiments, and an average relative deviation of 3.2% between the mole fractions of Im+4,1 and CF3SO−3 is found. Because the average relative deviation is small, ion exchange is assumed to be negligible, and the ionic liquid is treated as one component. Hence, recovery of the IL should, in general, be possible.
3.2.4 Comparison between fresh and recovered IL.
Measurements were performed to determine if a recovery of the IL is possible and if the recovered IL is as effective as fresh IL in the extraction. Fig. 11 shows the distribution coefficients of PDO, AA and BA. The distribution coefficients of AA and BA for the recovered IL are similar to the ones obtained using fresh IL. However, the PDO distribution coefficient is higher for the recovered IL. The decrease in the slope of the tie-line and the increase in the PDO distribution coefficient might be explained by higher AA and BA mass fractions. This could be caused by AA and BA still present in the recovered IL. However, the results are similar in magnitude; hence, the IL could be recovered and recycled to the extraction apparatus in a continuous process.
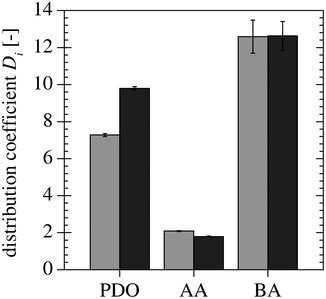 |
| | Fig. 11 Comparison of the distribution coefficients of PDO, AA and BA for the fresh ( ) and the recovered ( ) and the recovered ( ) IL. ) IL. | |
4 Conclusions
To decide if IL-based ATPSs can be used for the separation of 1,3-propanediol from fermentation broth, different IL-based ATPSs were investigated, and the distribution coefficients of PDO, AA and BA and the related selectivities are determined. Based on these results and further decision criteria the IL-based ATPS containing the IL 1-butyl-3-methylimidazolium trifluoromethanesulfonate was chosen and further investigated by varying the mass fractions of the involved components, the pH and the temperature. Additional to these experiments, measurements to compare the liquid–liquid equilibrium by using fermentation broth or recovered ionic liquid were performed, which yield comparable results to the measurements using synthetic media. This comparison is essential to ensure that the use of synthetic media to investigate the liquid–liquid equilibrium does not lead to deviation in comparison to real fermentation broth. The comparability of fresh and recovered IL is important to ensure that the IL can be recovered and a continuous process is thus possible without requiring the use of fresh IL.
In the future, measurements in a multi-scale extraction unit must be performed to decide if a scale-up is feasible and if this system can be used in a continuous operation mode. The measured database can be used to develop correlations to describe the liquid–liquid equilibrium to model a multi-stage extraction process. This must be verified with multi-stage extraction measurements and can be used to identify a suitable operation window.
To determine if this process for the separation of 1,3-propanediol is economically feasible, further aspects must be investigated. The separation of 1,3-propanediol from the IL-rich phase, the losses of the IL in the phosphate-rich phase and the recovery of the IL and phosphate must be considered.
Glossary
Latin letters
|
D
| Distribution coefficient [–] |
|
TLL
| Tie-line length [g g−1] |
Greek letters
Subscripts
Superscripts
Abbreviations
| Im4,1 CF3SO3 | 1-Butyl-3-methylimidazolium trifluoromethanesulfonate |
| Im4,1 N(CN)2 | 1-Butyl-3-methylimidazolium dicyanamide |
| Im4,1 SCN | 1-Butyl-3-methylimidazolium thiocyanate |
| Im4,1 CH3SO4 | 1-Butyl-3-methylimidazolium methylsulfate |
| Mo4,1 CF3SO3 | 1-Butyl-1-methylmorpholinium trifluoromethanesulfonate |
| Pl4,1 CF3SO3 | 1-Butyl-1-methylpyrrolidinium trifluoromethanesulfonate |
| Im2,1 CF3SO3 | 1-Ethyl-3-methylimidazolium trifluoromethanesulfonate |
| Im2O1,1 CF3SO3 | 1-Methoxyethyl-3-methylimidazolium trifluoromethanesulfonate |
Acknowledgements
The research leading to these results has received funding from the European Union Seventh Framework Programme (FP7/2007-2013) under grant agreement no. 241718 EuroBioRef. Merck KGaA is acknowledged for supplying the ionic liquids, and the Institute of Bioprocess and Biosystems Engineering of the Technische Universität Hamburg-Harburg provided the fermentation broth.
References
- G. A. Kraus, Clean: Soil, Air, Water, 2008, 36, 648–651 CrossRef CAS.
-
D. Arntz and N. Wiegand, EP, 0412337B1, 1991.
-
T. Haas, N. Wiegand and D. Arntz, US, 5334778, 1993.
-
P. R. Weider, J. B. Rowell and L. K. Thanh, US, 005684214A, 1997.
-
J. F. Knifton, L. H. Slaugh, P. R. Weider, K. D. Allen and J. B. Powell, US, 006750373B2, 2002.
-
D. Arntz and N. Wiegand, US, 5015789, 1990.
- A. Urrehman, M. Matsumura, N. Nomura and S. Sato, Curr. Res. Bacteriol., 2008, 1, 7–16 CrossRef.
-
A. M. Baniel, R. P. Jansen, A. Vitner and A. Baida, US, 20040222153, 2004.
- F. Barbirato, E. Himmi, T. Conte and A. Bories, Ind. Crops Prod., 1998, 7, 281–289 CrossRef CAS.
- Y.-Z. Xu, N.-N. Guo, Z.-M. Zheng, X.-J. Ou, H.-J. Liu and D.-H. Liu, Biotechnol. Bioeng., 2009, 104, 965–972 CrossRef CAS.
- V. Jalasutram, A. Jetty and G. R. Anupoju, Afr. J. Biotechnol., 2011, 10, 18493–18502 CAS.
- E. H. Himmi, A. Bories and F. Barbirato, Bioresour. Technol., 1999, 67, 123–128 CrossRef CAS.
- Z. L. Xiu and A. P. Zeng, Appl. Microbiol. Biotechnol., 2008, 78, 917–926 CrossRef CAS.
- J. J. Malinowski, Biotechnol. Tech., 1999, 13, 127–130 CrossRef CAS.
-
G. W. Meindersma, M. Maase and A. B. de Haan, in Ullmann's Encyclopedia of Industrial Chemistry, Wiley-VCH Verlag GmbH & Co. KGaA, Weinheim, Germany, 2000, p. 33 Search PubMed.
- S. Werner, M. Haumann and P. Wasserscheid, Annu. Rev. Chem. Biomol. Eng., 2010, 1, 203–230 CrossRef CAS.
- S. G. Cull, J. D. Holbrey, V. Vargas-Mora, K. R. Seddon and G. J. Lye, Biotechnol. Bioeng., 2000, 69, 227–233 CrossRef CAS.
- M. I. Dietz, Sep. Sci. Technol., 2006, 41, 2047–2063 CrossRef CAS.
- J. G. Huddleston, H. D. Willauer, R. P. Swatloski, A. E. Visser and R. D. Rogers, Chem. Commun., 1998, 1765–1766 RSC.
- J. McFarlane, W. B. Ridenour, H. Luo, R. D. Hunt, D. W. DePaoli and R. X. Ren, Sep. Sci. Technol., 2005, 40, 1245–1265 CrossRef CAS.
- G. W. Meindersma, A. Podt, M. B. Klaren and A. de Haan, Chem. Eng. Commun., 2006, 193, 1384–1396 CrossRef CAS.
- L. D. Simoni, A. Chapeaux, J. F. Brennecke and M. A. Stadtherr, Comput. Chem. Eng., 2010, 34, 1406–1412 CrossRef CAS.
- Z. Li, Y. Pei, H. Wang, J. Fan and J. Wang, Trends Anal. Chem., 2010, 29, 1336–1346 CrossRef CAS.
-
J. Benavides, M. Rito-Palomares and J. A. Asenjo, in Comprehensive Biotechnology, ed. M. Moo-Young, Academic Press, Burlington, 2nd edn, 2011, pp. 697–713 Search PubMed.
- A. Müller and A. Górak, Sep. Purif. Technol., 2012, 97, 130–136 CrossRef.
- N. J. Bridges, K. E. Gutowski and R. D. Rogers, Green Chem., 2007, 9, 177–183 RSC.
- E. Siedlecka, M. Czerwicka, S. Stolte and P. Stepnowski, Curr. Org. Chem., 2011, 15, 1974–1991 CrossRef CAS.
- P. Bonhôte, A.-P. Dias, N. Papageorgiou, K. Kalyanasundaram and M. Grätzel, Inorg. Chem., 1996, 35, 1168–1178 CrossRef.
- A. V. P. T. E. R. A. Pereiro, J. Chem. Eng. Data, 2007, 52, 377–380 CrossRef CAS.
- U. Domańska and M. Laskowska, J. Chem. Eng. Data, 2009, 54, 2113–2119 CrossRef.
-
P. W. Atkins and J. de Paula, Atkins' physical chemistry, Oxford University Press, Oxford, 9th edn, 2010 Search PubMed.
Footnote |
| † Electronic Supplementary Information (ESI) available: Results for the liquid–liquid equilibrium measured using synthetic media, the measurements for the determination of the mixing and settling time and the results for the system tie lines. See DOI: 10.1039/c2ra22619g |
|
| This journal is © The Royal Society of Chemistry 2013 |
Click here to see how this site uses Cookies. View our privacy policy here. 


 ) without AA and BA present25 and the distribution coefficients of PDO (
 ), AA (
 ) and BA (
 ) measured in this study with all three components present.
 ) and BA (
 ).
).![Comparison of the PDO distribution coefficients for the synthetic medium [wPDO, mix = 0.01 () and wPDO, mix = 0.02 ()] and the fermentation broth [wPDO, mix = 0.014 ()].](/image/article/2013/RA/c2ra22619g/c2ra22619g-f5.gif)
 ) and wPDO, mix = 0.02 (
 )] and the fermentation broth [wPDO, mix = 0.014 (
 )].
)].![Distribution coefficients of PDO for two different tie-lines [1st () and 2nd ()] at different temperatures.](/image/article/2013/RA/c2ra22619g/c2ra22619g-f6.gif)
 ) and 2nd (
 )] at different temperatures.
 ) and 2nd (
 ) tie-lines.
![Distribution coefficients of PDO [(), AA () and BA () at different pHs (pKA of AA () and BA (⋯)].](/image/article/2013/RA/c2ra22619g/c2ra22619g-f8.gif)
 ), AA (
 ) and BA (
 ) at different pHs (pKA of AA (
![[dash dash, graph caption]](https://www.rsc.org/images/entities/char_e091.gif) ) and BA (⋯)].
) and BA (⋯)].
 ), AA (
 ) and BA (
 ) for different PDO mass fractions at the mixing point.
 ) and without (
 ) AA and BA for different PDO mass fractions at the mixing point.
 ) and the recovered (
 ) IL.
) IL.