Mediator-free microfluidics biosensor based on titania–zirconia nanocomposite for urea detection
Saurabh
Srivastava
ab,
Md. Azahar
Ali
a,
Pratima R.
Solanki
a,
Pandurang M.
Chavhan
a,
Manoj K.
Pandey
a,
Ashok
Mulchandani
c,
Anchal
Srivastava
b and
Bansi D.
Malhotra
*d
aDepartment of Science and Technology Centre on Biomolecular Electronics, Biomedical Instrumentation Section, National Physical Laboratory, New Delhi, 110012, India
bDepartment of Physics, Banaras Hindu University, Varanasi, 221005, UP, India
cDepartment of Chemical and Environmental Engineering, University of California, Riverside, CA 92521, USA
dDepartment of Biotechnology, Delhi Technological University, Main Bawana Road, Delhi, 110042, India. E-mail: bansi.malhotra@gmail.com; Tel: 91-11-27871043 (Ext-1609)
First published on 24th October 2012
Abstract
Urease (Urs) and glutamate dehydrogenase (GLDH) co-immobilized onto titania–zirconia (TiO2–ZrO2) nanocomposite and integrated with microfluidics mediator-free sensor have been utilized for urea detection. The PDMS microchannels have been sealed with a glass substrate comprising of reference (Ag/AgCl), counter (ITO) and working (Urs-GLDH/TiO2-ZrO2/ITO) electrodes. This mediator-free microfluidics urea sensor shows linearity as 5–100 mg/dL with improved sensitivity as 2.74 μA [Log mM]−1 cm−2 and detection limit of 0.07 mg/dl (0.44 mM) using 3σb/m criteria. The Reynolds number has been found to be as 0.166, indicating that fluid flow is completely laminar, controllable and the pressure drop across the microchannels is found to be as 3.5 × 10³ Pa.
Introduction
Recent years have seen increased interest towards the development of miniaturized microfluidics biosensing devices. In a microfluidics system, the integration of microchannels provides novel functions because of smart geometries and controllable dimensions that offer complete functional devices such as lab-on-a-chip1 for enzymatic analysis,2 immunoassays3 and capillary electrophoresis4etc.The potential applications of microfluidics devices have led to increased demand due to low consumption of reagents, short reaction time and design flexibility. Polydimethylsiloxane (PDMS) is known to be an interesting polymer for microfluidics device fabrication due to remarkable elasticity, optical transparency, simple and low cost.5 The electrochemical techniques are currently one of the most commonly used detection methods because of the high sensitivity and fast response time for desired microfluidics module.6
There is increased interest towards the fabrication of nanostructured metal oxides (NMOs) including titanium dioxide (TiO2) and zirconium dioxide (ZrO2) for clinical diagnostics7–9 due to higher surface-to-volume ratio, high isoelectric point, non-toxicity, chemical stability, biocompatibility and high electron transfer ability.10–12
The estimation of urea is important for clinical analysis, since increased urea level in blood and urine causes various kidney diseases.13–15 We report results of the studies relating to development of mediator-less microfluidics device based on TiO2–ZrO2 nanocomposite for urea detection. It is found that presence of this binary oxide facilitates direct electron transfer between active sites of the enzymes to the electrode. It has been reported that addition of ZrO2 to TiO2 can prevent phase transformation from anatase to rutile, lead to enhanced catalytic, photocatalytic and electrochemical properties due to modification in electronic band structure and interfacial state.16–18 To the best of our knowledge, we are reporting for the first time a TiO2–ZrO2 nanocomposite incorporated mediator-free microfluidics sensor for urea detection.
Experimental section
2.1 Chemicals
All chemicals have been procured from Sigma Aldrich. Sylgard 184 is procured from Dow Corning (Midland, MI, USA). SU-8-100 negative photoresist and SU-8 developer have been acquired from Microchem (Newton, MA, USA).2.2 Synthesis of TiO2–ZrO2 nanocomposite
Zirconium (IV) n-propoxide and titanium(IV) butoxide (1![[thin space (1/6-em)]](https://www.rsc.org/images/entities/char_2009.gif) :
:![[thin space (1/6-em)]](https://www.rsc.org/images/entities/char_2009.gif) 1 molar ratio) are dissolved in 2-methoxy ethanol to prepare 5(wt%) precursor sol solution and hydrolyzed by drop wise addition of 500 μl of H2O and nitric acid (25 μl of 70%) under continuous stirring followed by keeping for about 2 h at 25 °C for ageing.
1 molar ratio) are dissolved in 2-methoxy ethanol to prepare 5(wt%) precursor sol solution and hydrolyzed by drop wise addition of 500 μl of H2O and nitric acid (25 μl of 70%) under continuous stirring followed by keeping for about 2 h at 25 °C for ageing.
2.3 Fabrication of microfluidics electrodes and microchannels
Two patterned microelectrodes comprising of dimensions (0.2 × 2.5 cm2) are fabricated onto indium tin oxide (ITO) coated glass slide (2.5 × 3.5 cm2) by wet chemical etching process. The working electrodes (WE 1 and WE 2) are used to deposit TiO2–ZrO2 nanocomposite film by dip coating method (Scheme 1). For this process, first we take the glass substrate containing three patterned ITO electrodes (step a, Scheme 1) that is masked with commercially available cello tape film (step b). We then remove the cello tape from the two patterned ITO electrodes using a sharp razor blade (step c), leaving central ITO microelectrode and the substrate remains covered. This substrate is dip coated with transparent sol–gel solution followed by drying at 90 °C for 1 h (step d). The remaining cello tape film is then removed from the rest of the substrate. The dried sol–gel film onto patterned ITO electrodes is finally annealed at 450 °C for 2 h to obtain TiO2–ZrO2 nanocomposite (step e). In this process, the central bare patterned ITO electrode remains unmodified with sol–gel coating that is used as the counter electrode. The proposed reactions involved in the synthesis of TiO2–ZrO2 nanocomposite are as follows: | (1) |
 | (2) |
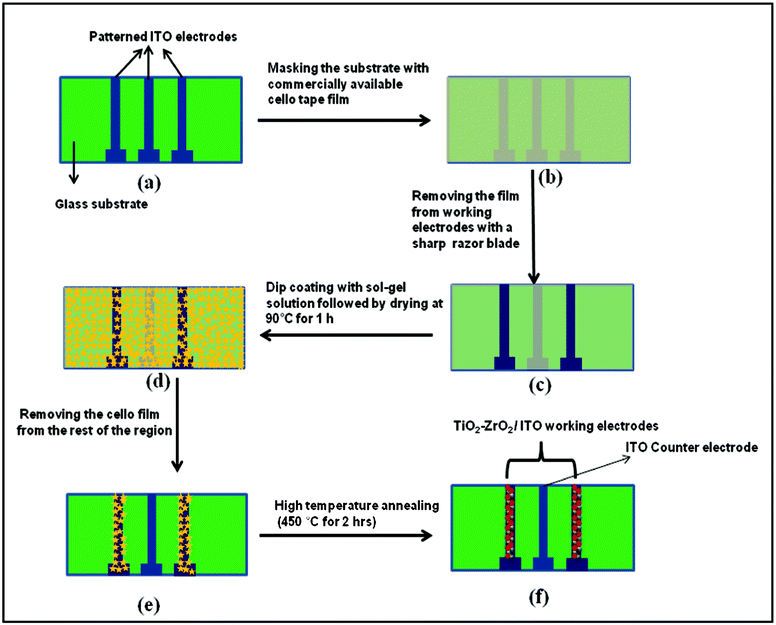 | ||
| Scheme 1 The process of modifying only the working ITO electrode (WE1 and WE 2) with TiO2–ZrO2 nanocomposite using the dip coating method is shown. | ||
2.4 Modification of titanium and zirconium electrode
Ten μl of bienzyme [Urease (10 mg mL−1) and GLDH (1 mg mL−1)] solutions are spread over TiO2–ZrO2/ITO microelectrode by physisorption technique via electrostatic interactions and incubated for 3 h at 25 °C in humid condition. These bioelectrodes are stored in a refrigerator at 4 °C when not in use. The modified TiO2–ZrO2/ITO (WE1) and Urs-GLDH/TiO2–ZrO2/ITO (WE2) act as working electrodes whereas a silver wire (0.5 mm dia.) coated with silver chloride (Ag/AgCl) layer is taken as the reference electrode for electrochemical studies.2.5 Integration of electrode with microfluidics channels
PDMS microchannels have been fabricated using soft lithographic technique and include steps like cleaning of Si wafers, spin coating of photoresist, pre and post exposure heat treatment, UV exposure and development to obtain a positive relief pattern of the photoresist over Si wafers (called Master) of desired dimensions (2 cm × 200 μm × 200 μm).19 The PDMS oligomer and a cross-linking agent mixed in 10![[thin space (1/6-em)]](https://www.rsc.org/images/entities/char_2009.gif) :
:![[thin space (1/6-em)]](https://www.rsc.org/images/entities/char_2009.gif) 1 are stirred vigorously for about 5 min and are then degassed for about 30 min under vacuum to remove all air bubbles. The clear solution is poured onto the master and heated at 100 °C for about 1.5 h. The PDMS layer with pattern of the negative relief is peeled off from the master and cut into suitable size. The reservoirs are fabricated by punching holes at the ends of microchannels. This PDMS chip is tightly clamped with the glass substrate containing ITO microelectrodes, to ensure leakage-free flow operation. The integration of PDMS microchannels and electrodes system for urea detection coupled with electrochemical analyzer is shown in Scheme 2.
1 are stirred vigorously for about 5 min and are then degassed for about 30 min under vacuum to remove all air bubbles. The clear solution is poured onto the master and heated at 100 °C for about 1.5 h. The PDMS layer with pattern of the negative relief is peeled off from the master and cut into suitable size. The reservoirs are fabricated by punching holes at the ends of microchannels. This PDMS chip is tightly clamped with the glass substrate containing ITO microelectrodes, to ensure leakage-free flow operation. The integration of PDMS microchannels and electrodes system for urea detection coupled with electrochemical analyzer is shown in Scheme 2.
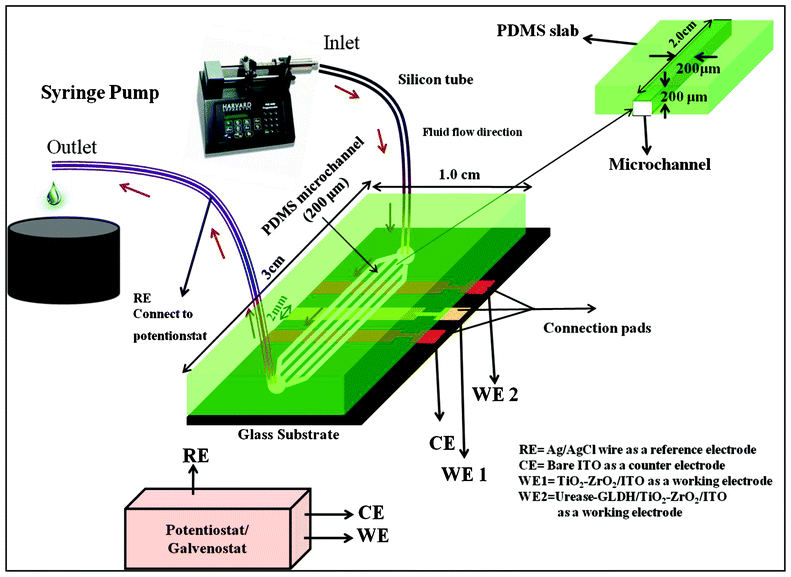 | ||
| Scheme 2 Schematic representation of microfluidics module for TiO2–ZrO2 nanocomposites based electrochemical urea biosensor. | ||
2.6 Instrumentation
X-ray diffraction (XRD, Rigaku), atomic force microscopic (AFM, Veeco, Nanoscope) and Fourier transform-infrared (FT-IR, Perkin-Elmer, Model 2000) techniques have been used for characterization of TiO2–ZrO2/ITO electrode and Urs-GLDH/TiO2–ZrO2/ITO bioelectrode. Electrochemical studies have been performed in phosphate buffer saline (PBS, pH 7.0 containing 0.9% NaCl) using electrochemical analyzer (Autolab).Results and discussion
3.1 Structural properties
The XRD pattern of TiO2–ZrO2 nanocomposite (Fig. 1A) shows peaks at 2θ: 30.7° and 60.9° corresponding to the diffraction pattern of (111) and (113) planes indicating the presence of predominant orthorhombic phase of ZrTiO4 (JCPDS 80-1783). The peak seen at 36° corresponding to (101) plane represents the rutile phase present in TiO2. The peaks seen at 38°, 51.4° and 56.2° correspond to the diffraction planes (112), (211) and (220) of anatase phase of TiO2. A small peak found at 62.6° corresponds to (222) plane assigned to cubic crystalline system of ZrO2 (JCPDS 89-9069). The peak seen at 46° corresponds to (![[2 with combining macron]](https://www.rsc.org/images/entities/char_0032_0304.gif) 02) reflection plane of ZrO2 (JCPDS 89-9066). The crystallite size of TiO2–ZrO2 nanocomposite calculated using Scherrer formula has been found as 17.8 nm.
02) reflection plane of ZrO2 (JCPDS 89-9066). The crystallite size of TiO2–ZrO2 nanocomposite calculated using Scherrer formula has been found as 17.8 nm.
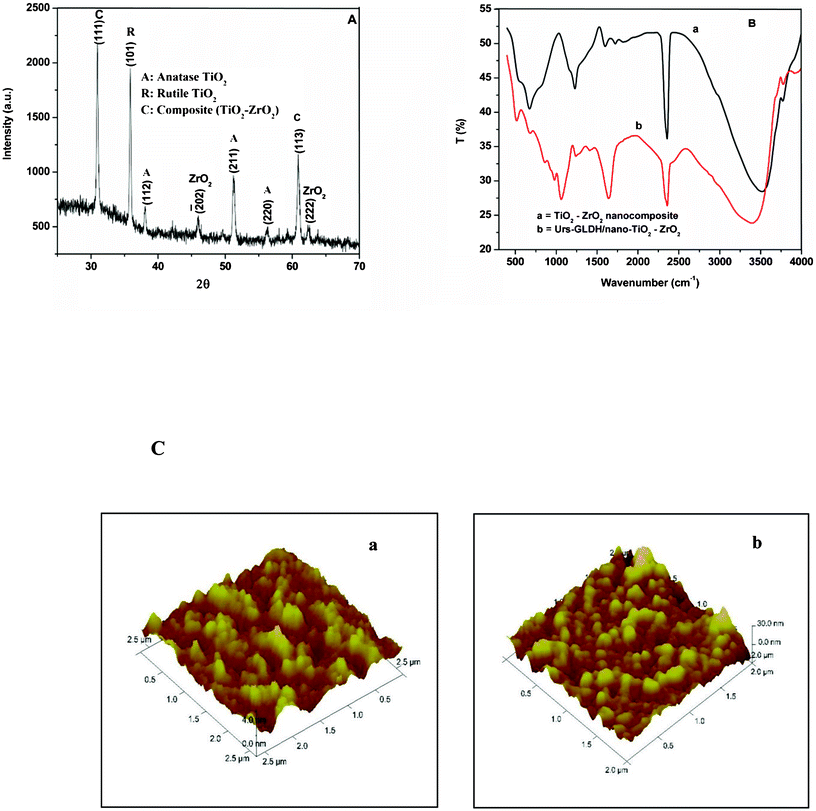 | ||
| Fig. 1 (A) XRD pattern of TiO2–ZrO2 nanocomposite, (B) FTIR spectra of TiO2–ZrO2/ITO electrode (a) and Urs-GLDH/TiO2–ZrO2/ITO bioelectrode (b), (C) AFM image of TiO2–ZrO2/ITO (a) and Urs-GLDH/TiO2–ZrO2/ITO (b). | ||
3.2 Optical properties
The FT-IR spectra of TiO2–ZrO2/ITO nanocomposite [Fig. 1B, (a)] exhibits characteristic peak at 664 cm−1 corresponding to vibration bending of Ti–O. A band seen at 740 cm−1 is ascribed to ZrTiO4 species.20 The bands found at 3530 cm−1 and 1595 cm−1 correspond to the stretching vibration and deformation of the O–H bond due to absorption of the water molecules. The FT-IR spectra of Urs-GLDH immobilized TiO2–ZrO2/ITO electrode (b) exhibits band at 1631 cm−1 (corresponding to N–H bending), 1235 cm−1 (assigned to C–O stretching) and 1061 cm−1 (corresponding to C–N stretching) due to presence of amide bond revealing immobilization of Urs-GLDH onto nanocomposite. The weak bands seen at 1723 and 1812 cm−1 may perhaps be due to the formation of other intermediate compounds (acid derivative containing C![[double bond, length as m-dash]](https://www.rsc.org/images/entities/char_e001.gif) O group) as a result of reaction of nitric acid and water to the hydrocarbon chain of the precursor (titanium(IV) butoxide/zirconium (IV) n-propoxide).
O group) as a result of reaction of nitric acid and water to the hydrocarbon chain of the precursor (titanium(IV) butoxide/zirconium (IV) n-propoxide).
The AFM image [Fig. 1C, (image a)] shows that TiO2–ZrO2 molecules are uniformly distributed onto the ITO surface resulting in rough nanoporous structure with average roughness of 0.67 nm. After co-immobilization of the enzymes (Urs and GLDH) (image b), the roughness increases to 3.81 nm revealing that nanoporous morphology of nanocomposite provides favorable environment for adsorption of enzymes. However, the average maximum height for TiO2–ZrO2/ITO electrode increases from 11.9 to 21 nm after enzyme immobilization. The observed granular structure is due to aggregation of the enzyme molecules over the nanocomposite platform.
3.3 Electrochemical studies
Fig. 2A shows results of the cyclic voltammetric (CV) studies conducted on TiO2–ZrO2/ITO electrode and Urs-GLDH/TiO2–ZrO2/ITO bioelectrode in phosphate buffer saline (PBS; 50 mM, pH 7.0, 0.9% NaCl) at constant flow rate. Typical CV of TiO2–ZrO2 nanocomposite [curve (i)] shows different peaks at lower potentials of 0.057 V and 0.0039 V (vs Ag/AgCl) due to anatase crystal (a band) and interfacial sites (s band) of TiO2 (indicated by arrows a and s respectively) as reported in literature.17,18 Another broad oxidation peak found at higher potential 0.42 V is attributed to presence of ZrO2 (indicated by arrow) in TiO2–ZrO2 nanocomposite.17 The oxidation peak current in curve (ii) is higher (1.11 × 10⁻⁶A) and is shifted to the lower potential (0.334 V) after immobilization of Urs and GLDH onto transducer surface. This may perhaps be due to the fact that the TiO2–ZrO2 nanocomposite provides favorable microenvironment for enzymes (Urs and GLDH) that directly communicate with the active sites and establish an electron mediation path and hence lower the tunneling distance between active sites of enzymes and electrode surface resulting in enhanced magnitude of current. Moreover, small peak appears at higher current (3.27 × 10⁻⁷A) and is shifted towards lower positive potential (+0.03 V) due to a band of TiO2 system.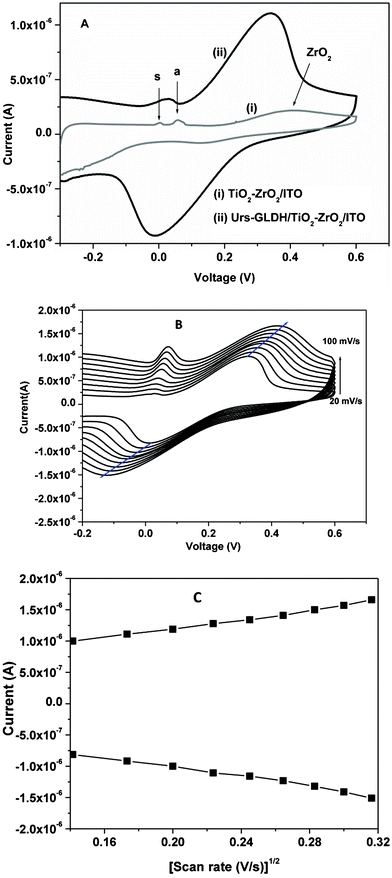 | ||
| Fig. 2 (A) (i) Cyclic voltammetry (CV) of TiO2–ZrO2/ITO electrode and (ii) Urs-GLDH/TiO2–ZrO2/ITO bioelectrode in PBS, (B) CV of Urs-GLDH/TiO2–ZrO2/ITO bioelectrode at different scan rates in PBS. (C) Magnitude of redox peak currents as a function of square root of scan rate. | ||
Cyclic voltammograms obtained for Urs-GLDH/TiO2–ZrO2/ITO bioelectrode as a function of scan rates (20–100 mVs−1) have been shown in Fig. 2B. It is observed that the anodic potential shifts towards positive side and the cathodic peak potential shifts in the reverse direction (Fig. 2C), indicating a diffusion electron-transfer process follows eqn (3,4).
| Ia = 4.63 × 10⁻⁷ [A] + 3.68 × 10⁻⁶ [A2 mV−1 s]1/2 × [scan rate (mV s−1)]1/2, R2 = 0.996 | (3) |
| Ic = −2.41 × 10⁻⁷ [A] − 3.87 × 10⁻⁶ [A2 mV−1 s]1/2 × [scan rate (mV s−1)]1/2, R2 = 0.995 | (4) |
The surface concentration of Urs-GLDH/TiO2–ZrO2/ITO bioelectrode estimated from plot of Ipversus scan rate (ν) using the Brown–Anson model21 and found to be as 5.275 × 10⁻¹² mol cm−2.
The effect of pH (5.5–8.0 at 25 °C) on the Urs-GLDH/TiO2–ZrO2/ITO bioelectrode has been investigated using CV to estimate optimum enzyme activity. The highest current (Fig. 3) is obtained at pH 7.0 revealing that bioelectrode is most active at this pH. Thus, all the experiments are carried out at pH of 7.0 and temperature of 25 °C. Inset (i) shows the anodic peak current as a function of pH using CV.
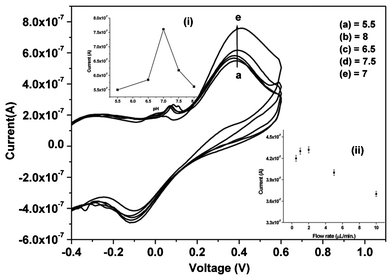 | ||
| Fig. 3 CV response of Urs-GLDH/TiO2–ZrO2/ITO bioelectrode as a function of pH in PBS (5.5–8); inset (i): calibration curve between anodic peak current and pH value and inset (ii): shows the effect of flow rate on the response current | ||
The variation of response current obtained as a function of flow rate (0.5, 1, 2, 5 and 10 μL min−1) has been measured by taking 1 mM urea concentration injected into the microchannel. It has been observed that the optimum flow rate is 2 μL min−1 at which the response current is maximum [inset (ii); Fig. 3]. The parameters which affect the current response are flux of electro active species and retention time for the biochemical reaction. As we increase the flow rate, the retention time is found to be lesser resulting in decreased response current. It has been found that the flux is increased as flow rate increases, but at the same time, the retention time reduces beyond the optimum value of 2 μL min−1. This is due to the fact that the biomolecules are shifted away from the microchannels before completing the biochemical reaction onto the sensor surface.
In the fluid mechanics, Reynolds number (Re) is a dimensionless number that gives a measure of the ratio of inertial forces to viscous forces. The fluid flow through a microfluidics channels can be characterized by Re defined in eqn (5)
 | (5) |
3.4 Electrochemical response studies
Electrochemical response studies of Urs-GLDH/TiO2–ZrO2/ITO bioelectrode have been conducted as a function of urea in presence of NADH and α-KG [Fig. 4A] in PBS, injected into the microchannels at continuous flow rate of 2 μL min−1 using CV. The magnitude of response peak current increases as urea concentration increases. In proposed biochemical reaction (Scheme 3), urease catalyzes hydrolysis of urea to carbamine acid that gets hydrolyzed to ammonia (NH3) and carbon dioxide (CO2). GLDH catalyzes the reversible reaction between α-KG and NH3 to NAD+ and linked oxidative deamination of L-glutamate in two steps. The first step involves a Schiff base intermediate formed between NH3 and α-KG (Step A). Then Schiff base intermediate protonated due to transfer of the hydride ions from NADH resulting in formation of L-glutamate (Step B). NAD+ is utilized in the forward reaction of α-KG and free NH3 that is converted to L-glutamate via hydride transfer from NADH to glutamate. NAD+ is utilized in the reverse reaction, involving L-glutamate being converted to α-KG and free (NH3) via oxidative deamination reaction. The electrons generated during these reactions are transferred to TiO2–ZrO2/ITO electrode. | (6) |
 | (7) |
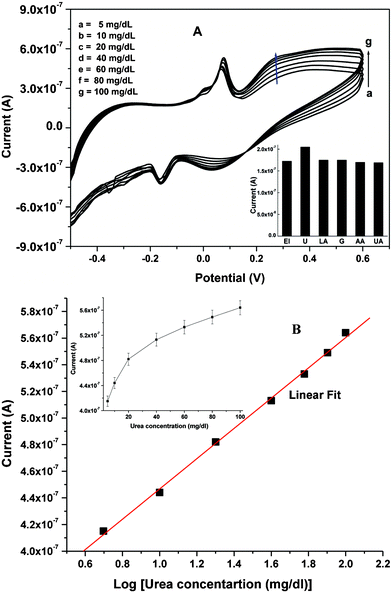 | ||
| Fig. 4 (A) CV response of Urs-GLDH/TiO2–ZrO2/ITO bioelectrode as a function of urea concentration in PBS. Inset shows the effect of interferents (glucose, ascorbic acid, uric acid and lactic acid) on the current response of the Urs-GLDH/TiO2–ZrO2/ITO bioelectrode in PBS. (B) Calibration curve between response current and log urea concentration (5–100 mg/dl); inset (i) shows calibration curve between response current and urea concentration (5–100 mg/dl). | ||
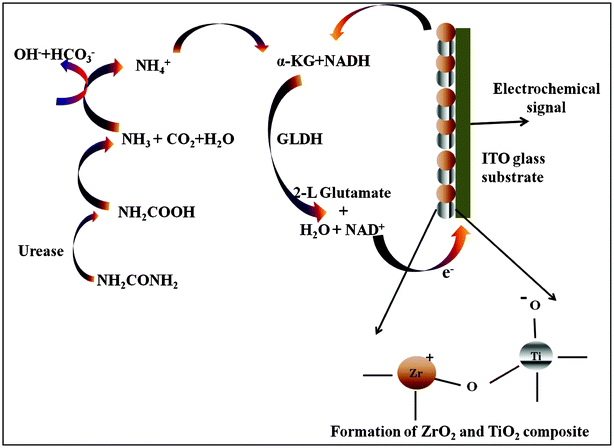 | ||
| Scheme 3 Showing biochemical reaction and electron transfer mechanism at the electrode surface. | ||
Fig. 4B shows the calibration plot between anodic peak current and log of urea concentration (5–100 mg/dL) and inset (i) shows the calibration plot between peak current vs. urea concentration (5–100 mg/dL). The lower detection limit is obtained as 0.07 mg/dL using the 3σb/m equation, where m is slope and σb is standard deviation of the calibration graph. The linear range is obtained as 5–100 mg/dl with sensitivity as 2.74 μA [Log mM]−1 cm−2. The higher sensitivity obtained as compared to reported data8,12,22,23 is not only due to the small geometry of microfluidics device, but also larger surface-to-volume ratio of nanocrystalline TiO2–ZrO2 nanocomposite which increases surface density of enzyme loading. This microfluidics sensor for urea detection shows faster response time (10 s) attributed to small characteristic diffusion length towards microelectrode.
The shelf-life of the microfluidics sensor has been estimated by measuring electrochemical current response with respect to time, in a regular interval of 1 week. It is observed that this bioelectrode retains about 85% of the enzymes (Urs and GLDH) activity even after about 4 weeks when stored in refrigerated conditions (4 °C) after which the current response decreases to 80% in about 6 weeks (data not shown). The reproducibility of response of bioelectrode has been investigated using 10 mg/dL urea concentration. No significant decrease in current is observed after using at least 12 times.
The selectivity of Urs-GLDH/TiO2–ZrO2/ITO bioelectrode (El) has been determined by comparing magnitude of the current response with individual normal concentration of interferents such as glucose (5 mM), ascorbic acid (0.05 mM), uric acid (0.1 mM) and lactic acid (5 mM) along with urea (1 mM) in PBS as shown in inset of Fig. 4A. Results of these studies indicate that the Urs-GLDH/TiO2–ZrO2/ITO bioelectrode is highly specific for the detection of urea only and exhibits negligible interference with other analytes.
The sensing performance of this TiO2–ZrO2 nanocomposite based microfluidics urea biosensor has been summarized in Table 1 along with those reported in the literature.
| Bioelectrodes | Detection range (mM) | Detection limit (mM) | Sensitivity | Response time (s) | Microfluidics based | Ref. |
|---|---|---|---|---|---|---|
| Urs-GLDH/ZnO-Ch/ITO | 0.8–16.6 | 0.49 | 0.13 μA mM−1 cm−2 | 10 | no | 8 |
| Urs/PAPCP/ITO | 0.16–5.02 | — | 0.47 μA mM−1 cm−2 | 40 | no | 22 |
| Urs-GLDH/ZrO2/ITO | 0.8–16.6 | 0.8 | 0.07 μA mM−1 cm−2 | 10 | no | 12 |
| Urs-GLDH/Nano-ZnO/ITO | 0.8–13.3 | 2.24 | 8.7 μA mM−1 cm−2 | — | no | 24 |
| EG-Ag-Z-Epoxy | 0.2–1.4 | 0.05 | 30 μA mM−1 cm−2 | 50 | no | 25 |
| Urs-GLDH /CDT/Au | 1.6–16.6 | 1.5 | 7.5 μA mM−1 cm−2 | 10 | yes | 19 |
| Ur-GLDH/TiO2–ZrO2/ITO | 0.8–16.6 | 0.44 | 2.74 μA mM−1 cm−2 | 10 | yes | Present work |
Conclusions
We have demonstrated the fabrication of a highly sensitive mediator-free microfluidics sensor comprising of PDMS microchannels, patterned electrodes for the rapid detection of urea. Urs and GLDH have been successfully co-immobilized onto TiO2–ZrO2 nanocomposite microelectrodes surface. This mediator-free microfluidics sensor offers improved sensitivity, detection limit and fast response time. This is attributed to the good electrocatalytic behavior of the nanocomposite as well as smaller geometry of the sensor. The reproducibility of bioelectrode has been investigated as 12 times. Efforts should be made to utilize this TiO2–ZrO2 nanocomposite microfluidics device for the estimation of other important analytes including cholesterol and low density lipoprotein.Acknowledgements
We thank Director, National Physical Laboratory, New Delhi, India for providing the facilities. Saurabh Srivastava and Md. Azahar Ali are thankful to CSIR, India for the award of Senior Research Fellowship. Financial support received under the DST sponsored project (DST/TSG/ME/2008/18) is gratefully acknowledged. We are thankful to Mr. Sandeep Singh for AFM studies.References
- G. M. Whitesides, Nature, 2006, 442, 368 CrossRef CAS.
- J. A. Wells, S. Vollmer, T. Bergman and H. Jornvall, Anal. Biochem., 2005, 345, 10 CrossRef.
- B. S. Lee, Y. U. Lee, H. S. Kim, T. H. Kim, J. Park, J. G. Lee, J. Kim, H. Kim, W. G. Lee and Y. K. Cho, Lab Chip, 2011, 11, 70 RSC.
- Q. Xue, A. Wainright, S. Gangakhedkar and I. Gibbons, Electrophoresis, 2001, 22, 4000 CrossRef CAS.
- G. M. Whitesides, E. Ostuni, S. Takayama, X. Jiang and D. E. Ingber, Annu. Rev. Biomed. Eng., 2001, 3, 335 CrossRef CAS.
- H. B.-Yoav, P. H. Dykstra, W. E. Bentley and R. Ghodssi, Biosens. Bioelectron., 2012, 38, 114 CrossRef.
- P. R. Solanki, A. Kaushik, V. V. Agrawal and B. D. Malhotra, NPG Asia Mater., 2011, 3, 17 CrossRef.
- A. Kaushik, P. R. Solanki, A. A. Ansari, G. Sumana, S. Ahmad and B. D. Malhotra, Sens. Actuators, B, 2009, 138, 572 CrossRef.
- P. R. Solanki, A. Kaushik, A. A. Ansari, G. Sumana and B. D. Malhotra, Appl. Phys. Lett., 2008, 93, 163903 CrossRef.
- S. A. Kumar, P.H. Lo and S. M. Chen, Nanotechnology, 2008, 19, 255501 CrossRef.
- S. Liu, Z. Dai, H. Chen and H. Ju, Biosens. Bioelectron., 2004, 19, 963 CrossRef CAS.
- G. Sumana, M. Das, S. Srivastava and B. D. Malhotra, Thin Solid Films, 2010, 519, 1187 CrossRef CAS.
- G. Dhawan, G. Sumana and B. D. Malhotra, Biochem. Eng. J., 2009, 44, 42 CrossRef CAS.
- B. Lakard, G. Herlem, S. Lakard, A. Antoniou and B. Fahys, Biosens. Bioelectron., 2004, 19, 1641 CrossRef CAS.
- Y. Velichkova, Y. Ivanov, I. Marinov, R. Ramesh, N. R. Kamini, N. Dimcheva, E. Horozova and T. Godjevargova, J. Mol. Catal. B: Enzym., 2011, 69, 168 CrossRef CAS.
- X. Wang, J. C. Yu, Y. Chen, L. Wu and X. Fu, Environ. Sci. Technol., 2006, 40, 2369 CrossRef CAS.
- K. L. Frindell, J. Tang, J. H. Harreld and G. D. Stucky, Chem. Mater., 2004, 16, 3524 CrossRef CAS.
- D. Keomany, J. P. Petit and D. Deroo, Sol. Energy Mater. Sol. Cells, 1995, 36, 397 CrossRef CAS.
- S. Srivastava, P. R. Solanki, A. Kaushik, Md. A. Ali, A. Srivastava and B. D. Malhotra, Nanoscale, 2011, 3, 2971 RSC.
- B. M. Reddy and B. Chowdhury, J. Catal., 1998, 179, 413 CrossRef CAS.
- A. J. Bard and L. R. Faulkner, Electrochemical Methods: Fundamentals and Applications, 2nd ed., Wiley, New York Search PubMed.
- V. Rajesh, W. Bisht, W. Takashima and K. Kaneto, Biomaterials, 2005, 26, 3683 CrossRef CAS.
- J. M. C. S. Magalhaes and A. A. S. C. Machado, Talanta, 1998, 47, 191 CrossRef.
- A. Ali, A. A. Ansari, A. Kaushik, P. R. Solanki, A. Barik, M. K. Pandey and B. D. Malhotra, Mater. Lett., 2009, 63, 2473 CrossRef CAS.
- F. Manea, A. Pop, C. Radovan, P. Malchev, A. Bebeselea, G. Burtica, S. Picken and J. Schoonman, Sensors, 2008, 8, 5806 CrossRef CAS.
| This journal is © The Royal Society of Chemistry 2013 |
