Cyanobiphenyl liquid crystal composites with gold nanoparticles†
Karen Kolya
Vardanyan
*a,
David Matthew
Sita
b,
Robert Dominic
Walton
c,
William Mark
Saidel
d and
Keith Michael
Jones
e
aDept. of Physics, SIUE, Box 1654, SL-2336, Edwardsville, IL 62026, USA. E-mail: kvardan@siue.edu; Fax: +1-618-650-3556; Tel: +1-618-650-3148
b9 Copperfield Court, Eatontown, NJ 07724, USA. E-mail: dms493@camden.rutgers.edu; Tel: +1-908-489-0688
c7 Taylor Lane, Deptford, NJ 08096, USA. E-mail: r.walton2@yahoo.com; Tel: +1-609-680-4115
dDept. of Biology, Rutgers-Camden, Science Bld, #B-4 315 Penn St., Camden, NJ 08102, USA. E-mail: saidel@camden.rutgers.edu; Tel: +1-856-225-6336
eAsylum Research, 6310 Hollister Ave, Santa Barbara, CA 93117, USA. E-mail: keith@asylumresearch.com; Tel: +1-805-696-6467
First published on 15th November 2012
Abstract
We study composites of mainly room temperature nematic cyanobiphenyl liquid crystals (nCB with n = 5, 6, 7, and 8) with gold nanoparticles (GNP). We report that doped GNP dramatically affects the material and, consequently, display parameters and mesophase stability of 5CB, 6CB, and 7CB homologues, while no homogeneous dispersion of GNP occurs in the 8CB homologue. We report several composites with values of switching voltages and times a few times lower than those for pure nematics, and with a broader operational thermal range, which makes them good candidates for application in liquid crystal (LC) display devices. We show that the amount of carbon atoms n in the alkyl “tail” of CB's constituent molecules and the concentration of doped GNP are critical factors in the behavior of the material parameters in the nanocomposites. We report certain correlations of the behavior of the material parameters with odd-to-even-to-odd changes in n. We propose that the doped nanoparticles aggregate with LC molecules affecting the local ordering, and consequently changing nCB's material parameters. The study of the morphology of the samples by SEM and AFM imaging techniques articulates our proposed ideas.
1. Introduction
1.1 Liquid crystals and their applications
Liquid crystal (LC) materials have optical properties characteristic for optical uni-axial (nematic LC) and bi-axial (smectic-C) crystals. However, due to their mobility at microscopic and macroscopic levels, LC materials have great advantages over traditional optical crystals.1–3 The optical properties of these materials can be easily controlled by applied low electric and magnetic fields. Hence LC materials have broad applications in many engineering devices, such as LC displays (LCD).4,5 The world market for LC displays continues to grow and today accounts for $8 billion annually.5 LC materials with a nematic mesophase are utilized in virtually all LCD applications. Hence, the study of this thermotropic LC phase has critical technological importance.Nematic LC (NLC) materials are utilized in switchable diffraction gratings, referred to by scientists as holographically formed polymer dispersed liquid crystals (H-PDLC). These gratings have applications in video displays,6 switchable focus lenses,7 electro-optic filters,8 photonic time-delay generators for optically assisted phased array radar,9 guided-wave switches for wavelength division multiplexing,10 electrically addressable security holograms for credit cards, automotive lighting distribution systems,11 and more. The proper electro-optical performance of these devices requires high diffraction efficiency, low threshold voltage, and fast switching.12,13 These applications also require a wide operational thermal range, which includes room temperature. One way to obtain materials with proper electro-optical properties is chemical synthesis, which could be costly and requires a great deal of effort from organic chemists. The alternative to this method is preparing multi-component mixtures. The knowledge of the material parameters of the individual components promotes scientists to select the appropriate compounds for the possible enhancement of the display parameters. However this is a challenging task, as optimizing one property usually changes other properties, mostly in undesirable directions.
1.2 Liquid crystals and nanoscience
Nanotechnology worldwide focuses on the design of nanomaterials that are able to self-assemble into functional superstructures. Utilizing LC medium as an organizing template to induce nanomaterials is one of the powerful methods to achieve this goal.14–17 The ability of the LC medium to create self-organized nanomaterials in two or three dimensional space is an important stimulus for the future development of nanotechnology.14–17Nanoparticles are a major class of nanomaterials. Nanoparticles can be amorphous or crystalline in nature. The size of nanoparticles varies from a few to a hundred nanometers. The shape of nanoparticles can be spherical, elliptical, cylindrical, etc. Moreover, the electronic, optical, magnetic, and chemical characteristics of nanoparticles depend on their size and shape. Therefore these particles exhibit unusual features different from those of bulk materials.
Among nanoparticles, gold nanoparticles (GNPs) are frequently studied as they have great application potential. Brust et al.18 synthesized monolayer-protected GNPs in organic solvents, which exhibit a LC mesophase. The authors of ref. 19 and 20 reported the synthesis of gold nanoparticles with liquid crystalline compounds. The quasi-isotropic GNPs were oriented in one-dimensional order, where the LC phase acted as a template. Cseh et al.21 reported the synthesis of room-temperature nematic GNPs covered with laterally attached rod-like LC molecules. And Wojcik et al.22 reported GNPs capped with a mixed-monolayer of alkanethiol and rod-like mesogenic terminal thiols with fork-like end groups.
The dispersion of nanoparticles in LC hosts is another important direction in LC nanoscience. Hegmann et al.23 reported an enhanced electro-optical response in planar nematic cells doped with gold particles. Prakash et al.24 reported a non-volatile memory effect in nanoparticle-doped ferroelectric LCs. Joshi et al.25 reported a decrease of the threshold voltage of a ferroelectric liquid crystal (FLC), named KCFLC 7S, by doping with 3 wt% GNPs with about 20–30 nm average size. The authors of ref. 25 also observed in the SmC* phase of this FLC material (cells with planar orientation), a low frequency dielectric mode (∼100 Hz) along with the Goldstone mode (GM; ∼1 kHz). The authors attribute the occurrence of this low frequency mode to the effective ionization-recombination effect in the low frequency regime due to the presence of ionic impurities in the FLC material with conductivity increased by doped GNP.
Obtaining defect-free nanoparticle/LC dispersions is a critical issue for their successful utilization in electro-optic devices. In LC samples with homeotropic alignment, the presence of nanoparticles may cause the appearance of birefringent stripes.26 And in samples with planar alignment, doped nanoparticles may cause a homeotropic alignment.26 Urbanski et al.26 reported closed-loop and open-ended disclination line defects in the sample with homeotropic orientation of a nematic, 5-n-heptyl-2-(4-n-octyloxyphenyl)pyrimidin (FELIX-2900-03), doped with 1 wt% functionalized GNPs. Observing these birefringent stripes through a polarizing optical microscope (POM) and fluorescence confocal polarizing microscope (FCPM), the authors concluded that the defects did not extend through the entire cell gap and were located at the LC/substrate interface.
As mentioned earlier, in order to achieve good performance for H-PDLC gratings, one needs to utilize LC materials with high diffraction efficiency, e.g. high optical anisotropy. There are several records in the literature indicating the enhancement of optical anisotropy of LC materials by doped nanoparticles. Different nanoparticles were utilized successfully for this purpose, such as C6027–29 and carbon nanotubes (CNT).30,31 There are also reports of utilizing doped nematics in H-PDLC gratings.32–37 In particularly, Abbasov et al.37 reported the recording of permanent holographic images in cells with a thickness of 15 microns utilizing the nematic 5CB (4-cyano-4′-pentyl-1, 1′-biphenyl), doped with 0.6% methyl red (MR) and 0.002% single-wall carbon nanotubes (CNTs). These gratings were formed on the basis of trans-cis-trans isomerism in MR molecules induced by absorbed light. The authors reported that the average first-order diffraction efficiency for nanocomposite LC was about twice that of MR-only doped cells.
Another important aspect of the research on LC/nanoparticles systems is the effects of doped nanoparticles on material parameters and thermal range of the LC phase. Mikulko et al.38 reported that the small inclusion of ferroelectric nanoparticles to a ferroelectric liquid-crystalline mixture yields a decrease in switching times for the nanocomposite (as compared to the pure LC). The authors attributed this fact to the higher local field as a result of anti-parallel dipole–dipole correlation between the LC molecules and nanoparticles. Prasad et al.39 reported that inclusion of low percentage (up to 5%) of alkylthiol-capped GNPs in a room temperature nematic LC, 4-pentyl-4′-cyanobiphenyl (5CB), decreases nematic-isotropic liquid (IL) transition at a rate of about 1 °C per 1 wt% increase of gold concentration. Pandey et al.40 doped the same nematic, 5CB, with 0.1 wt% functionalized GNPs, Au140[S(CH2)5CH3]53, and reported that the presence of GNPs with an average size of 2.4 nm increases the nematic-IL transition temperature, and decreases the dielectric anisotropy and threshold voltage. The authors attributed these results to the anti-parallel dipole–dipole correlation between the LC molecule and nanoparticle. In ref. 41 the same authors reported a decrease of the threshold voltage in another room temperature nematic LC, 4-(trans-4′-n-hexylcyclohexyl)isothiocyanatobenzene (6CHBT), doped with 0.01% and 0.02% single-wall carbon nanotubes (SWCNTs). They proposed that this decrease is caused by the presence of about 40–120 times longer SWCNTs between the molecules of the LC. This presence decreases the elastic parameter due to the excess volume for LC molecules, and increases the dielectric anisotropy due to the increase of the order parameter. The combined effect of these two behaviors was the decrease of the threshold voltage.
It is worth mentioning that in all of the above-mentioned reports only a small fraction of nanoparticles were uniformly dispersed in the LC. However, we reported in ref. 14–17 the dispersion of higher than 5 wt% GNP in 5CB, 6CB, and 7CB nematics (nCB in general, where n is the homologue number). In ref. 14 and 15 we reported the inclusion of up to 90 wt% GNP, 0.75A520, with constituent molecules of 10 nm size, in 6CB. We reported a substantial (15 °C) increase of nematic-IL phase transition point in the systems with 35% and 45% GNP. We also reported that nanoparticles dispersed at certain concentrations increase the dielectric anisotropy, elastic parameter, and the rotational viscosity from their pure nematic values. However, the nematic with 65% GNP had the optimal display parameters, about two-times lower than the pure nematic value threshold voltage, and more than five times lower switching-off time. In ref. 16 we reported the inclusion of up to 20 wt% GNP in another cyanobiphenyl homologue, 5CB. We reported that at 15% GNP, the threshold voltage decreases to 1.2 times its value for the pure nematic and the switching-off time decreases by a factor of 3. And, finally, in ref. 17 we studied the dispersion of GNP in 7CB. We reported that only viscosity and, consequently, switching-off time are affected by the gold in this homologue. We proposed that these observed differences between the properties of different homologues doped with gold are due to differences in the amount of carbon atoms in the alkyl fragment of the LC molecules. In the current work, we show that 8CB homologue does not disperse GNPs at all, and we review the effects of the doped GNPs and their concentration on nematic phase properties for CB homologues with n = 5, 6, 7, 8.
2. Experimental section
Cyanobiphenyl homologues combine low melting points with reasonably high nematic-LC temperature transition points.5,14–17 They have reasonably low viscosity, and they are chemically and photo-chemically stable. These facts made them one of the first commercially viable nematic liquid crystals for use in simple watch and calculator-type displays, and passive-matrix addressed and in-plane switching display technologies. Note that Yailoyan et al.,42 using Monte-Carlo and atom-atomic potential methods, showed a strict correlation between the amount of carbon atoms (n) in the alkyl fragment of cyanobiphenyl constituent molecules and the thermal properties of the bulk nematic. The authors reported that crystal-mesophase and mesophase-isotropic liquid transition temperatures decrease with the odd-to-even change in n, and increase with the even-to-odd change. The authors also reported an explicit even-to-odd correlation of the internal energy, heat capacity and the geometrical molecular anisotropy. In particular, with odd-to-even increase in n the geometrical molecular anisotropy increases.The compounds 5CB, 6CB, 7CB, and 8CB with 98% purity are commercially available from Sigma-Aldrich, USA. Fig. 1 depicts the chemical structure of nCB family.5,17
 | ||
| Fig. 1 Chemical structure of CB homologues. | ||
We used a gold colloid solution (displaying a light reddish color) with a 10 nm constituent molecules size, 0.75A520 units mL−1 (Sigma-Aldrich, USA), as the additive to nCBs. The mixtures were made by thoroughly heating above the nematic-IL phase transition point and stirring the materials. The prepared mixtures were then introduced by capillary filling into LC cells with 8 micron thickness. The cells had conductive indium tin oxide (ITO) inner surfaces. These surfaces were prepared to produce a planar orientation of LC molecules (long axes parallel to the glass surfaces). The cells were purchased from Instec, Inc.
The measurements of the ‘static’ (measured at 1 kHz signal) dielectric parameters, splay and bend elastic parameters, and viscosity of the nanocomposites were carried out by an ALCTE1A characterization device from Instec, Inc. The phase transitions of the samples were monitored by an Eclipse 50i polarizing microscope from Nikon with a mounted HT-KP-D20B CCD camera from Hitech Instruments. The same camera has been used to obtain microphotographs of optical textures. The samples were heated and cooled by a TS62 microscope thermal stage from Instec. Note that this stage has ±0.1 degrees of Celsius temperature determination accuracy. The switching times were measured using an ALCTE1A characterization device and dynamic switching method. A more detailed description of these experimental methods is given elsewhere.14–17 Note that the accuracy of all measurements is about ±1%. All standard deviations of the measurements evaluated for three trials are less than or equal to the size of the markers in the figures.
To study the morphology of the materials, the techniques of scanning electron microscopy (SEM), and atomic force microscopy (AFM) have been applied. For SEM technique, liquid droplets of the various doped LC compounds were examined in a Leo 1450EP equipped with a Deben Cool stage Peltier apparatus. The compounds were frozen below 0 °C and equilibrated to 1–5 Torr within the specimen chamber. Images were captured with back-scatter and secondary detectors and saved in tif format.
For imaging with the AFM, the samples were cooled to −10 °C using a Peltier cooler/heater stage on an MFP-3D AFM from Asylum Research. In order to see the crystal structure of the LC compounds, the samples were first heated to 70 °C for about 5 min, then 75 °C for 30 s in order to excite the LC compounds to an amorphous state, then rapidly cooled at 120 °C min−1 to −10 °C to form solid crystals. Images were taken in AC mode with an AC240TS probe from Olympus.
The phase-mesophase sequences of nCBs along with GNP percentages at which the systems become conductive are shown in Table 1.
| n | GNP conc. | GNP conc. at which CB become conductive | C-SmA | C–N | SmA-N | N-IL |
|---|---|---|---|---|---|---|
| C – crystal; SmA – smecticA; N – nematic; IL – isotropic liquid. | ||||||
| 5 | 0, 2, 5, 10, 15, 20% | 25% | N/A | 24 °C | N/A | 35 °C |
| 6 | 0, 2, 5, 10, 15, 25, 55, 65, 75, 85, 90% | 95% | N/A | 13 °C | N/A | 30 °C |
| 35, 45% | N/A | 13 °C | N/A | 45 °C | ||
| 7 | 0, 5, 10, 15, 25, 35, 45% | 55% | N/A | 30 °C | N/A | 43 °C |
| 1, 2% | N/A | 29 °C | N/A | 44 °C | ||
| 8 | 0% | N/A | 22 °C | N/A | 34 °C | 41 °C |
3. Results and discussions
3.1 Previously reported results
In our previously published articles,14–17 we reported the effects of dispersed GNP on material and consequently display parameters of nCB homologues (n = 5, 6, 7). We have reported defect-free, stable materials with increased LC operational thermal range and enhanced display parameters, where the gold percentage in the mixtures has a crucial role. In the current article we show that GNP is not dispersed at all in the 8CB homologue, and we finalize the results for CBs with n = 5–8. We show that the amount of carbon atoms in the ‘tail’ of the nematic molecule along with GNP concentration critically affects the way the dispersed nanoparticles affect the LC material parameters. Note that we have obtained stable and defect-free dispersions in trials of data acquisition completed at intervals of about eight months, showing good consistency.173.2 Orientational order and material parameters of nematics
 | (1) |
 | (2) |
 | (3) |
The anisotropy of any material parameter of the bulk LC phase is proportional to the molecular anisotropy and the order parameter:5,15–17
| ΔB = ΔMS | (4) |
Here ΔB is the anisotropy of the bulk material parameter; ΔM is the molecular anisotropy of the parameter. ΔB can be dielectric anisotropy, viscosity anisotropy and elastic anisotropy of the material. Therefore, to increase the dielectric anisotropy, one needs to increase either the molecular anisotropy by chemically synthesizing new LC materials or the order parameter by preparing mixtures of different nematics. Sometimes these methods lead to an increase of both mentioned quantities.
The phenomenological theory that describes liquid crystals is called the continuum theory.43–48 The equilibrium state of the director in non-chiral systems (such as nCB) is a non-varying director. Deviation from this condition is analogous to the change in the length of a spring from its equilibrium length. Hence, just as for the spring the elastic energy is proportional to the square of the deviation in the length, for LC the free energy per volume is proportional to the square of spatial derivatives of the director. For non-chiral nematics this expression is as follows:48
 | (5) |
LCs flow as with any other fluid; however, the structure of LC molecules causes anisotropy in its flow behavior and, as a result, anisotropy in the mutual geometry of the shearing stress and the director. The effective viscosities γi for any arbitrary geometry in LC are defined by the ratio of the shearing viscous stress tij to the velocity gradient of the flow ∂vi/∂xj:48
 | (6) |
The anisotropy in the dielectric constant is Δε = εpar − εperp. For εpar, the field is parallel to the molecule's long axis. And for εperp, the field is perpendicular to the molecule's long axis. Depending on the permanent dipole moment and polarizability of the molecules, this anisotropy can be either positive or negative. The values of dielectric constants for a typical nematic 5CB are within the range of 6 to 10.47 It is important to indicate that dielectric anisotropy dependence on temperature is similar to order parameter temperature behavior.
Birefringence is a property of all anisotropic materials. The index of refraction for light polarized perpendicular to the optical axis is extraordinary index ne (in LCs corresponding to npar), and for light polarized parallel to the axis is ordinary index no (in LCs corresponding to nperp). The difference between the two indices of refraction is optical anisotropy Δn. The optical anisotropy, unlike the dielectric anisotropy, is always positive. This is the result of the fact that in LCs the optical index of refraction does not depend on the orientational part of the molecules’ polarizability.48 It depends on the electronic and atomic contributions in the polarizability. Therefore, for the optical frequencies the anisotropy depends on configuration of the molecules. For most cases in LCs the direction of the absorbing oscillator coincides with the direction of the longitudinal axis of the molecules. Hence, the light polarized along the direction of the director (characterized by npar) is always absorbed more than the light polarized along the perpendicular direction (characterized by nperp). As a result, Δn is always positive in LC materials. The values of indices for 5CB are within the range of 1.5 to 1.9.47 Two optical indices are equal to the square roots of the corresponding dielectric permittivities at high frequencies. Therefore, the difference in the square roots of the indices is proportional to the order parameter. Note that the materials with high optical anisotropy are good candidates for applications in the above-mentioned H-PDLC gratings.
Below we present the dependences of CB systems' (n = 5–8) dielectric anisotropy, elasticity, and rotational viscosity versus the gold concentration. Note that, as in ref. 17, the data comparison analysis for different CB homologues is carried out considering eqn (4), e.g., the anisotropy of the material parameters in LC bulk phase is proportional to the order parameter and molecular anisotropy. Therefore fixing the order parameter allows consideration of the LC bulk phase anisotropy as a single-variable function of the molecular anisotropy. The latter depends on the molecular structure features of the homologues: e.g., the alkyl tail length or the number of homologue. The above-described Maier-Saupe theory predicts for nematics the dependence of the order parameter versus the ratio r = T/TNI (which correlates very well with experimental data for many nematics48). Therefore we consider the material and behavior of the display parameters versus gold concentration at fixed T/TNI for all homologues, as the values of the order parameter are close at this fixed ratio and the differences in parameter behavior versus GNP concentration is caused mainly by the number of the homologue in the CB systems. Note that we choose the fixed temperature t in degrees Celsius (T = t + 273) for each homologue using the following expressions:17
 | (7) |
Fig. 2 illustrates the dielectric anisotropy dependences versus GNP concentration for CB homologues at the fixed temperature ratio T/TNI. One can see that for 5CB systems at GNP percentages of 2, 5, 10, and 20%, the dielectric anisotropy is higher than its value for the pure nematic. And at 15% the anisotropy is about 1.8 times less than the pure nematic's value. As for 6CB systems, the dielectric anisotropy in general stays higher than its value for the pure nematic, and it decreases at 75 and 90%. Fig. 8 shows that the dispersed GNP does not affect the 7CB systems' dielectric anisotropy, other than a little increase at 10% GNP. One can see from Fig. 2 that for the pure homologues there is a certain correlation between the number of the homologue and the dielectric anisotropy: with odd-to-even increase the anisotropy decreases and with even-to-odd increase the anisotropy increases. In ref. 14–17 we attributed the dielectric anisotropy behavior versus gold concentration for CB systems to the formation of LC/gold (anisotropy increases) and gold/gold (anisotropy decreases) aggregations. We indicated that GNP concentration and the number of homologue dictate which energetically favorable packaging in a given volume is formed. In ref. 15–17, considering the obtained results within the framework of Maier and Meier theory,5 we also proposed a model describing the affect of the doped gold on the systems' molecular packaging. The authors of ref. 42, described in section 2 above, reported that the change of n from even number to odd number causes a decrease in the geometrical anisotropy of the CB molecules. We propose that, due to this decrease, 5CB and 7CB molecules aggregate with gold with less effectiveness, which results in relatively fewer dimers to be disturbed by gold. This, in turn, has a milder effect on the increase of the dielectric anisotropy. The fact that 8CB homologue does not disperse GNP at all is more likely related to the increase of the molecules’ hydrophobic alkyl tails, which do not allow the gold colloid to be dispersed in the matrix of CB. Note that there are two interesting odd-to-even-to-odd effects in CB systems, which are obvious from Table 1 and Fig. 2. The gold percentage at which the systems become conductive and the nematic's thermal range both increase and then decrease with odd-to-even-to-odd change of n.
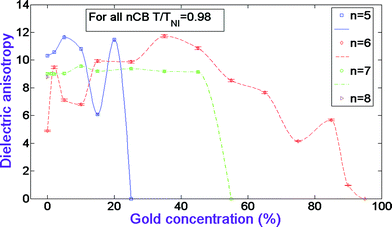 | ||
| Fig. 2 Dielectric anisotropy dependences versus gold concentration in nCB systems. The data for CB n = 5–7 homologues have been adopted from ref. 17. | ||
Now we discuss the behavior of the CB systems’ elastic parameters versus GNP concentration. Fig. 3 illustrates this behavior. Note that we take the average of the splay and bend constants and assume that for the nematic samples with planar orientation the twist elastic constant is zero. Fig. 3 shows that for 5CB systems at 2, 5, 10, 20% GNP concentrations the elasticity increases from the pure nematic’s value by about the same factor as the dielectric anisotropy increases at the same concentrations. And at 15% the elasticity, like the dielectric anisotropy, decreases from the pure nematic’s value. However, while the dielectric anisotropy decreases 1.8 times, the elastic parameter decreases about 1.3 times. Fig. 3 shows that for 6CB systems, like the analogous behavior of the dielectric anisotropy, the elasticity stays higher than the pure nematic's value at all GNP percentages except at 75 and 90%. The described increase of the elasticity for 5CB and 6CB systems can be attributed to the increase of the LC molecules’ ‘stiffness' due to intra-cluster interactions in LC/gold aggregations between LC molecules and the nanoparticles.17 We attribute the decrease of the elasticity in the systems to the increase of the anti-parallel packing manner LC dimers, as a result of formed gold/gold aggregations, which decreases the order parameter and consequently decreases the elasticity of the system.17 One can see from Fig. 9 that the doped GNP has a very mild effect on the average elastic constant of 7CB systems. Note that for the pure CBs the elasticity decreases first with n, changing from 5 to 6, and then increases with the increase of n.
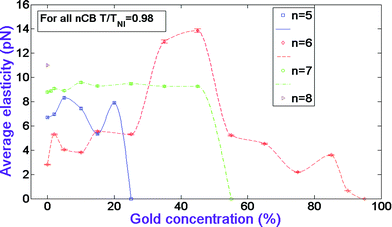 | ||
| Fig. 3 Average elastic parameter dependences versus gold concentration in nCB systems. The data for CB n = 5–7 homologues have been adopted from ref. 17. | ||
Fig. 4 illustrates the rotational viscosity dependences versus gold concentration in the systems. One can see from Fig. 4 that in 5CB systems the viscosity increases first at 2% gold, and then gradually decreases to its minimum value at 15%. It jumps again at 20%. The value of the viscosity in 6CB systems stays higher than the pure nematic's value up to 65%, and stays lower at 65% and higher GNP percentages. As for the viscosity behavior of 7CB systems, one can see from Fig. 4 that it stays higher than the pure nematic's value at 1, 2, 15, 25, and 45% gold. It remains equal to the pure nematic's value at 5 and 35% gold, and has its minimum value at 10% GNP. We attribute the increase of the viscosity from the pure nematic's value in 6CB systems to the above-mentioned LC/gold aggregations, which restrain the flip-flop motions of LC molecules.17 On the other hand, with the doping of more nanoparticles, the number density of LC molecules decreases which could cause the opposite effect. In the case of 5CB systems, the viscosity decreases at almost all GNP percentages. We propose that due to the formation of relatively fewer aggregations, mentioned above, the effect of the decrease of the number density of LC molecules prevails against the restraining effect of the aggregations. The dramatic decrease of the viscosity in 5CB at 15% gold could be attributed to the formation of gold/gold aggregations, where nanoparticles about five times ‘taller’ than LC molecules allow more space for the molecules' flip-flop motion.17 Finally, the increase of the viscosity in 7CB systems from the pure nematic's value at certain gold concentrations again can be attributed to formed LC/gold aggregations which have a restraining effect on the flip-flop motion of LC molecules.
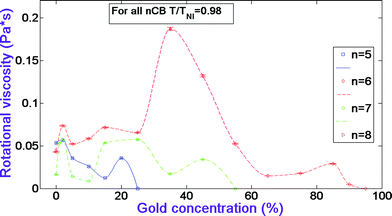 | ||
| Fig. 4 Rotational viscosity dependences versus gold concentration in nCB systems. The data for CB n = 5–7 homologues have been adopted from ref. 17. | ||
3.3 Nematic's diffraction efficiency and display parameters
| η ∼ (Δnπd/λ)2 | (8) |
The threshold voltage and switching times for nematic LC are respectively:5,13,15–17
 | (9) |
 | (10) |
 | (11) |
Eqn (4), (9), (10), and (11) imply that if the molecular anisotropies of the dielectric permittivity, viscosity and elasticity are unchanged, increasing the order parameter and accordingly the anisotropies of the bulk material does not affect the threshold voltage and the switching times.
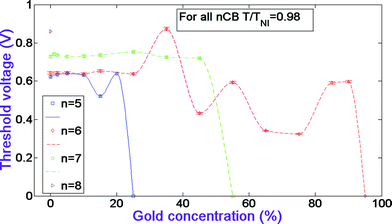 | ||
| Fig. 5 Threshold voltage dependences versus gold concentration in nCB systems. The data for CB n = 5–7 homologues have been adopted from ref. 17. | ||
Fig. 6 depicts the switching-off time dependences versus gold concentration in the systems. Fig. 6 shows that in 5CB systems with the increase of gold concentration, the switching-off time slightly increases at 2% and then gradually decreases from the pure nematic's value to the minimum value at 15% gold, and then increases again at 20% gold. As for 6CB systems, one can see that the time undergoes several decreases and increases with increasing GNP concentration. At 65% it drops to its minimum value. Interestingly, unlike the threshold voltage, the switching-off time of 7CB systems is affected dramatically by the doped GNP. It increases from the pure nematic's value at 1, 2, 15, 25, and 45% gold. It has the same value as the pure nematic at 5 and 35% GNP, and reaches its minimum value at 10% gold. Note that with odd-to-even-to-odd changes in n for the pure CBs there is a certain correlation with the increase-decrease-increase of the switching-off time. Eqn (10) implies that at fixed cell thickness the elasticity and the rotational viscosity of the material define the value of the switching-off time. Hence, as in the case with the threshold voltage, one can conclude from Fig. 3, 4 and 6 that a very good correlation exists between the obtained experimental data and the theoretical expression in eqn (10).
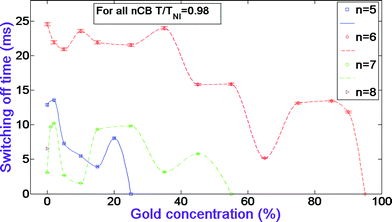 | ||
| Fig. 6 Switching-off time dependences versus gold concentration in nCB systems. The data for CB n = 5–7 homologues have been adopted from ref. 17. | ||
Finally, below we present the tabulated optimal values of display parameters for the studied materials. We believe that these materials can be successfully utilized in LCD and H-PDLC applications of liquid crystals. Table 2 presents the optimal materials with respect to the threshold voltage, e.g. those that have minimum values. Table 2 shows that 5CB with 15% has threshold voltage only slightly less than the pure nematic's value. However, 6CB with 65 and 75% have threshold voltage about two times less than the pure nematic's value. The table also presents the corresponding values of the switching-off time and thermal range for the optimal materials.
| n | Optimal GNP conc. for Vth | V th for optimal conc. at T/TNI = 0.98 | V th for pure LC at T/TNI = 0.98 | τ off for optimal conc. at T/TNI = 0.98 | C-LC point for optimal conc. | LC-IL point for optimal conc. | Theoretical range increase |
|---|---|---|---|---|---|---|---|
| V th, threshold voltage; τoff, switching-off time; C, crystal; IL, isotropic liquid | |||||||
| 5 | 15% | 0.5220 ± 0.005 V | 0.6230 ± 0.0062 V | 3.927 ± 0.0393 ms | 24 °C | 35 °C | None |
| 6 | 65% | 0.3410 ± 0.003 V | 0.6430 ± 0.0064 V | 5.160 ± 0.0516 ms | 13 °C | 30 °C | None |
| 75% | 0.3240 ± 0.003 V | 13.14 ± 0.1314 ms | 13 °C | 30 °C | None | ||
| 7 | None | N/A | 0.7290 ± 0.0073 V | N/A | N/A | N/A | N/A |
| 8 | N/A | N/A | 0.8600 ± 0.0086 V | N/A | N/A | N/A | N/A |
Table 3 presents the optimal materials with respect to the switching-off time, e.g. those that have minimum values. One can see from the table that 5CB with 15% gold has switching-off time more than 3 times less than the pure nematic's value. 6CB with 65% GNP has decreased by a factor of a little less than 5, and 7CB with 10% gold decreased by a factor of 2. The table also presents the corresponding values of the threshold voltage and thermal range for the optimal materials.
| n | Optimal GNP conc. for τoff | τ off for optimal conc. at T/TNI = 0.98 | τ off for pure LC at T/TNI = 0.98 | V th for optimal conc. at T/TNI = 0.98 | C-N point for optimal conc. | N-IL point for optimal conc. | Theoretical range increase |
|---|---|---|---|---|---|---|---|
| τ off, switching-off time; Vth, threshold voltage; C, crystal; N, nematic; IL, isotropic liquid. | |||||||
| 5 | 15% | 3.927 ± 0.0393 ms | 12.89 ± 0.1289 ms | 0.5220 ± 0.0052 V | 24 °C | 35 °C | None |
| 6 | 65% | 5.160 ± 0.0516 ms | 24.56 ± 0.2456 ms | 0.3410 ± 0.0034 V | 13 °C | 30 °C | None |
| 7 | 10% | 1.531 ± 0.0153 ms | 3.080 ± 0.0308 ms | 0.730 ± 0.0073 V | 30 °C | 43 °C | None |
| 8 | N/A | N/A | 6.552 ± 0.0655 ms | N/A | N/A | N/A | N/A |
Table 4 presents the optimal materials with respect to the operational thermal range, e.g. those that have maximum values. One can see from the table that 7CB systems with 1 and 2% gold have only a 2 degree increase in thermal range in comparison with the corresponding pure nematic's value. And 6CB systems with 35 and 45% have a substantial 15 degree increase in thermal range with respect to the corresponding pure nematic's value. The table also presents the corresponding values of the threshold voltage and switching-off time for the optimal materials.
| n | Optimal GNP conc. for thermal range | Increase in thermal range | C-N point for pure LC | N-IL point for pure LC | V th for optimal conc. at T/TNI = 0.98 | τ off for optimal conc. at T/TNI = 0.98 |
|---|---|---|---|---|---|---|
| C, crystal; N, nematic; IL, isotropic liquid; Vth, threshold voltage; τoff, switching-off time. | ||||||
| 5 | None | N/A | N/A | N/A | N/A | N/A |
| 6 | 35% | 15 °C above LC-IL | 13 °C | 30 °C | 0.873 ± 0.0087 V | 23.98 ± 0.2398 ms |
| 45% | 0.432 ± 0.0043 V | 15.83 ± 0.1583 ms | ||||
| 7 | 1% | 1 °C above LC-IL, and below C-LC | 30 °C | 43 °C | 0.742 ± 0.0074 V | 9.712 ± 0.0971 ms |
| 2% | 0.737 ± 0.0074 V | 10.22 ± 0.1022 ms | ||||
| 8 | N/A | N/A | N/A | 41 °C | N/A | N/A |
3.4 SEM images
The morphology of the samples was studied by SEM imaging technique (see section 2). Fig. 7, 8, and 9 illustrate the images of 5CB, 6CB, and 7CB systems, respectively, at different GNP concentrations.16,17Fig. 10 shows the images of 8CB systems and also gold nanoparticles.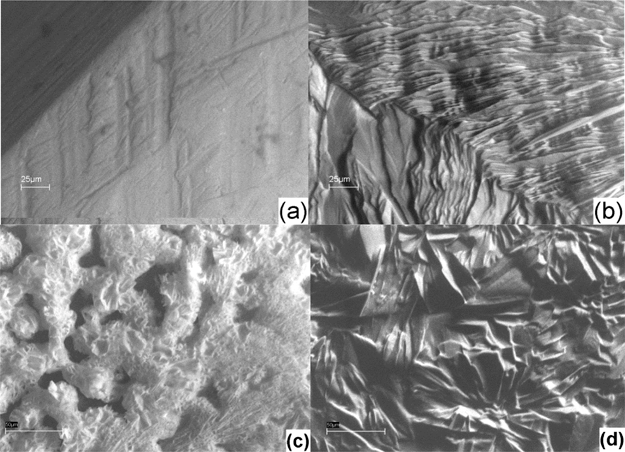 | ||
| Fig. 7 SEM images of 5CB (a); 5CB/2% GNP (b); 5CB/15% GNP (c); 5CB/20% GNP (d). The magnification is ×1000. The images are all from a back scattering detector. The images have been adopted from ref. 16 and 17. | ||
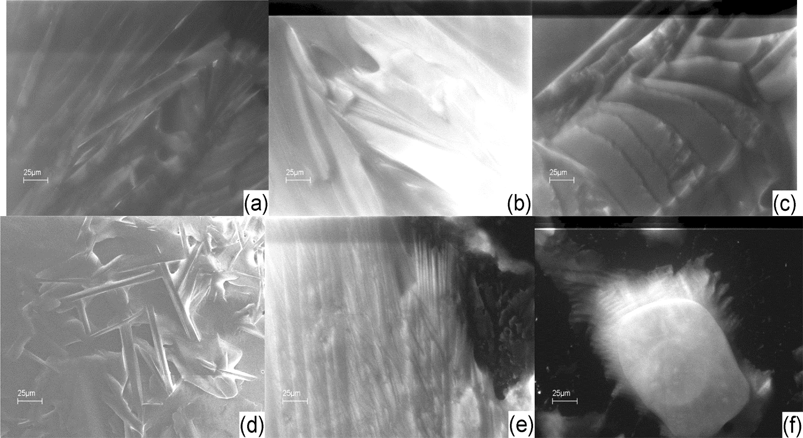 | ||
| Fig. 8 SEM images of 6CB (a); 6CB/2% GNP (b); 6CB/10% GNP (c); 6CB/35% GNP (d); 6CB/75% GNP (e); 6CB/85% GNP (f). The magnification is ×1000. The images are all from a back scattering detector. The images have been adopted from ref. 17. | ||
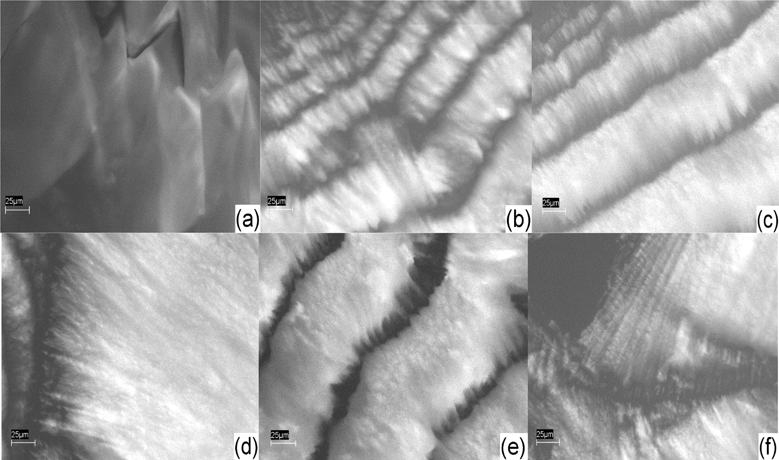 | ||
| Fig. 9 SEM images of 7CB (a); 7CB/2% GNP (b); 7CB/1% GNP (c); 7CB/25% GNP (d); 7CB/35% GNP (e); 7CB/45% GNP (f). The magnification is ×1000. The images are all from a back scattering detector. The images have been adopted from ref. 17. | ||
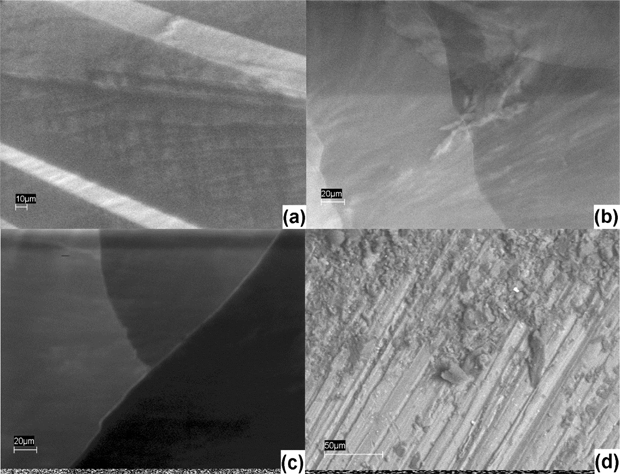 | ||
| Fig. 10 SEM images of 8CB (a); 8CB/5% GNP (b); 8CB/18% GNP (c); GNP (d). The magnification is ×1000. The images are all from a back scattering detector. | ||
Fig. 7 illustrates that the pure sample is homogeneous, and the image of 5CB at 15% GNP has unique features different than all the other samples. It also appears to have less local orientational order than the other samples with dispersed gold. One can see from Fig. 8 that the images of 6CB at 2, 35, and 85% GNP have similar features. These are the gold percentages at which, as we proposed above, LC/gold aggregations are formed in the systems. On the other hand, the images of 6CB at 10 and 75% gold have different features than the other images. Note that these are GNP percentages at which, according to our proposed model, gold/gold aggregations are formed in the systems. Fig. 9 illustrates that the images of 7CB systems with all presented GNP percentages have similar features. This fact indicates that in these systems more likely only LC/gold aggregations are formed. Note that these SEM images confirm our proposed idea of the formation of different types of aggregations in the studied systems that are dependent on gold concentration. Finally, Fig. 10 illustrates that no dispersion occurs in 8CB systems. One can see that the images at 5 and 18% GNP have sharp boundaries of two different regions corresponding to LC and GNP. Fig. 10d illustrates the image of gold nanoparticles. One can clearly see the orientational order in GNP, which, we propose, is the most important factor in their successful aggregation with LC molecules.
3.5 AFM images
The morphology of the samples was studied also by AFM imaging, as discussed in section 2. The images were taken at −10 °C using a Peltier cooler/heater stage. In order to see the crystal structure of the LC compounds, the samples were first heated to 70 °C for about 5 min, then 75 °C for 30 s in order to excite the LC compounds to an amorphous state, then rapidly cooled to −10 °C. Fig. 11 illustrates this behavior.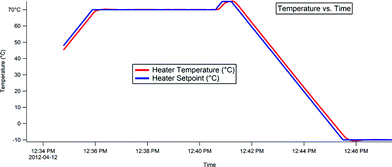 | ||
| Fig. 11 Temperature versus time dependence of the Peltier cooler/heater stage used for taking images of the CB systems. The samples were first heated to 70 °C for about 5 min, then 75 °C for 30 s in order to excite the LC compounds to an amorphous state, and then rapidly cooled to −10 °C to form solid crystals. The images were taken at −10 °C. | ||
Fig. 12–18 illustrate the two-dimensional (2D) and three-dimensional (3D) images of 5CB, 6CB, and 7CB systems at different GNP concentrations. Note that the images are taken using AC mode.
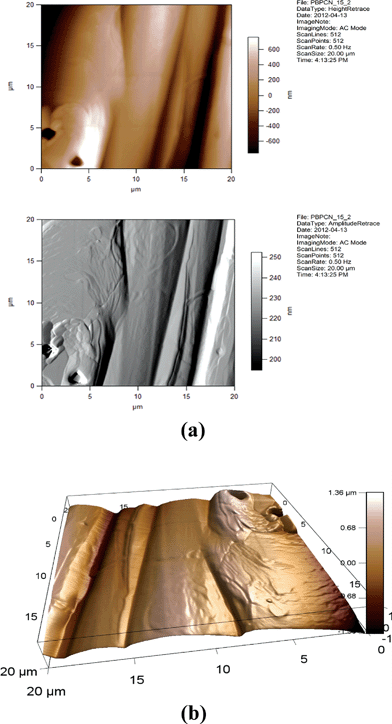 | ||
| Fig. 12 (a) 2D AFM images of 5CB/15% GNP. Height and amplitude retraces. AC imaging mode. (b) 3D AFM image of 5CB/15% GNP. Topographic channel. AC imaging mode. | ||
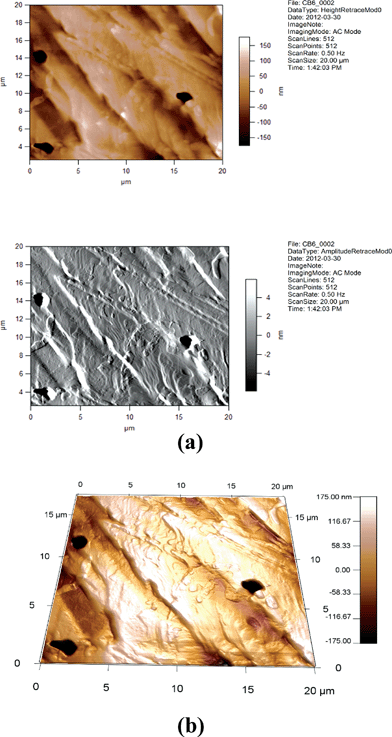 | ||
| Fig. 13 (a) 2D AFM images of 6CB. Height and amplitude retraces. AC imaging mode. (b) AFM image of 6CB. Topographic channel. AC imaging mode. | ||
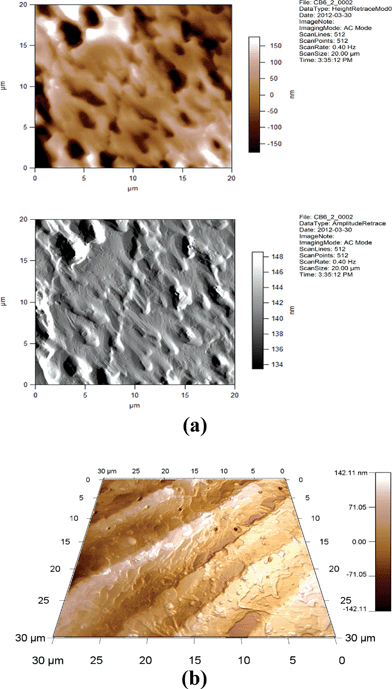 | ||
| Fig. 14 (a) 2D AFM images of 6CB/2% GNP. Height and amplitude retraces. AC imaging mode. (b) 3D AFM image of 6CB/2% GNP. Topographic channel. AC imaging mode. | ||
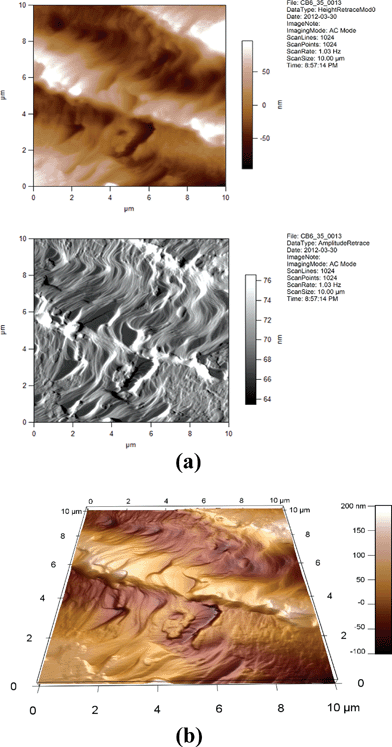 | ||
| Fig. 15 (a) 2D AFM images of 6CB/35% GNP. Height and amplitude retraces. AC imaging mode. (b) 3D AFM image of 6CB/35% GNP. Topographic channel. AC imaging mode. | ||
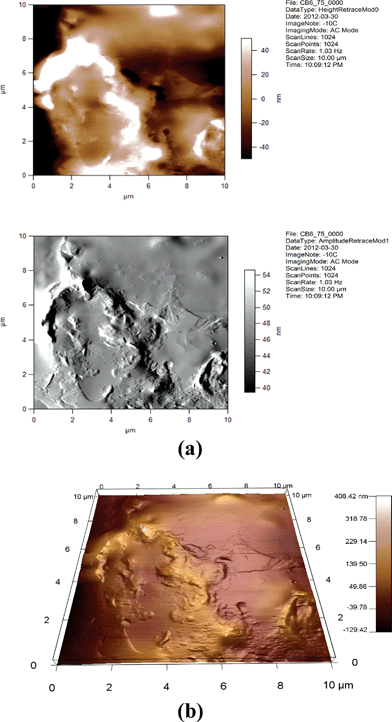 | ||
| Fig. 16 (a) 2D AFM images of 6CB/75% GNP. Height and amplitude retraces. AC imaging mode. (b) 3D AFM image of 6CB/75% GNP. Topographic channel. AC imaging mode. | ||
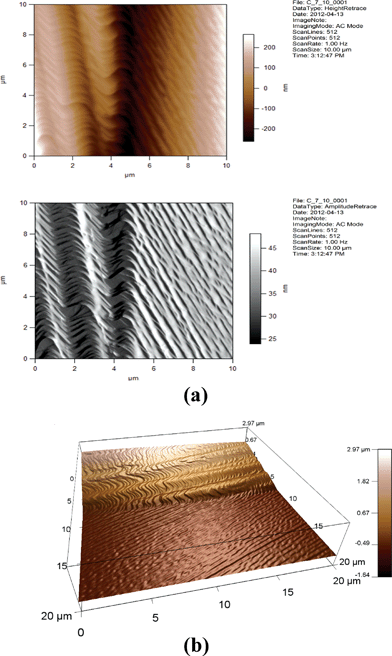 | ||
| Fig. 17 (a) 2D AFM images of 7CB/10% GNP. Height and amplitude retraces. AC imaging mode. (b) 3D AFM image of 7CB/10% GNP. Topographic channel. AC imaging mode. | ||
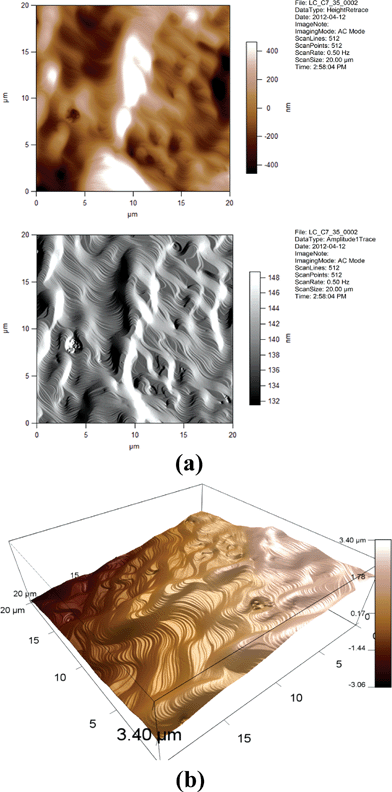 | ||
| Fig. 18 (a) 2D AFM images of 7CB/35% GNP. Height and amplitude retraces. AC imaging mode. (b) 3D AFM image of 7CB/35% GNP. Topographic channel. AC imaging mode. | ||
One can see from Fig. 14, 15, 17, and 18 that the images for, respectively, 6CB/2% GNP, 6CB/35% GNP, 7CB/10% GNP, and 7CB/35% GNP have similar features. Note that these are the systems where the above-mentioned LC/gold aggregations are formed. On the other hand, Fig. 12 and 16 illustrate that, respectively, 5CB/15% GNP and 6CB/75% GNP have common features. This confirms that in these systems, as proposed above, different types of clusters is formed, e.g. gold/gold aggregations. Moreover, we provide three movies taken by the probe installed with the AFM (see section 2) as ESI.† One of the movies demonstrates how the temperature variations affect the formed clusters in the 7CB/35% GNP system. The other two movies demonstrate the melting and crystallization of 6CB/2% GNP sample. We also provide the graphs of the time dependences of the temperature of the heater/cooler stage used for taking the movies. These movies demonstrate and confirm the formation of aggregations in the studied nanocomposites.
4. Conclusions
We show that LC CB homologues with n = 5, 6, and 7 uniformly disperse gold nanoparticles, which dramatically affect the LC material parameters and the nematic’s phase thermal range. We also show that CB homologue with n = 8 does not disperse the gold nanoparticles. We report that the gold concentration and the length of the alkyl ‘tail' of the CB molecules have crucial roles in affecting the material parameters and consequently the display parameters of the studied systems. We propose that two different types of aggregations, LC/gold and gold/gold, are formed, which affect the local ordering and consequently the material properties of CB systems.We report materials with lower threshold voltage and faster response than the same values for the pure CB nematics. These materials are good candidates for utilization in LCD and H-PDLC applications.
Acknowledgements
KKV thanks the Faculty of Arts and Sciences (Rutgers-Camden) Dean's office for providing start-up funds for accomplishing this project. KKV also thanks the Department of Physics (Rutgers-Camden) for loaning equipment and accessories for the project. KKV acknowledges his NSF (CMMI Division) MRI-0922946 grant (as a co-PI) for the acquisition and the use of Asylum atomic force microscope. The authors thank the Electron Microscopy Laboratory of the Biology Department at Rutgers-Camden for the use of the Leo 1450EP scanning electron microscope (NSF DBI-0216233). The authors also express their gratitude to Kimberlee Moran-Grant Facilitator in the Faculty of Arts and Science for correcting the grammatical errors and polishing the manuscript.References
- T. Kato, N. Mizoshita and K. Kishimoto, Angew. Chem., Int. Ed., 2005, 45, 38–68 CrossRef.
- J. W. Goodby, I. M. Saez, S. J. Cowling, V. Gortz, M. Draper, A. W. Hall, S. Sia, G. Cosquer, S.-E. Lee and E. P. Raynes, Angew. Chem., Int. Ed., 2008, 47, 2754–2787 CrossRef CAS.
- C. Tschierske, Chem. Soc. Rev., 2007, 36, 1930–1970 RSC.
- Handbook of Liquid Crystals, ed. D. Demus, J. Goodby, G. W. Gray, H.-W. Spiess and V. Vill, Wiley-VCH, Weinheim, 1998, vol. 1–3 Search PubMed.
- P. J. Collings and M. Hird, Introduction to liquid crystals. Taylor & Francis Group: London and New York, 1997 Search PubMed.
- K. Tanaka, K. Kato, S. Tsuru and S. Sakai, J. Soc. Inf. Disp., 1994, 2, 37–40 CrossRef.
- L. H. Domash, T. Chen, B. N. Gomatam, C. M. Gozewski, R. L. Sutherland, L. V. Natarajan, V. P. Tondiglia, T. J. Bunning and W. W. Adam, Proc. SPIE–Int. Soc. Opt. Eng., 1996, 2689, 188–195 CrossRef CAS.
- T. J. Bunning, L. V. Natarajan, V. P. Tondiglia and R. L. Sutherland, Mol. Cryst. Liq. Cryst., 1998, 320, 127–138 CrossRef CAS.
- T. W. Stone, M. S. Malcuit and J. A. Kleinfeld, Proc. SPIE–Int. Soc. Opt. Eng., 1996, 2844, 182–190 CrossRef.
- L. V. Natarajan, R. L. Sutherland, T. J. Bunning and V. P. Tondiglia, Proc. SPIE–Int. Soc. Opt. Eng., 1998, 3292, 44–51 CrossRef CAS.
- B. L. Epling, D. M. Brandelik, L. V. Natarajan, R. L. Sutherland, V. P. Tondiglia and T. J. Bunning, SAE Trans., 1997, 106(1), 400–403 Search PubMed.
- I. C. Khoo, S. Slussarenko, B. D. Guenther, M.-Y. Shih, P. Chen and W. V. Wood, Opt. Lett., 1998, 23, 253–255 CrossRef CAS.
- K. K. Vardanyan, J. Qi, J. N. Eakin, M. De Sarkar and G. P. Crawford, Appl. Phys. Lett., 2002, 81(25), 4736–4738 CrossRef CAS.
- K. K. Vardanyan, E. D. Palazzo and R. D. Walton, Liq. Cryst., 2011, 38(6), 709–715 CrossRef CAS.
- K. K. Vardanyan, R. D. Walton and D. M. Bubb, Liq. Cryst., 2011, 38(10), 1279–1287 CrossRef CAS.
- K. K. Vardanyan, R. D. Walton, D. M. Sita, I. S. Gurfinkiel and W. M. Saidel, Liq. Cryst., 2012, 39(5), 595–605 CrossRef CAS.
- K. K. Vardanyan, D. M. Sita, R. D. Walton, I. S. Gurfinkiel and W. M. Saidel, Liq. Cryst., 2012, 39(9), 1083–1098 CrossRef CAS.
- M. Brust, M. Walker, D. Bethell, D. J. Schiffrin and R. Whyman, J. Chem. Soc., Chem. Commun., 1994, 801–802 RSC.
- N. Kanayama, O. Tsutsumi, A. Kanazawa and T. Ikeda, Chem. Commun., 2001, 2640–2641 RSC.
- I. In, Y.-W. Un, Y. J. Kim and S. Y. Kim, Chem. Commun., 2005, 801–802 Search PubMed.
- L. Cseh and G. H. Mehl, J. Am. Chem. Soc., 2006, 128, 13376–13377 CrossRef CAS.
- M. Wojcik, W. Lewandowski, J. Matraszek, J. Mieczkowski, J. Borysiuk, D. Pociecha and E. Gorecka, Angew. Chem., Int. Ed., 2009, 48, 5167–5169 CrossRef CAS.
- H. Qi, B. Kinkead and T. Hegmann, Adv. Funct. Mater., 2008, 18, 212–221 CrossRef CAS.
- J. Prakash, A. Choudhary, A. Kumar, D. S. Mehta and A. M. Biradar, Appl. Phys. Lett., 2008, 93, 112904 CrossRef.
- T. Joshi, A. Kumar, J. Prakash and A. M. Biradar, Liq. Cryst., 2010, 37(11), 1433–1438 CrossRef CAS.
- M. Urbanski, B. Kinkead, T. Hegmann and H-S. Kitzerow, Liq. Cryst., 2010, 37(9), 1151–1156 CrossRef CAS.
- L. Song, W. K. Lee and X. Wang, Opt. Express, 2006, 14, 2197–2202 CrossRef CAS.
- S. E. San, O. Koysal, F. N. Ecevit, S. Ozder and D. Dvornikov, Synth. Met., 2004, 142, 283–286 CrossRef CAS.
- O. Koysal and S. E. San, Synth. Met., 2008, 158, 527–531 CrossRef.
- W. Lee and S. L. Yeh, Appl. Phys. Lett., 2001, 79, 4488–4490 CrossRef CAS.
- S. Ghosh and G. O. Carlisle, J. Mater. Sci.: Mater. Electron., 2005, 16, 753–759 CrossRef CAS.
- I. Dierking, G. Scalia, P. Morales and D. Leclere, Adv. Mater., 2004, 16, 865–869 CrossRef CAS.
- M. D. Lynch and D. L. Patrick, Nano Lett., 2002, 2, 1197–1201 CrossRef CAS.
- W. Lee, H. Y. Chen and S. L. Yeh, Opt. Express, 2002, 10, 482–487 CrossRef.
- Y. S. Suleiman, S. Ghosh, M. E. Abbasov and G. O. Carlisle, J. Mater. Sci.: Mater. Electron., 2008, 19, 662–668 CrossRef CAS.
- M. E. Abbasov and G. O. Carlisle, J. Nanophotonics, 2008, 2, 023510, DOI:10.1117/1.3037329.
- M. E. Abbasov, S. Ghosh, A. Quach and G. O. Carlisle, J. Mater. Sci.: Mater. Electron., 2010, 21, 854–859 CrossRef CAS.
- A. Mikulko, P. Arora, A. Glushchenko, A. Lapanik and W. Haase, Europhys. Lett., 2009, 87, 27009 CrossRef.
- S. K. Prasad, K. L. Sandhya, G. G. Nair, U. S. Hiremath, C. V. Yelamaggad and S. Sampath, Liq. Cryst., 2006, 33, 1121–1125 CrossRef CAS.
- A. S. Pandey, R. Dhar, S. Kumar and R. Dabrowski, Liq. Cryst., 2011, 38, 115–120 CrossRef CAS.
- R. Dhar, A. S. Pandey, M. B. Pandey, S. Kumar and R. Dabrowski, Appl. Phys. Express, 2008, 1, 121501 CrossRef.
- S. M. Yailoyan, A. Ts. Sarkisyan, L. S. Bezhanova, Z. V. Bagdasaryan, K. K. Vardanyan and E. B. Abramyan, J. Struct. Chem., 1999, 40(3), 412–412 CrossRef CAS.
- Liquid Crystals: Applications and Uses, ed. B. Bahadur, Vol. 1, World Scientific, Singapore, 1990 Search PubMed.
- L. M. Blino, Electro-optical and Magneto-optical Principles of Liquid Crystals, Wiley, Chichester, 1983 Search PubMed.
- L. M. Blinov and G. Chigrinov, Electro-optic effects in Liquid Crystal Materials, Springer-Verlag, New York, 1994 Search PubMed.
- S. Chandrasekhar, Liquid Crystals. 2nd edition, Cambridge University Press, Cambridge, 1992 Search PubMed.
- P. J. Collings, Liquid Crystals: Natures Delicate Phase of Matter, Princeton University Press, Princeton, 1990 Search PubMed.
- A. S. Sonin, Introduction to Physics of Liquid Crystals, Nauka, Moscow, 1983 Search PubMed.
Footnote |
| † Electronic supplementary information (ESI) available: Movie 1: Temperature variation of the formed clusters in 7CB/35%Gold system. Movie 2: Melting and crystallization of 6CB/2%Gold system. Movie 3: Melting and crystallization of 6CB/2%Gold system-Dual AC mode. Graphs of the dependence of the temperature versus the time of the heater/cooler stage used for taking the movies. See DOI: 10.1039/c2ra21220j |
| This journal is © The Royal Society of Chemistry 2013 |
