DOI:
10.1039/C2NJ40737J
(Paper)
New J. Chem., 2013,
37, 212-219
Mixed-solvothermal synthesis, structures, luminescent and surface photovoltage properties of four new transition metal diphosphonates with a 3D supramolecular structure†
Received
(in Victoria, Australia)
17th August 2012
, Accepted 2nd October 2012
First published on 3rd October 2012
Abstract
Four new transition metal(II) diphosphonates with a 3D supramolecular structure, M(hedpH2)3·3NH2(CH3)2NH(CH3)3·3H2O (M = Mn (1), Co (2), Ni (3), Zn (4); hedpH4 = 1-hydroxyethylidenediphosphonate acid) have been synthesized under mixed-solvothermal conditions and structurally characterized. Compounds 1–4 are isomorphous and adopt a three-dimensional supramolecular network structure containing {M(hedpH2)3}4− cluster units. The interconnection of {MO6} and {CPO3} polyhedra via corner-sharing forms a {M(hedpH2)3}4− cluster, and these isolated clusters are extended by hydrogen bonds to form a two-dimensional layer structure, which are further connected through hydrogen bonding interactions to give rise to a 3D supramolecular structure. Surface photovoltage spectroscopy (SPS) of compounds 1–4 indicates that it possesses positive SPV response in the range of 300–600 nm and shows p-type semiconductor characteristic. Luminescence properties of the four compounds have also been studied.
Introduction
The supramolecular chemistry based on self-assembly of molecular building blocks has been an active research field over the past years, mainly due to their potential applications in optical, ion-exchange, catalytic and sensing properties.1 As an important part of supramolecular chemistry, metal phosphonate compounds have also attracted much attention. In recent years, great efforts have been devoted to the preparation of metal phosphonates with new architectures and properties in searching for new materials with potential applications in catalysis, magnetism, ion exchange, proton conductivity, photochemistry and material chemistry.2–5
Therefore, the rational design and synthesis of novel metal phosphonates with intriguing diversity of architectures and properties have become a particularly important subject. Studies of metal phosphonates have shown that the use of bi- and multifunctional phosphonic acids containing –NH2, –OH, and –COOH sub-functional groups and providing many coordination modes may not only result in new structure types of metal phosphonates, but also bring interesting properties.6 Recently, a series of metal phosphonates, using phosphonic acids with amine, hydroxyl, and carboxylate groups as ligands, have also been isolated in our laboratory.7 In the point of view of structural construction of inorganic–organic hybrid compounds, diphosphonic acids, H2O3P–R–PO3H2 (R = alkyl or aryl group), are very useful ligands in the synthesis of metal phosphonates with new structure types, in which the organic part plays a controllable spacer role and the two inorganic –PO3 groups chelate with metal ions to form one-, two-, three-dimensional structures.8 With the aim of exploring new metal phosphonates with interesting structures and properties, we focus our attention on a flexible and multifunctional bisphosphonic acid, 1-hydroxyethylidenediphosphonic acid (hedpH4), which has been widely used as a strong chelating agent in the preparation of functional metal diphosphonates, since it can adopt various kinds of coordination modes under different reaction conditions.9 To date, many transition metal diphosphonates with interesting magnetic properties have been prepared.10 Comparatively few reports are available on the luminescent and surface photovoltage properties of transition metal diphosphonates. Surface photovoltage spectroscopy (SPS) is a useful tool for surveying the charge change of the solid surface, and it can be used to investigate the photophysics of the excited states and the surface charge behavior of the sample.11 To our knowledge, reports on this aspect are mainly involved in the coordination complexes with phthalocyanines, porphyrins or carboxylic acid as ligands.12 Recently, only one investigation on the surface photovoltage property of metal phosphonate has been reported by our group.13 As an extension to our previous work, four new transition metal diphosphonates with a 3D supramolecular structure, M(hedpH2)3·3NH2(CH3)2·NH(CH3)3·3H2O (M = Mn (1), Co (2), Ni (3), Zn (4)) have been synthesized by the mixed-solvothermal reaction of divalent transition metals and 1-hydroxyethylidenediphosphonate acid in N,N-dimethylformamide (DMF) and water. Herein we report their syntheses, crystal structures, luminescent and surface photovoltage properties.
Results and discussion
Synthesis
Under mixed-solvothermal conditions, four new transition metal(II) diphosphonates with a 3D supramolecular structure have been successfully prepared. Product composition depends on a number of critical conditions, including the molar ratio of starting materials, pH of the medium, temperature and hence pressure, the presence of structure-directing cations, and the use of mineralizers. With the aim to obtain pure phase materials we try to adjust the synthetic conditions of compounds 1–4. It has been found that the molar ratio of M2+/hedpH4 has a strong effect on the formation of these compounds. The pure phases of compounds 1–4 can be obtained with good yields when the molar ratio of M2+ and hedpH4 is 1![[thin space (1/6-em)]](https://www.rsc.org/images/entities/char_2009.gif) :
:![[thin space (1/6-em)]](https://www.rsc.org/images/entities/char_2009.gif) 5. The temperature was very important for the formation of suitable single-crystals for X-ray diffraction. The best crystals of compounds 1–4 were obtained at the used reaction temperature of 80 °C. We also tried to prepare compounds 1–4 under the same reaction environments at different temperatures, but impure crystals or powders were obtained. Our results show that N,N-dimethylformamide (DMF) plays a dual role in the formation of the title compounds. Under the mixed-solvothermal conditions at 80 °C, N,N-dimethylformamide (DMF) not only serves as a solvent but also can be decomposed to produce dimethylamine and trimethylamine, which act as structure-directing agents and charge-compensating cations. The powder XRD patterns and the simulated XRD patterns of the title compounds are shown in Fig. S1 (ESI†). The diffraction peaks on the patterns correspond well in position, confirming that the four compounds are all pure phase. The differences in reflection intensities are probably due to preferred orientation in the powder samples.
5. The temperature was very important for the formation of suitable single-crystals for X-ray diffraction. The best crystals of compounds 1–4 were obtained at the used reaction temperature of 80 °C. We also tried to prepare compounds 1–4 under the same reaction environments at different temperatures, but impure crystals or powders were obtained. Our results show that N,N-dimethylformamide (DMF) plays a dual role in the formation of the title compounds. Under the mixed-solvothermal conditions at 80 °C, N,N-dimethylformamide (DMF) not only serves as a solvent but also can be decomposed to produce dimethylamine and trimethylamine, which act as structure-directing agents and charge-compensating cations. The powder XRD patterns and the simulated XRD patterns of the title compounds are shown in Fig. S1 (ESI†). The diffraction peaks on the patterns correspond well in position, confirming that the four compounds are all pure phase. The differences in reflection intensities are probably due to preferred orientation in the powder samples.
Description of the crystal structures
Compounds 1–4 are isomorphous, hence only the structure of compound 4 will be discussed in detail as a representation. The ORTEP diagram for compound 4 is shown in Fig. 1. Crystallographic data and structural refinements for compounds 1–4 are summarized in Table 1.
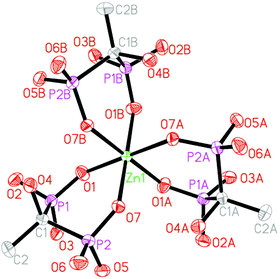 |
| | Fig. 1 Structural unit of compound 4 showing the atom labeling. Thermal ellipsoids are shown at the 30% probability level. All H atoms, Hdma+ cations, Htma+ cations and solvate water molecules are omitted for clarity. Symmetry code for the generated atoms: (A) −y + 1, x − y + 1, z; (B) −x + y, −x + 1, z. | |
Table 1 Crystal data and structural refinements for compounds 1–4
| |
1
|
2
|
3
|
4
|
|
Including solvent molecules.
R
1 = Σ(|F0| − |FC|)/Σ|F0|, wR2= [Σw(|F0| − |FC|)2/ΣwF02]1/2.
|
| Formulaa |
C5H19.33N1.33O8P2Mn0.33 |
C5H19.33N1.33O8P2Co0.33 |
C5H19.33N1.33O8P2Ni0.33 |
C5H19.33N1.33O8P2Zn0.33 |
| Formula weight |
306.47 |
307.80 |
307.73 |
309.95 |
| Crystal system |
Rhombohedral |
Rhombohedral |
Rhombohedral |
Rhombohedral |
| Space group |
R![[3 with combining macron]](https://www.rsc.org/images/entities/char_0033_0304.gif) c c |
R![[3 with combining macron]](https://www.rsc.org/images/entities/char_0033_0304.gif) c c |
R![[3 with combining macron]](https://www.rsc.org/images/entities/char_0033_0304.gif) c c |
R![[3 with combining macron]](https://www.rsc.org/images/entities/char_0033_0304.gif) c c |
|
a/Å |
16.6808(8) |
16.6483(6) |
16.6093(7) |
16.6344(15) |
|
b/Å |
16.6808(8) |
16.6483(6) |
16.6093(7) |
16.6344(15) |
|
c/Å |
52.257(5) |
51.521(3) |
51.213(4) |
51.382(7) |
|
γ/° |
120 |
120 |
120 |
120 |
|
V/Å3 |
12592.5(15) |
12366.7(10) |
12235.4(12) |
12313(2) |
|
Z
|
36 |
36 |
36 |
36 |
|
D
c/g cm−3 |
1.455 |
1.488 |
1.503 |
1.505 |
| Goodness-of-fit on F2 |
1.000 |
1.097 |
1.048 |
1.061 |
|
R
1 [I > 2σ(I)]b |
0.0549 |
0.0497 |
0.0499 |
0.0531 |
|
wR
2 [I > 2σ(I)]b |
0.1507 |
0.1578 |
0.1496 |
0.1458 |
|
R
1 (all data)b |
0.0798 |
0.0636 |
0.0654 |
0.0769 |
|
wR
2 (all data)b |
0.1747 |
0.1724 |
0.1666 |
0.1617 |
| Largest diff. peak and hole/e Å−3 |
0.949/−0.467 |
1.632/−0.541 |
1.739/−0.682 |
1.412/−0.580 |
The asymmetric unit of compound 4 contains 1/3 of a crystallographically independent Zn(II) atom, one protonated hedpH22− anion, one Hdma+ (dma = dimethylamine) cation, 1/3 of a Htma+ (tma = trimethylamine) cation and one solvate water molecule. The central Zn(II) atom lies on a crystallographic 3-fold axis, as does the N–H bond in the NH(CH3)3 cation. As shown in Fig. 1, the Zn(II) center is six-coordinated by six phosphonate oxygen atoms (O1, O7, O1A, O7A, O1B and O7B) from three hedpH22− anions. The Zn–O distances are in the range of 2.057(4) to 2.137(4) Å (Table S1, ESI†). These values are in agreement with those reported for other zinc(II) phosphonate compounds.15 In compound 4, each hedpH22− group is a bis-chelating ligand and links one Zn atom using two of its six diphosphonate oxygens. Two of the remaining four oxygen atoms (O4, O5) are protonated. In addition, there exist two kinds of hydrogen bonds in compound 4. As shown in Fig. 2, there are intramolecular hydrogen bonds among the phosphonate oxygens with the distances of 2.4995 Å (O(2)–H(2A)⋯O(3)#3), 2.5565 Å (O(5)–H(5D)⋯O(6)#4) and the corresponding angles of 166.0° and 169.1° (symmetry transformations used to generate equivalent atoms: #3 −x + 1, −y + 1, −z; #4 −x + 4/3, −x + y + 2/3, −z + 1/6). The corresponding distances and angles are listed in Table 2. These strong hydrogen bonds enhance the stability of the network, and affect the crystal packing of the molecules.
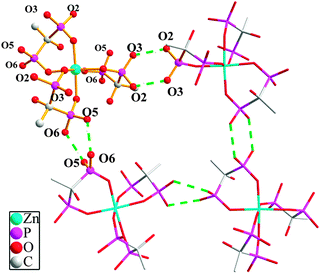 |
| | Fig. 2 The connectivity of hydrogen bonds for compound 4. All hydrogen atoms except for the hydrogen bonds are omitted for clarity. | |
Table 2 Hydrogen bonds for compound 4a
| D–H⋯A |
d(D–H)/Å |
d(H⋯A)/Å |
D–H–A/° |
d(D⋯A)/Å |
|
Symmetry transformations used to generate equivalent atoms: #3 −x + 1, −y + 1, −z; #4 −x + 4/3, −x + y + 2/3, −z + 1/6.
|
| O(2)–H(2A)⋯O(3)#3 |
0.82 |
1.70 |
166.0 |
2.499(5) |
| O(5)–H(5D)⋯O(6)#4 |
0.82 |
1.75 |
169.1 |
2.556(5) |
The overall structure of compound 4 can be described as a 3D supramolecular structure type. Within the structure of compound 4, the Zn(II) ion is interconnected by three hedpH22− groups to form a {Zn(hedpH2)3}4− cluster unit (Fig. 3a). As shown in Fig. 3b, among the {Zn(hedpH2)3}4− clusters, there exist strong hydrogen bonds O(2)–H(2A)⋯O(3) and O(5)–H(5D)⋯O(6), thus forming a 2D supramolecular network. In order to facilitate viewing, the {Zn(hedpH2)3}4− cluster units can be regarded as 4-connected nodes and hydrogen bonds act as 2-connected sticks, the structure can be described as displayed in Fig. 3c. Furthermore, such layers are assembled into a three-dimensional supramolecular network via interlayer O(2)–H(2A)⋯O(3) and O(5)–H(5D)⋯O(6) hydrogen bonds (Fig. 4b), and there is a one-dimensional channel system along the a axis (Fig. 4a). For perspicuous representation, the {Zn(hedpH2)3}4− units can be regarded as 6-connected nodes and hydrogen bonds act as sticks. Therefore, the whole structure can be represented as a pcu topology16 (Fig. 4c).
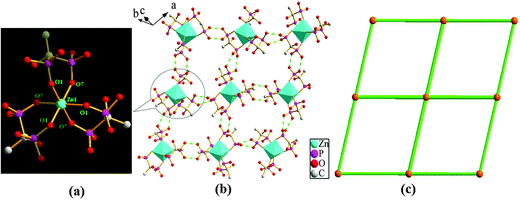 |
| | Fig. 3 (a) View of the {Zn(hedpH2)3}4− cluster unit. (b) View of 2D crystalline framework and O–H⋯O hydrogen bonds (green dotted lines) in 4. (c) Illustration of the (4, 4) 2D network structure (polyhedral representation of the structure of ZnO6). | |
 |
| | Fig. 4 (a) The channel of compound 4 along the a axis. (b) Side view of the three-dimensional supramolecular network connected by hydrogen bonds. All H atoms, Hdma+ cations, Htma+ cations and solvate water molecules are omitted for clarity (green dotted lines). (c) Topological structure of compound 4. | |
IR spectra
The IR spectra of compounds 1–4 were recorded between 4000 and 400 cm−1 (Fig. S2, ESI†). The IR spectra of the four compounds have many similar features corresponding to the common groups, hence only the spectrum of compound 4 will be discussed. The absorption band centered at 3433 cm−1 is due to the O–H stretching vibration of water molecules and hydroxyl groups. The two bands observed at 3220 cm−1 and 2799 cm−1 are attributed to the N–H and C–H stretching vibrations. The weak band at 1639 cm−1 corresponds to the δ(H–OH) vibration. The weak absorption band at 1473 cm−1 is due to the bending vibration of C–H. The set of bands between 1200 and 900 cm−1 are assigned to stretching vibrations of the tetrahedral CPO3 groups, as expected.17 Additional medium and weak bands at low energy (813, 654, 539, and 481 cm−1) are found, these bands are probably due to bending vibrations of the tetrahedral CPO3 groups.
Thermal analysis
Thermogravimetric analysis diagram of compounds 1–4 has been performed in the 50–900 °C temperature range in a static air atmosphere (Fig. S3, ESI†). The TGA curves of compounds 1–4 are nearly similar, and we use compound 4 as an example to illuminate the weight losses in detail. The thermogravimetric analysis diagram of compound 4 indicates two main steps. The first step started at about 50 °C and was completed at 106 °C, corresponding to the loss of three solvate water molecules. The observed weight loss of 6.1% is very close to the calculated value (5.8%). Above the temperature of 158 °C, a continuous weight loss was observed up to 800 °C, corresponding to the release of dimethylamine and trimethylamine molecules, and the decomposition of the phosphonate groups. The total weight loss at 800 °C is 68.6%. The final residuals of compounds 1–4 were not characterized because of the corrosive reactions of the final residuals with the TGA baskets made of Al2O3.
Luminescent properties
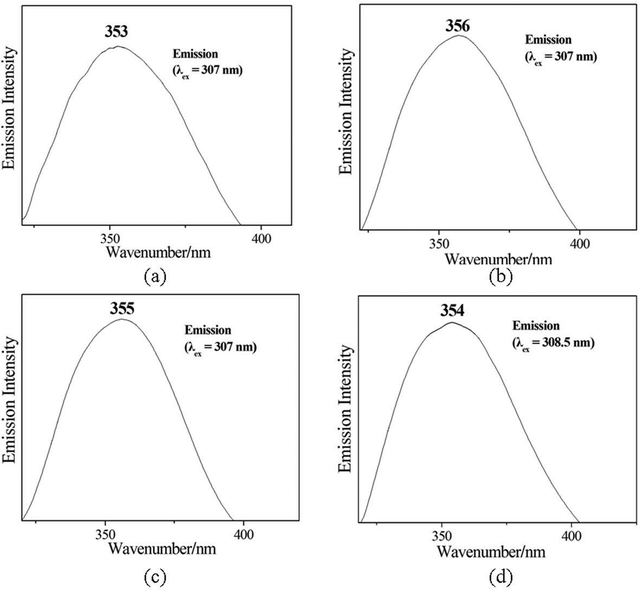
The luminescent properties of compounds 1–4 (as well as hedpH4 solution) were investigated in the solid state at room temperature (Fig. 5). The free phosphonate ligand displays a fluorescent emission band at λmax = 359 nm upon excitation at 320 nm (Fig. S4, ESI†), the luminescence emission of the phosphonic acid can be attributable to intraligand transitions of hedpH4, such as π → π* transition. The emission spectra of compounds 1–4 are very similar to that of discrete hedpH4, and it demonstrates that the emission spectra of compounds 1–4 are neither metal-to-ligand charge transfer (MLCT) nor ligand-to-metal charge transfer (LMCT) in nature but rather are attributed to an intraligand emission state.18 The difference in the relative intensities of the peaks in the emission spectra of hedpH4 and compounds 1–4 is probably due to the coordination to different metal ions, because the luminescence behavior is closely associated with the metal ions. The luminescence spectra of compounds 1–4 indicate that they may be candidates for potential luminescent materials
Surface photovoltage properties
Surface photovoltage spectroscopy (SPS) is an effective technique that can be used to investigate the photophysics of the excited states and the surface charge behavior of the sample. It not only relates to the electron transitions under light-inducement, but also reflects the separation and transfer of photo-generated charges as well as optical absorption characteristics of semiconductor samples.19 Surface photovoltage spectroscopy (SPS) of compounds 1–4 was measured with a solid junction photovoltaic cell (ITO/sample/ITO) in the range of 300–600 nm. The detected signal by SPS is equivalent to the change in the surface potential barrier on illumination (δVs), which is given by the equation:  , where
  and Vos are the surface potential barriers before and after illumination, respectively. As far as band to band transitions are concerned, a positive response of SPV (δVs > 0) means that the sample is characterized as a p-type semiconductor, whereas a negative response is an n-type semiconductor.
The magnitude of the surface potential barrier depends on the numbers of surface net charge. Fig. 6 shows the SPS spectra of complexes 1–4. They all appear as positive SPV response bands between 300 and 600 nm. It can be seen that the signal detected by SPS at 300–400 nm is a wide peak. The signal is actually the result of overlap of several SPV response bands. To make the assignment of each SPV response band clear, we separated them by the Origin 6.0 program. Then compounds 1–4 all present two positive SPV responses in the range of 300–600 nm, which indicates that they all possess p-type semiconductor characteristics. The responses at λmax=325 nm (1), 322 nm (2), 324 nm (3), and 330 nm (4) are attributed to the π → π* transition of ligands. The response at λmax=350 nm (1), 350 nm (2), 341 nm (3), and 364 nm (4) can be assigned to the LMCT transition (from ligand to metal charge transfer transition). The surface photovoltage spectra indicate that not only semiconductor possesses photovoltage characteristic, some materials with the semiconductor characteristic (such as coordination polymers) also can exhibit the photovoltage property. Therefore, metal phosphonates can be regarded as a kind of extended novel semiconductors.
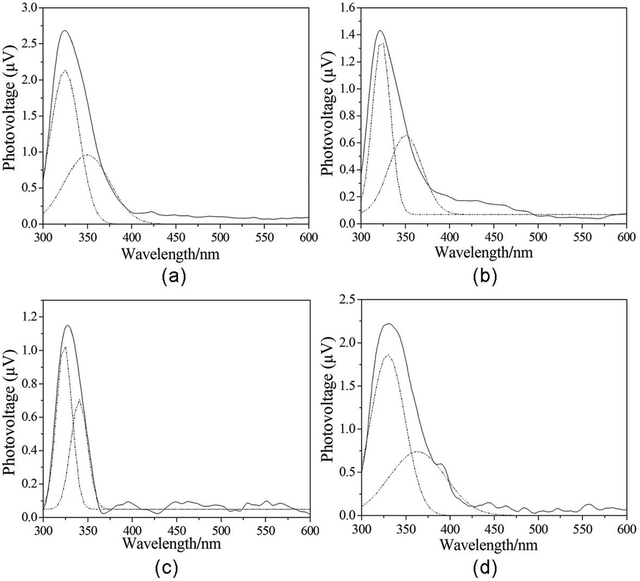 |
| | Fig. 6 The SPS of compounds 1–4. Dotted lines are treated peak. | |
Field-induced surface photovoltage spectroscopy (FISPS) can be measured by applying an external electric field to the sample with a transparent electrode. For a p-type semiconductor, when a positive electric field is applied on the semiconductor surface, the SPV response increases since the external field is consistent with the built-in field. In contrast, when a negative electric field is applied, the SPV response is weakened. In contrast to p-type semiconductors, the SPV response intensity of n-type semiconductors increases as a negative field is applied and reduces as a positive electric field is applied. Fig. 7 shows the FISPS of compounds 1–4 in the range of 300–600 nm when the external electric fields are −0.2, 0, and +0.2 V, respectively. The SPV response intensities of the four compounds increase when the positive fields increase, while they reduce when the external negative fields increase. This is attributed to the positive electric field being beneficial to the separation of photoexcited electron–hole pairs, which in turn results in an increase of response intensity; however, the negative electric field has just the opposite effect. The FISPS confirms the p-type characteristics of compounds 1–4.
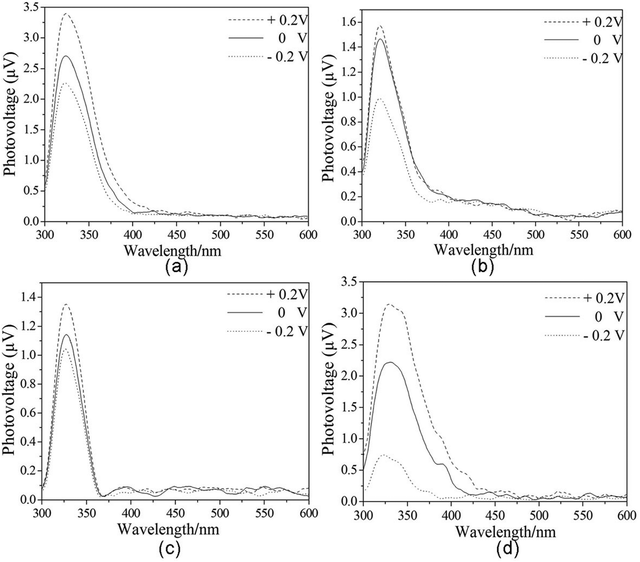 |
| | Fig. 7 The FISPS of compounds 1–4. Dotted lines are treated peak. | |
Conclusions
In conclusion, four new transition metal(II) diphosphonates with a 3D supramolecular structure, M(hedpH2)3·3NH2(CH3)2·NH(CH3)3·3H2O (M = Mn (1), Co (2), Ni (3), Zn (4); hedpH4 = 1-hydroxyethylidenediphosphonate acid) have been synthesized under mixed-solvothermal conditions and structurally characterized. Compounds 1–4 are isomorphous and adopt a three-dimensional supramolecular network structure. The interconnection of {MO6} polyhedra and {CPO3} tetrahedra via corner-sharing forms a {M(hedpH2)3}4− cluster, and these isolated clusters are extended by hydrogen bonds to form a two-dimensional layer structure, which are further connected through hydrogen bonding interactions to give rise to a 3D supramolecular structure. The luminescence analysis indicates that compounds 1–4 may be candidates for potential luminescent materials. The SPS and FISPS of the four compounds reveal that they possess positive SPV responses in the range of 300–600 nm and show p-type semiconductor characteristic. The detection of surface charge behavior and photoelectric property of metal phosphonates have the important references and elicitation for exploiting photoelectric property of transition metal compounds. Therefore, it is important and interesting to study the surface photovoltage properties of metal phosphonates.
Experimental
Materials and measurements
The 1-hydroxyethylidenediphosphonate acid (hedpH4) was obtained from Taihe Chemical Factory (50.0 wt%) and used as received. All other chemicals were used as obtained without further purification. C, H, and N contents were determined by using a PE-2400 elemental analyzer. Mn, Co, Ni, Zn and P contents were determined by using an inductively coupled plasma (ICP) atomic absorption spectrometer. IR spectra were recorded on a Bruker AXS TENSOR-27 FT-IR spectrometer with KBr pellets in the range of 4000–400 cm−1. The X-ray powder diffraction data were collected on a Bruker AXS D8 Advance diffractometer using Cu-Kα radiation (λ = 1.5418 Å) in the 2θ range of 5°–60° with a step size of 0.02° and a scanning rate of 3° per min. TG analyses were performed on a Perkin-Elmer Pyris Diamond TG–DTA thermal analyses system in static air with a heating rate of 10 K min−1 from 50 °C to 900 °C. The luminescence spectra were recorded on a HITACHI F-7000 spectrofluorimeter (solid). Surface photovoltage spectroscopy (SPS) and field-induced surface photovoltage spectroscopy (FISPS) measurements were conducted with the sample in a sandwich cell (ITO/sample/ITO) with the light source-monochromator-lock-in detection technique.
Synthesis
[Mn(hedpH2)3]·3NH2(CH3)2·NH(CH3)3·3H2O (1).
A mixture of Mn(Ac)2·4H2O (0.12 g, 0.5 mmol) and hedpH4 solution (1 mL, 2.5 mmol) was dissolved in DMF (4 mL). The resulting solution was stirred for about 1 h at room temperature, sealed in a 20 mL Teflon-lined stainless steel autoclave, and then heated at 80 °C for 72 h under autogenous pressure. After the mixture was cooled slowly to room temperature, the colorless block crystals were obtained. Yield: 56.41% (based on Mn). C5H19.33N1.33O8P2Mn0.33 (306.47): calc. C 19.61, H 6.36, N 6.08, P 20.23, Mn 5.92; found: C 19.56, H 6.39, N 6.05, P 20.26, Mn 5.98%. IR (KBr) data: 3434(s), 3219(s), 2789(w), 1621(w), 1464(w), 1399(w), 1142(s), 1076(s), 911(m), 819(w), 645(w), 539(m), 481(w) cm−1.
[Co(hedpH2)3]·3NH2(CH3)2·NH(CH3)3·3H2O (2).
The procedure was the same as that for 1 except that Mn(Ac)2·4H2O was replaced by Co(Ac)2·4H2O (0.12 g, 0.5 mmol). The pink block crystals of 2 were obtained. Yield: 50.2% (based on Co). C5H19.33N1.33O8P2Co0.33 (307.80): calc. C 19.53, H 6.33, N 6.06, P 20.14, Co 6.32; found: C 19.47, H 6.37, N 6.03, P 20.18, Co 6.37%. IR (KBr) data: 3416(s), 3178(s), 2789(w), 1621(w), 1464(w), 1399(w), 1142(s), 1067(s), 911(m), 811(w), 645(w), 539(m), 481(w) cm−1.
[Ni(hedpH2)3]·3NH2(CH3)2·NH(CH3)3·3H2O (3).
The procedure was the same as that for 1 except that Mn(Ac)2·4H2O was replaced by Ni(Ac)2·4H2O (0.12 g, 0.5 mmol). The green block crystals of 3 were obtained. Yield: 59.7% (based on Ni). C5H19.33N1.33O8P2Ni0.33 (307.73): calc. C 19.53, H 6.34, N 6.06, P 20.15, Ni 6.30; found: C 19.48, H 6.38, N 6.02, P 20.19, Ni 6.25%. IR (KBr) data: 3434(s), 3194(s), 2789(w), 1621(w), 1473(w), 1406(w), 1142(s), 1067(s), 911(m), 812(w), 653(w), 542(m), 482(w) cm−1.
[Zn(hedpH2)3]·3NH2(CH3)2·NH(CH3)3·3H2O (4).
The procedure was the same as that for 1 except that Mn(Ac)2·4H2O was replaced by Zn(Ac)2·2H2O (0.11 g, 0.5 mmol). The colorless block crystals of 4 were obtained. Yield: 53.5% (based on Zn). C5H19.33N1.33O8P2Zn0.33 (309.95): C 19.39, H 6.29, N 6.02, P 20.00, Zn 6.97; found: C 19.45, H 6.25, N 6.06, P 20.06, Zn 6.92%. IR (KBr) data: 3433(s), 3220(s), 2799(w), 1639(w), 1473(w), 1399(w), 1142(s), 1084(s), 911(m), 813(w), 654(w), 539(m), 481(w) cm−1.
X-Ray crystallography
Data collections for compounds 1–4 were performed on the Bruker AXS Smart APEX II CCD X-diffractometer equipped with graphite monochromated MoKα radiation (λ = 0.71073 Å) at 293 ± 2 K. An empirical absorption correction was applied using the SADABS program. All structures were solved by direct methods and refined by full-matrix least squares fitting on F2 by SHELXS-97.14 All non-hydrogen atoms were refined anisotropically. Hydrogen atoms except those for water molecules were generated geometrically with fixed isotropic thermal parameters, and included in the structure factor calculations. Hydrogen atoms for water molecules were not included in the refinement.
Acknowledgements
This work is supported by the National Natural Science Foundation of China (Grant No. 21071072) and the Program for Liaoning Excellent Talents in University (Grant No. LR2011030).
References
-
(a) C. V. K. Sharma and A. Clearfield, J. Am. Chem. Soc., 2002, 122, 4394 Search PubMed;
(b) A. Cabeza, X. Ouyang, C. V. K. Sharma, M. A. G. Aranda, S. Bruque and A. Clearfield, Inorg. Chem., 2002, 41, 2325 CrossRef CAS;
(c) D. Kong, J. L. McBee and A. Clearfield, Cryst. Growth Des., 2005, 5, 643 CrossRef CAS.
-
(a) H. Hirao and K. Morokuma, J. Am. Chem. Soc., 2009, 132, 17901 Search PubMed;
(b) W. Y. Tsang, D. R. Edwards, S. A. Melnychuk, C. T. Liu, C. M. Liu, A. A. Neverov, N. H. Williams and R. S. Brown, J. Am. Chem. Soc., 2009, 131, 4159 CrossRef CAS;
(c) T. Y. Ma, X. Z. Lin and Z. Y. Yuan, J. Mater. Chem., 2010, 20, 7406 RSC.
-
(a) W. Ouellette, J. R. Galán–Mascarós, K. R. Dunbar and J. Zubieta, Inorg. Chem., 2006, 45, 1909 CrossRef CAS;
(b) S. Khanra, M. Kloth, H. Mansaray, C. A. Muryn, F. Tuna, E. C. Sañudo, M. Helliwell, E. J. L. McInnes and R. E. P. Winpenny, Angew. Chem., Int. Ed., 2007, 46, 5568 CrossRef CAS;
(c) S. Konar and A. Clearfield, Inorg. Chem., 2008, 47, 3489 CrossRef CAS;
(d) R. Fu, S. M. Hu and X. T. Wu, CrystEngComm, 2011, 13, 2331 RSC;
(e) C. I. Yang, Y. T. Song, Y. J. Yeh, Y. H. Liu, T. W. Tseng and K. L. Lu, CrystEngComm, 2011, 13, 2678 RSC.
-
(a) M. Plabst, L. B. McCusker and T. Bein, J. Am. Chem. Soc., 2009, 131, 18112 CrossRef CAS;
(b) E. Barouda, K. D. Demadis, S. R. Freeman, F. Jones and M. I. Ogden, Cryst. Growth Des., 2007, 7, 301 Search PubMed.
-
(a) P. DeBurgomaster, W. Ouellette, H. Liu, C. J. O'Connor and J. Zubieta, CrystEngComm, 2010, 12, 446 RSC;
(b) R. M. P. Colodrero, P. Olivera-Pastor, A. Cabeza, M. Papadaki, K. D. Demadis and M. A. G. Aranda, Inorg. Chem., 2010, 49, 761 CrossRef CAS;
(c) K. D. Demadis, P. Lykoudis, R. G. Raptis and G. Mezei, Cryst. Growth Des., 2006, 6, 1064 CrossRef CAS;
(d)
G. B. Fix, Metal Phosphonate Chemistry: From Synthesis to Applications, Chapter 16: Luminescent Metal Phosphonate Materials, ed. A. Clearfield, K. Demadis, Published by The Royal Society of Chemistry, 2012, 525 Search PubMed.
-
(a) Z. Y. Du, Y. H. Sun, Q. Y. Liu, Y. R. Xie and H. R. Wen, Inorg. Chem., 2009, 48, 7015 CrossRef CAS;
(b) Z. C. Zhang, S. Gao and L. M. Zheng, Dalton Trans., 2007, 4681 RSC;
(c) P. O. Adelani and T. E. Albrecht-Schmitt, Inorg. Chem., 2010, 49, 5701 CrossRef CAS;
(d) P. DeBurgomaster, A. Aldous, H. X. Liu, C. J. O'Connor and J. Zubieta, Cryst. Growth Des., 2010, 10, 2209 CrossRef CAS.
-
(a) D. P. Dong, L. Liu, Z. G. Sun, C. Q. Jiao, Z. M. Liu, C. Li, Y. Y. Zhu, K. Chen and C. L. Wang, Cryst. Growth Des., 2011, 11, 5346 Search PubMed;
(b) K. Chen, Z. G. Sun, Y. Y. Zhu, Z. M. Liu, F. Tong, D. P. Dong, J. Li, C. Q. Jiao, C. Li and C. L. Wang, Cryst. Growth Des., 2011, 11, 4623 CrossRef CAS;
(c) F. Tong, Z. G. Sun, K. Chen, Y. Y. Zhu, W. N. Wang, C. Q. Jiao, C. L. Wang and C. Li, Dalton Trans., 2011, 40, 5059 RSC;
(d) F. Tong, Y. Y. Zhu, Z. G. Sun, W. N. Wang, Y. Zhao, X. Lu and J. Gong, Inorg. Chim. Acta, 2011, 368, 200 CrossRef CAS;
(e) Y. Y. Zhu, Z. G. Sun, Y. Zhao, J. Zhang, X. Lu, N. Zhang, L. Liu and F. Tong, New J. Chem., 2009, 33, 119 RSC.
-
(a) P. O. Adelani, A. G. Oliver and T. E. Albrecht-Schmitt, Cryst. Growth Des., 2011, 11, 1966 Search PubMed;
(b) N. G. Armatas, D. G. Allis, A. Prosvirin, G. Carnutu, C. J. O′Connor, K. Dunbar and J. Zubieta, Inorg. Chem., 2008, 47, 832 CrossRef CAS;
(c) K. Barthelet, M. Nogues, D. Riou and G. Férey, Chem. Mater., 2002, 14, 4910 CrossRef CAS;
(d) H. Tan, W. Chen, D. Liu, Y. Li and E. Wang, Dalton Trans., 2010, 39, 1245 RSC.
-
(a) J. Rocha, F. A. A. Paz, F. N. Shi, R. A. S. Ferreira, T. Trindade and L. D. Carlos, Eur. J. Inorg. Chem., 2009, 4931 CrossRef CAS;
(b) J. Rocha, F. N. Shi, F. A. A. Paz, L. Mafra, M. Sardo, L. Cunha-Silva, J. Chisholm, P. Ribeiro-Claro and T. Trindade, Chem.–Eur. J., 2010, 16, 7741 Search PubMed;
(c) D. K. Cao, M. J. Liu, J. Huang, S. S. Bao and L. M. Zheng, Inorg. Chem., 2011, 50, 2278 CrossRef CAS.
-
(a) F. A. Mautner, M. S. E. Fallah, S. Speed and R. Vicente, Dalton Trans., 2011, 40, 4070 Search PubMed;
(b) C. I. Yang, Y. T. Song, Y. J. Yeh, Y. H. Liu, T. W. Tseng and K. L. Lu, CrystEngComm, 2011, 13, 2678 RSC.
-
(a) T. F. Xie, D. J. Wang, L. J. Zhu, C. Wang and T. J. Li, J. Phys. Chem. B, 2000, 104, 8177 CrossRef CAS;
(b) A. Kokler, J. Gruner, R. H. Friend, K. Mullen and V. Scherf, Chem. Phys. Lett., 1995, 243, 456 CrossRef.
-
(a) D. J. Wang, J. Zhang, T. S. Shi, B. H. Wang, X. Z. Cao and T. J. Li, J. Photochem. Photobiol., A, 1996, 93, 21 CrossRef CAS;
(b) U. Weiler, T. Mayer, W. Jaegermann, C. Kelting, D. Schlettwein, S. Makarov and D. Wöhrle, J. Phys. Chem. B, 2004, 108, 19398 CrossRef CAS;
(c) T. Uekermann, D. Schlettwein and N. I. Jaeger, J. Phys. Chem. B, 2001, 105, 9524 CrossRef CAS;
(d) L. Zhang, S. Y. Niu, J. Jin, L. P. Sun, G. D. Yang and L. Ye, Inorg. Chim. Acta, 2009, 362, 1448 CrossRef CAS.
- D. P. Dong, Z. G. Sun, F. Tong, Y. Y. Zhu, K. Chen, C. Q. Jiao, C. L. Wang, C. Li and W. N. Wang, CrystEngComm, 2011, 13, 3317 RSC.
-
G. M. Sheldrick, SHELXTL-97, Program for X-ray Crystal Structure Solution and Refinement, University of Göttingen, Germany, 1997 Search PubMed.
-
(a) H. H. Song, L. M. Zheng, Z. M. Wang, C. H. Yan and X. Q. Xin, Inorg. Chem., 2001, 19, 5024 Search PubMed;
(b) Y. Gong, W. Tang, W. B. Hou, Z. Y. Zha and C. W. Hu, Inorg. Chem., 2006, 45, 4987 CrossRef CAS.
-
(a) O. D. Friedrichs, M. O'Keeffe and O. M. Yaghi, Acta Crystallogr., Sect. A: Found. Crystallogr., 2003, 59, 22 CrossRef;
(b) C. Bonneau, O. D. Friedrichs, M. O'Keeffe and O. M. Yaghi, Acta Crystallogr., Sect. A: Found. Crystallogr., 2004, 60, 517 CrossRef.
-
(a) A. Cabeza, X. Ouyang, C. V. K. Sharma, M. A. G. Aranda, S. Bruque and A. Clearfield, Inorg. Chem., 2002, 41, 2325 CrossRef CAS;
(b) Z. M. Sun, J. G. Mao, B. P. Yang and S. M. Ying, Solid State Sci., 2004, 6, 295 CrossRef CAS.
-
(a) Y. Gong, W. Tang, W. B. Hou, Z. Y. Zha and C. W. Hu, Inorg. Chem., 2006, 45, 4987 CrossRef CAS;
(b) M. S. Wang, G. C. Guo, M. L. Fu, L. Xu, L. Z. Cai and J. S. Huang, Dalton Trans., 2005, 2899 RSC;
(c) W. Chen, J. Y. Wang, C. Chen, Q. Yue, H. M. Yuan, J. S. Chen and S. N. Wang, Inorg. Chem., 2003, 42, 944 CrossRef CAS.
-
(a) Y. H. Lin, D. J. Wang, Q. D. Zhao, M. Yang and Q. L. Zhang, J. Phys. Chem. B, 2004, 108, 3202 CrossRef CAS;
(b) B. F. Xin, L. Q. Jing, Z. Y. Ren, B. Q. Wang and H. G. Fu, J. Phys. Chem. B, 2005, 109, 2805 CrossRef CAS.
|
| This journal is © The Royal Society of Chemistry and the Centre National de la Recherche Scientifique 2013 |
Click here to see how this site uses Cookies. View our privacy policy here. ![[thin space (1/6-em)]](https://www.rsc.org/images/entities/char_2009.gif) :
:![[thin space (1/6-em)]](https://www.rsc.org/images/entities/char_2009.gif) 5. The temperature was very important for the formation of suitable single-crystals for X-ray diffraction. The best crystals of compounds 1–4 were obtained at the used reaction temperature of 80 °C. We also tried to prepare compounds 1–4 under the same reaction environments at different temperatures, but impure crystals or powders were obtained. Our results show that N,N-dimethylformamide (DMF) plays a dual role in the formation of the title compounds. Under the mixed-solvothermal conditions at 80 °C, N,N-dimethylformamide (DMF) not only serves as a solvent but also can be decomposed to produce dimethylamine and trimethylamine, which act as structure-directing agents and charge-compensating cations. The powder XRD patterns and the simulated XRD patterns of the title compounds are shown in Fig. S1 (ESI†). The diffraction peaks on the patterns correspond well in position, confirming that the four compounds are all pure phase. The differences in reflection intensities are probably due to preferred orientation in the powder samples.
5. The temperature was very important for the formation of suitable single-crystals for X-ray diffraction. The best crystals of compounds 1–4 were obtained at the used reaction temperature of 80 °C. We also tried to prepare compounds 1–4 under the same reaction environments at different temperatures, but impure crystals or powders were obtained. Our results show that N,N-dimethylformamide (DMF) plays a dual role in the formation of the title compounds. Under the mixed-solvothermal conditions at 80 °C, N,N-dimethylformamide (DMF) not only serves as a solvent but also can be decomposed to produce dimethylamine and trimethylamine, which act as structure-directing agents and charge-compensating cations. The powder XRD patterns and the simulated XRD patterns of the title compounds are shown in Fig. S1 (ESI†). The diffraction peaks on the patterns correspond well in position, confirming that the four compounds are all pure phase. The differences in reflection intensities are probably due to preferred orientation in the powder samples.

![[3 with combining macron]](https://www.rsc.org/images/entities/char_0033_0304.gif) c
c![[3 with combining macron]](https://www.rsc.org/images/entities/char_0033_0304.gif) c
c![[3 with combining macron]](https://www.rsc.org/images/entities/char_0033_0304.gif) c
c![[3 with combining macron]](https://www.rsc.org/images/entities/char_0033_0304.gif) c
c


 , where
  and Vos are the surface potential barriers before and after illumination, respectively. As far as band to band transitions are concerned, a positive response of SPV (δVs > 0) means that the sample is characterized as a p-type semiconductor, whereas a negative response is an n-type semiconductor.


