Sorption of trace organics and engineered nanomaterials onto wetland plant material†
Fariya
Sharif
*a,
Paul
Westerhoff
a and
Pierre
Herckes
b
aSchool of Sustainable Engineering and the Built Environment, Ira A. Fulton Schools of Engineering, Arizona State University, Tempe, AZ 85287-530, USA. E-mail: fsharif@asu.edu; Fax: +1 888-314-6631; Tel: +1 480-274-2761
bDepartment of Chemistry and Biochemistry, Arizona State University, Tempe, AZ 85287-5306, USA
First published on 23rd November 2012
Abstract
Wastewater treatment plant (WWTP) effluents are sources for emerging pollutants, including organic compounds and engineered nanomaterials (ENMs), which then flow into aquatic systems. In this article, natural attenuation of pollutants by constructed wetland plants was investigated using lab-scale microcosm and batch sorption studies. The microcosms were operated at varying hydraulic residence times (HRTs) and contained decaying plant materials. Representative organic compounds and ENMs were simultaneously spiked into the microcosm influent, along with a conservative tracer (bromide), and then monitored in the effluent over time. It was observed that a more hydrophobic compound-natural estrogen achieved better removal than a polar organic compound – para-chlorobenzoic acid (pCBA), which mimics the behaviour of the tracer. Batch sorption experiments showed that estrogen has higher sorption affinity than pCBA, highlighting the importance of sorption to the plant materials as a removal process for the organic contaminants in the microcosms. Wetland plants were also found a potential sorbent for ENMs. Two different ENMs (nano-silver and aqueous fullerenes) were included in this study, both of which experienced comparable removal in the microcosms. Relative to the tracer, the highest removal of ENMs and trace organics was 60% and 70%, respectively. A more than two-fold increase in HRT increased the removal efficiency of the contaminants in the range of 20–60%. The outcome of this study supports that plant materials of wetlands can play an important role in removing emerging pollutants from WWTP effluent.
Environmental impactConstructed wetlands (CWTs) are used today to polish wastewater treatment plant (WWTP) effluent for the primary function of removing organic pollutants. The growing use of engineering nanomaterials (ENMs), however, has meant that these novel contaminants, in addition to organic pollutants, are likely to enter the wetlands. This study investigates the fate of ENMs in parallel with organic pollutants with the help of continuous-flow microcosms and batch sorption experiments using wetland plants. Plants serve critical functions for pollutant removal in wetlands by providing the surface area for sorption and supporting microbial growth. Sorption studies demonstrate plant materials as a potential natural sorbent of the pollutants. Continuous-flow microcosm studies support removal of contaminants in wetland water with decaying plant materials where biological processes can occur in addition to sorption. Unlike organic pollutants, knowledge of the fate of ENMs in the environment is still at a nascent stage. Investigations on the fate of ENMs in the microcosms reveal that once exposed, they can undergo transformation by processes that are likely to be influenced by the aqueous matrix. This study recognizes the potentials of constructed wetland plants to remove newer classes of contaminants including trace organics and ENMs. |
Introduction
Constructed wetlands (CWTs) are often designed to remove nutrients (nitrogen, phosphorous, organic carbon) and/or suspended solids from storm water runoff or wastewater effluent. However, emerging pollutants, including a variety of trace-level organic compounds (e.g., pharmaceutical and personal care products (PPCPs), plasticizers, stimulants and manufacturing agents) can also be found in CWTs and other effluent-dominated waters.1–3 A selected number of anti-inflammatory drugs, β-blockers, liner Alkylbenzene sulphonates, and pesticides can be effectively removed in CWTs.4–8 Mean removal efficiency of PPCPs in these wetlands varies from 50% to 80%, with few compounds, such as estrogen, reaching a 90% removal efficiency.1 Laboratory-scale microcosms are often used to study natural attenuation of pollutants in wetlands or other natural systems.2,5,6,8 Microcosms were found particularly useful for the study of mechanisms involved in attenuation of several organic pollutants.2 They were also used to evaluate specific parameters that can potentially impact pollutant removal.8CWTs are often designed for a particular hydraulic retention time (HRT) as a means to remove biochemical oxygen demand (BOD), nitrogen, and phosphorus.9 The effect of HRT on the removal of micropollutants, such as PPCPs, is not well investigated. Typically, longer HRTs are found to achieve greater nutrient removal.10–13 Treatment efficiency improves in these cases due to the lowering of the loading rate, which is inversely proportional to HRT. However, HRT is directly related to the size of the wetlands and needs to be optimized to obtain adequate removal at reasonable costs. Most often, adequate removal is achieved for an optimal HRT, beyond which further removal has been found to be negligible.13–16
Engineered nanomaterials (ENMs) represent a potential new class of emerging pollutants.17,18 Nano-scale titanium dioxide, silica/silica oxide, cerium oxide, zinc oxide, silver, fullerenes, and carbon nanotubes are being used, or will be in the near future, in a wide range of personal care products, pharmaceuticals, clothing, paints, industrial processing, and other consumer products. These ENMs are likely to enter sewage and storm waters.19,20 Currently, the fate of ENMs in wetlands is ill-defined, although the removal of many metals is well understood. For example, wetland environments, especially the rhizospheres of macrophytes, are well-known for phytoremediation of heavy metal particles. Similarly, common wetland plants, including reeds have been found to biomineralize copper into metallic nanoparticles in and near roots, thus preventing copper from entering the food chain.12 More recently, silver NMs were found to transform and react with surrounding chemical species of the aquatic environment.21 The process of binding with plant exudates is also considered an important abiotic reaction in the removal of silver NMs from water columns.22
The aim of this paper is to investigate removal of organic compounds of different polarities and ENMs of different sizes and composition by wetland plant materials through laboratory microcosms and batch scale experiments. Plants are critical components of wetlands which provide surface area for sorption and act as the major form of biomass. The microcosms in this study were operated in the dark and pre-equilibrated for six months using water with nutrient constituents as the water supply, and a weekly addition of dried, chopped bulrushes (Scirpus validus) as dry plant biomass. This addition of plants mimic the growing plants that senesce in wetland water. Pulse additions of two organic chemicals – (17β-estradiol (E2) and pCBA) and two ENMs-(functionalized nano silver (fn-Ag) and aqueous fullerenes (aq-nC60)) – were added simultaneously, along with a conservative tracer (Br−) into the microcosms operated with three different HRTs. We have previously shown these types of microcosms to represent trends that have been observed in full-scale wetlands for nitrogen and dissolved organic carbon (DOC).23,24 In this study; the microcosms were used to evaluate the role of HRTs on pollutant removal. Batch sorption studies were conducted using the similar plant materials to exclusively study the sorption affinity of the contaminants towards the plant surface existing in the water phase of wetlands. With help of these two experimental approaches, the specific objectives of this study are to answer the following questions: (i) To what extent can engineered nanomaterials be removed in the microcosms, along with the trace organic contaminants? (ii) Are batch sorption experiments reasonable predictors for the fate of emerging pollutants in simple microcosms? (iii) Does increasing HRT improve the removal efficiency of contaminants?
Materials and methods
Stock preparation
E2 and pCBA were obtained from Sigma-Aldrich, located in St. Louis, MO, USA. Potassium bromide was obtained from ICN Biomedicals Inc., Ohio. The stock solution of E2 was prepared in an HPLC grade methanol since it has very limited solubility in water. Potassium bromide stock solutions and pCBA were prepared in nanopure water (18.3 Ω conductivity; Milipore Inc., Billerica, MA). The aq-nC60 suspension was prepared by directly adding 99.9% C60 powder (MER Corporation; Tucson, AZ) to nanopure water and mixing for a prolonged period of three months. The suspension was filtered through a 0.7 μm GF/F filter and preserved in an amber bottle covered with aluminium foil to prevent any chances of photolysis. The fn-Ag suspension was a concentrated carboxy-functionalized Ag suspension (Vive; Ontario, Canada). A detailed characterization of the aqueous fullerenes and functionalized nano-silver can be found in a previously published article.25 The molecular structure of the organics and transmission electron microscopic (TEM) images of the ENMs are also available in ESI (Fig. S1†).Microcosm studies
The continuous-flow microcosms are multiple acrylic tanks (20 cm × 25 cm × 13 cm), each with a 6.4 L volume capacity. Fig. 1 is the schematic of the microcosm which shows the positions of the inlet and outlet from where influent water was continuously added and effluent samples were taken for measuring the concentration of the contaminants respectively. A model feed water was pumped (Monistat cassette peristaltic pump) through the microcosms at three different flow rates. The bulk residence time was calculated as volume divided by flow rate. The microcosms were operated at three HRTs: 2.1, 2.6, and 4.8 d. The feed water was used was dechlorinated granular activated carbon (GAC) filtered tap water (Tempe, AZ), with added nutrient constituents (0.2 mM K2HPO4, 1 mM NH4Cl). The reason for using tap water is that it contains a blend of common anions and cations.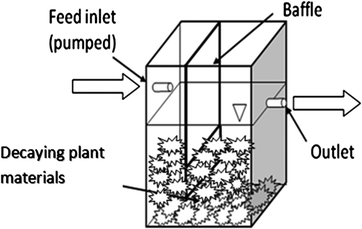 | ||
| Fig. 1 Schematics of the continuous-flow microcosms. | ||
Plant addition rates were determined based on a review of the productivity of emerging macrophytes. Temperate climates were found to yield 3000–4500 g DW m2 per year and tropical wetlands yielded 6500–8500 g DW m2 per year.25 For this study, 6000 g DW m2 per year was considered a reasonable estimate for the wetlands in Sonoran deserts of Arizona, USA which translated into an addition of 3 g of dried plant material per week.25 Due to decomposition, the added plants leach DOC and accumulate as biomass in the microcosms. Decaying plant materials is a major source of labile organic carbon in full-scale wetlands. With organic carbon, nutrients and trace metal ions being available, biological activity is likely to occur in the microcosms. Average influent and effluent water qualities of the microcosms are presented in Table 1. Higher levels of DOC in the effluent water indicate plant decomposition activity and consequent leaching of DOC. Nitrogen transformation was also observed in the microcosms. The effluent water ammonia (NH3) is probably the fraction of the influent NH3 that was not transformed within the microcosms and also any new NH3 formed by the plants. NH3 can form when organic nitrogen is released during plant decomposition. The presence of nitrite (NO2−) and nitrate (NO3−) in the effluent water also supports the evidence of nitrogen transformation process occurring in the microcosms.
| Parameters | Unit | Influent water | Microcosm 1 (HRT = 2.1 d) | Microcosm 2 (HRT = 2.6 d) | Microcosm 3 (HRT = 4.8 d) |
|---|---|---|---|---|---|
| DOC | mg L−1 | 2.0 | 5.00 | 5.70 | 6.30 |
| Ammonia, NH3–N | mg L−1 | 14.0 | 10.53 | 10.20 | 11.90 |
| Nitrite, NO2−–N | mg L−1 | 0 | 0.03 | 0.02 | 0.10 |
| Nitrate, NO3−–N | mg L−1 | 0 | 0.12 | 0.12 | 0.09 |
| pH | — | 7.2 | 7.33 | 7.10 | 7.40 |
| Conductivity | ms cm−1 | 1.2 | 0.90 | 0.98 | 0.94 |
| Total suspended solids (mg L−1) | mg L−1 | 0 | 7.30 | 33.40 | 8.30 |
| Volatile suspended solids (mg L−1) | mg L−1 | 0 | 6.40 | 21.20 | 5.40 |
Four different pollutants were spiked into the microcosms to achieve an initial concentration of 500 μg L−1. Br− was spiked in the form of potassium bromide stock solution to obtain a concentration of 30 mg L−1. A 100 ml volume of a solution containing all the target pollutants and tracer was spiked into the microcosms with a syringe pump, while simultaneously withdrawing the same volume out. This was done to minimize any turbulence and sudden changes in microcosm volume. Effluent samples were taken and filtered with 0.7 μm GF/F filters and stored at 4 °C until analysed.
Sorption studies with wetland plants
Sorption is one of the major abiotic processes influencing the fate of contaminants in wetlands. Contaminants can sorb onto sediments, plants, or suspended solids in wetlands. Much of the current effort related to sorption studies has focused mainly on soils and sediments, but not plants. The microcosms of this study contained plants, but no sediments, and thus batch experiments were conducted using the wetland plants.To quantify the interaction of organic pollutants or ENMs with plant materials, experimental data were fit by Freundlich's model. While the partitioning mechanism of organic pollutants to plant or soil surfaces differs from the aggregation-like mechanism of ENMs with the same surfaces, Freundlich's model was still found to fit both pollutant classes.25 An empirical model was used to describe the solid–liquid distribution coefficient Kd (L g−1)
| Q = KfC1/ne | (1) |
| Kd = KfC1/n−1e | (2) |
Sorption experiments were conducted using the bottle-point method. The background solution contained 1 mM NaHCO3. Two types of controls – (i) no plant material (only contaminants) and (ii) plant material only (without contaminants) were used. Experiments were carried out in 40 ml glass vials with Teflon-lined screw caps. The air-dried wetland plants, similar to those used in the microcosms were first hydrated in the background solution for 24 hours. One exception between the plants used in the microcosms and the sorption experiments is that the plants were autoclaved for 15 minutes at 1500 PSI after being air-dried prior to conduct the batch sorption experiments. Autolcaving was done to minimize any chance of plant decomposition and consequent microbial activity during the equilibration period. pH of the background water was adjusted to 7 prior to the addition of contaminants. The mass of plants added into the vials was selected to obtain a concentration of 10 g L−1. Another parameter that varied between the microcosm and sorption studies is the presence of ions in the water, commonly measured as ionic strength. Wetland influent water has higher ionic strength compared to the pH buffered nanopure water. Ionic strength can significantly impact ENM stability which is explained in the discussion section of this article.
Target compounds were added into the vials containing the background solution and plant materials. Vials were then covered with aluminium foil to avoid photolysis and equilibrated for 48 hours at room temperature. The equilibration time was selected based on the findings from previous experiment with E2, which showed that no further improvement could be attained if equilibration time was increased beyond 48 hours. Subsequently, the vials were left undisturbed for 6 hours to allow any large particles to settle. Samples were then filtered with 0.7 μm GF/F filters and kept at 4 °C before analysis. The amount sorbed by the plant material was calculated from the difference between the initial and final concentrations of the solute.
Tracer studies
Tracer studies are conducted to characterize hydraulic conditions inside a reactor. In many practical cases, mean residence time (![[t with combining macron]](https://www.rsc.org/images/entities/i_char_0074_0304.gif) ) is less than the theoretical residence time (τ) or HRT, which is determined by dividing the reactor volume with the bulk flow rate. This occurs due to short circuiting when fluid elements travel through a short path leaving behind unutilized spaces in the reactor. In the microcosms, this phenomenon is obvious because of the dead zones created by the plants. In our study, the pulse input of Br− was introduced as a tracer in the microcosms. Effluent samples were collected over time.
) is less than the theoretical residence time (τ) or HRT, which is determined by dividing the reactor volume with the bulk flow rate. This occurs due to short circuiting when fluid elements travel through a short path leaving behind unutilized spaces in the reactor. In the microcosms, this phenomenon is obvious because of the dead zones created by the plants. In our study, the pulse input of Br− was introduced as a tracer in the microcosms. Effluent samples were collected over time. ![[t with combining macron]](https://www.rsc.org/images/entities/i_char_0074_0304.gif) was calculated using eqn (3):
was calculated using eqn (3): | (3) |
 | (4) |
 | (5) |
 | (6) |
Analytical methods
Determination by HPLC-fluorescence/UV
Details of E2 and pCBA analysis with HPLC can be found elsewhere.26 In brief, our liquid chromatography analysis was performed on a Waters 600 series (Milford, MA, USA). Detection was accomplished with a Waters 2475 fluorescence detector at an excitation wavelength of 280 nm and an emission wavelength of 310 for E2. A Waters 5 mm LiChrosorbs RP18 analytical column (4.6 mm × 100 mm) connected to a Waters 5 mm LiChrosorbs RP18 guard column (4.6 mm × 10 mm) was used for reverse-phase separations with a 200 mL sample loop. The mobile-phase solvent profile was 45% deionized (DI) water acidified with 10 mM H3PO4 and 55% methanol for 30 minutes at a constant flow rate of 1 mL min−1. The pCBA was analysed simultaneously adopting the same method, but was detected with a Waters 2990 UV detector set to a wavelength of 234 nm. Method detection limit (MDL) for the pCBA and E2 were 4 and 1 μg L−1, respectively.Determination of fn-Ag with inductively coupled plasma-optical emission spectroscopy (ICP-OES)
Samples were digested with ultrapure nitric acid prior to analysis of fn-Ag ions with ICP-OES (Icap 6000 Series, Thermo Scientific; Cambridge, UK) at a wavelength of 328.0 nm and 338.2 nm. To understand the matrix suppression effect on recovery, appropriate amounts of fn-Ag suspension were spiked in different microcosm water matrices to obtain a concentration of 500 μg L−1. These matrix-spiked samples were digested and then analysed at the time of measuring all the other samples. Recovery of fn-Ag ions exceeded 95%.Hydrodynamic chromatography (HDC) interfaced with ICP-mass spectrometry (MS)
Unlike the “dissolved” organic pollutants, a thorough understanding of the environmental fate of ENMs cannot be obtained by measuring the concentration alone. Rather, it is also important to characterize the ENMs in terms of their particle size distribution. Hydrodynamic chromatography (HDC) is a separation technique used to separate small particles based on their flow through a packed bed of nonporous beads. Particle separation is accomplished as a result of velocity gradients that develop in the capillaries between beads. This technique can be used in tandem with metal detection methods, such as ICP-MS which is then known as HDC-ICP-MS, to investigate the fate of metal-containing ENMs in environmental samples.27Thermo X-Series 2 Quadruple ICP-MS (Thermo Fisher Scientific Inc., Waltham, MA) was used for Ag NM detection. The separation system consisted of a PL-PSDA Type-1 hydrodynamic chromatography column (Varian, Inc., Shropshire, UK) attached to a Thermo Spectra Series P100 HPLC pump (Thermo Fisher Scientific Inc., Waltham, MA) fitted with a manual injection valve. The reported size-separation range of the PL-PSDA column used here was 5–300 nm. The mobile phase used was a water based mixture of salts and surfactants: 0.5 mM Na2HPO4, 0.05% non-ionic surfactant (Triton-X100), 0.0125% C12H25SO4Na (SDS), 0.05% formaldehyde, adjusted to pH ∼7.5 using HCl and NaOH.28 Injection volumes of 20 μL were used with a mobile phase flow of 1.7 ml min−1 at a constant pressure of 9 MPa. A tee joint was installed between the column and the ICP-MS nebulizer to reduce the amount of sample reaching the plasma. A demonstration of HDC separation is provided in the ESI (Fig. S2†).
Aq-nC60 liquid–liquid extraction and HPLC analysis
The supernatant of the effluent samples, toluene, and acetic acid were combined in a ratio of 1![[thin space (1/6-em)]](https://www.rsc.org/images/entities/char_2009.gif) :
:![[thin space (1/6-em)]](https://www.rsc.org/images/entities/char_2009.gif) 1
1![[thin space (1/6-em)]](https://www.rsc.org/images/entities/char_2009.gif) :
:![[thin space (1/6-em)]](https://www.rsc.org/images/entities/char_2009.gif) 2.5, respectively. The solutions were then mixed for at least 2 hours prior to removing the toluene phase for HPLC analysis. The toluene extracts were diluted with an equal volume of acetonitrile. The molecular C60 in toluene–acetonitrile mixtures was then separated by a Supelco RP C-18 HPLC column, 15 cm × 4.6 mm I.D., 5 μm particle size (St. Louis, MO, USA), with detection occurring at 336 nm. The HPLC mobile phase was to be a 1 to 1 (v/v) mixture of toluene and acetonitrile, running isocratically at 1 mL min−1. The extraction procedure was able to recover 107 ± 3% of known concentrations of aq-nC60 based on the mass balance calculation.29
2.5, respectively. The solutions were then mixed for at least 2 hours prior to removing the toluene phase for HPLC analysis. The toluene extracts were diluted with an equal volume of acetonitrile. The molecular C60 in toluene–acetonitrile mixtures was then separated by a Supelco RP C-18 HPLC column, 15 cm × 4.6 mm I.D., 5 μm particle size (St. Louis, MO, USA), with detection occurring at 336 nm. The HPLC mobile phase was to be a 1 to 1 (v/v) mixture of toluene and acetonitrile, running isocratically at 1 mL min−1. The extraction procedure was able to recover 107 ± 3% of known concentrations of aq-nC60 based on the mass balance calculation.29
Results and discussion
Hydraulic behaviour of the continuous-flow microcosms
Preliminary trials were conducted on the microcosms (Fig. S3a and b, ESI†) to improve the hydraulic behaviour, and finally, an injection pump was used for pulse input of target compounds to minimize any turbulence and sudden changes in volume. Tracer responses for all three microcosms are plotted in Fig. 2. The![[t with combining macron]](https://www.rsc.org/images/entities/i_char_0074_0304.gif) of 2.1 d, 2.6 d, and 4.8 d microcosms was 1.92 d, 1.95 d, and 3.86 d, respectively. The n values for the same order of microcosms were 1.82, 1.71, and 1.82, respectively. The D values of the microcosms were 0.3, 0.27, and 0.27, respectively, which are within the typical range mentioned in the previous section.
of 2.1 d, 2.6 d, and 4.8 d microcosms was 1.92 d, 1.95 d, and 3.86 d, respectively. The n values for the same order of microcosms were 1.82, 1.71, and 1.82, respectively. The D values of the microcosms were 0.3, 0.27, and 0.27, respectively, which are within the typical range mentioned in the previous section.
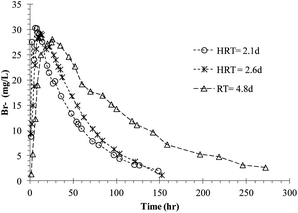 | ||
| Fig. 2 Tracer response with time from microcosms operated at different HRTs. | ||
The mass recovery of the tracer in the microcosms varied between 80 and 85%. Typically, treatment wetland tracer recoveries in the range of 80–120% are acceptable.9 Often recovery is subdued by retaining the tracer within the wetlands. Inorganic tracers like Br− are preferred to avoid any kind of degradation.
Batch sorption isotherms
Batch experimental data for interaction of the pollutants with bulrushes are presented in Fig. 3. Solid-water distribution coefficients determined from the Freundlich model for an initial concentration of 500 μg L−1 is reported in Table 2.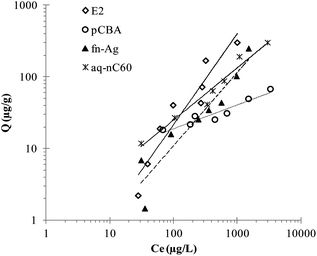 | ||
| Fig. 3 Sorption models for E2, PCBA, fn-Ag, and aq-nC60 with bulrush (Scirpus validus). | ||
| Trace organic contaminants/ENMs (class) | Molecular weight (MW) (gm mole−1)/size | pKa/charge | log KOW [log DOW @ pH = 7.5] | Solid-water distribution coefficient Kd (L g−1) |
|---|---|---|---|---|
| a = Effective diameter of the ENMs. | ||||
| 17β-Estradiol (E2) (steroid) | 272.4 | 10.4 | 3.94 [2.46] | 0.26 |
| p-Chlorobenzoic acid (pCBA) (process intermediate) | 236.3 | 3.98 | 2.52 [0.96] | 0.11 |
| Functionalized nano silver (fn-Ag) | D p = 10 nm NA | Zeta potential = −47.1 mV (@ pH = 7.0) | NA | 0.10 |
| Aqueous fullerene (aq-nC60) | D p = 80 nm | pH = 6.5 (in water) | NA | 0.17 |
Between the two organic compounds, the higher Kd value of E2 suggests its higher sorption tendency than pCBA. Sorption on the plant materials must have been caused by hydrophobic partitioning as E2, with higher hydrophobicity (represented by higher value of log KOW), sorbed more compared to pCBA. Natural and synthetic estrogen removal in wetlands are thought to be dominated by sorption1,30 and our batch experiments also suggest plants as a major sorbent in the wetlands. Between the two ENMs, aq-nC60 has a higher affinity for sorption than fn-Ag expressed by its higher Kd value. Unlike the organic contaminants, hydrophobicity of the ENMs cannot be estimated by means of parameters such as log KOW. But the sorption tendency of the two ENMs can be attributed to the differences in the material and surface properties. The aq-nC60, prepared by the prolonged stirring method, is relatively hydrophobic and its sorption is considered to be driven by hydrophobic interactions.24 However, fn-Ag used in this study had carboxylates as functionalizing agents. Carboxylates are low molecular weight polar molecules used for stabilizing particles in water, which, in turn, makes the ENMs more hydrophilic. Based on their surface properties, therefore, aq-nC60, being more hydrophobic, is likely to experience greater sorption onto the plant materials than fn-Ag.
Microcosm experiments
Concentration of the contaminants in the effluent samples collected with time was measured for each of the microcosms. Mass fraction of the contaminants at time t was estimated by multiplying the concentration with flow rate and the time interval. Mass recovery was then calculated using the simple equation below and compared for each HRT (Fig. 4). | (7) |
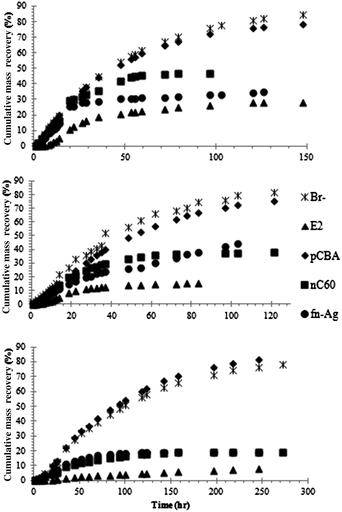 | ||
| Fig. 4 Cumulative mass recovery (%) of Br−, E2, pCBA, fn-Ag, and aq-nC60 in the microcosms: HRT = 2.1 d (top); 2.6 d (middle), 4.8 d (bottom). | ||
In all of the microcosms, regardless of a variation in HRT, the highest mass recovery was observed for Br− and pCBA. The least mass recovery was seen for E2; thus, E2 was found as the most efficiently removed pollutants in the microcosms. The recovery of the remaining two ENMs occurred between the two organics. Mass removal percentage of the target contaminants is compared in Fig. 5. Removal was adjusted to account for the loss of Br− in the microcosms. For example, if the removal of a contaminant was found to be 70% and the loss of Br− in the microcosm was 10%, then the actual removal of that contaminant would become 60%. Removal of E2 increased from 56% to 66% to 70% when HRT was increased from 2.1 d to 2.6 d and then to 4.8 d. Removal of aq-nC60 increased from 37% to 43% to 60% when HRT was increased to the higher values. For fn-Ag, the removal increased from 50% to 60% when HRT was increased from 2.1 d to 4.8 d; however, removal dropped to 38% when HRT was 2.6 d. Overall, increase in removal between the shortest and longest HRT were E2 (25%), fn-Ag (20%), and aq-nC60 (∼60%). pCBA removal was negligible and thus not considered during investigating the role of HRT.
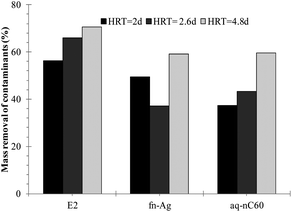 | ||
| Fig. 5 Percent mass removal of the contaminants at different HRTs. | ||
Size distribution of Ag nanoparticles
In addition to determining total Ag concentration, an analysis of the size distribution of the nanoparticles was conducted using HDC-ICP-MS method. The current method only allows characterization of metal-based NMs. Fig. 6(top) shows the size distribution of Ag in fn-Ag stock and an effluent sample from the microcosm operated at HRT of 4.8 d. Size calibration was done with Au colloids of 5, 20, 50, and 100 nm (Fig. 6(bottom)), which shows that the Ag NMs in the stock were <20 nm in size. Elution of the Ag peak and its shape from the microcosm effluent sample clearly indicate an increase in the size of the particles. Mean diameter of these particles ranged between 50 and 100 nm.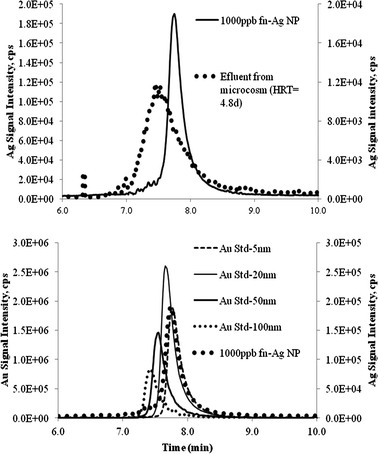 | ||
| Fig. 6 HDC-ICP-MS diagram top. Ag nanoparticle in fn-Ag stock and microcosm effluent sample bottom. Au standards calibration. | ||
The probable mode of interaction for Ag NMs in the microcosms include (i) sorption to the bulrushes, (ii) association with organic colloids, (iii) precipitation of the dissolved Ag in the form of chloride or sulfide (AgCl, Ag2S), (iv) aggregation and subsequent settling, or (v) physical straining and entrapment with suspended solids. Among these potential interaction mechanisms, sorption to the plants that influence the removal of Ag NMs has already been discussed. Partitioning to the colloids is the next possible option and to support this assumption, molecular weight distributions of the effluent samples were analysed to investigate the presence of organic colloids. Fig. 7 shows size exclusion chromatography (SEC) chromatograms for DOC in the effluent samples. The analytical method is explained elsewhere.26 Compounds in the high-molecular-weight range (above 10![[thin space (1/6-em)]](https://www.rsc.org/images/entities/char_2009.gif) 000 Da) are predominantly colloidal matter.31 The peaks in this region for the microcosm effluents indicate the presence of organic colloids. Thus it is possible that fn-Ag NMs were removed by partitioning onto the organic colloids generated in the microcosms.
000 Da) are predominantly colloidal matter.31 The peaks in this region for the microcosm effluents indicate the presence of organic colloids. Thus it is possible that fn-Ag NMs were removed by partitioning onto the organic colloids generated in the microcosms.
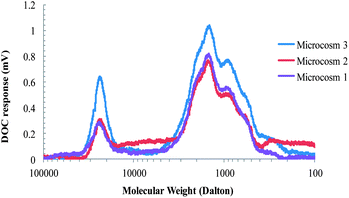 | ||
| Fig. 7 SEC-DOC data of the microcosm effluent samples. | ||
Addressing the research questions
The objectives of conducting the batch sorption and microcosm studies were to answer the key questions addressed at the beginning of this article. Based on the experimental findings, the responses to the key questions are as follows:(i) To what extent can engineered nanomaterials be removed in the microcosms, along with the trace organic contaminants? According to the removal data from the microcosms, hydrophobic organic compounds, e.g., E2 will be removed better than polar organic compounds. ENMs entering into microcosms alongside organic contaminants also have good potential for removal. Despite the differences in properties of the ENMs (e.g., size 10 versus 80 nm), both experienced very similar removal. Later from the matrix control experiments, the effect of microcosm influent on the stability of silver NMs was revealed which might have influenced their removal behaviour significantly.
(ii) Are batch sorption experiments reasonable predictors for the fate of emerging pollutants in simple microcosms? Experiments with wetland plants and fitting the data with sorption models were useful in predicting the trend for pollutant removal in the microcosms. E2 had the highest value for Kd (0.26 L g−1) and was also the most efficiently removed compound in the microcosms. Similarly, pCBA with the lower Kd (0.11 L g−1) value showed negligible removal in the microcosm. Based on the higher sorption affinity and better removal of E2, partitioning to plant surfaces can be considered an important removal mechanism for more hydrophobic compounds. However, the microcosms are biologically active because of the plant decomposition and simultaneous removal of contaminants by any biological process is possible.
Between the two ENMs, aq-nC60 had higher Kd value than fn-Ag, but both had comparative removal in the microcosms. Silver NMs have been reported to undergo significant dissolution under environmental conditions.32 Once dissolved, these ions can precipitate by coming into contact with other anions in the water matrix. Several batch control experiments were conducted in nanopure and microcosm influent water. ENMs were spiked into the beakers, and samples were taken at the beginning of the experiment and after 4 d. The concentration data are summarized in Fig. S4, ESI.† Significant loss in Ag concentration compared to aq-nC60 (49% opposed to 15%) was observed in microcosm influent water after 4 d. The potential reasons of such loss could be the dissolution tendency of the Ag NMs and formation of Ag-complexing ligands (e.g. AgCl). Oxidation of Ag0 to Ag+ is thermodynamically favoured at room temperature and once oxidized; precipitation in the form of AgCl is very likely.21 Even though NH4Cl was used as one of the nutrients in the microcosm influent water, average concentration of Cl− in tap water is 100 mg L−1. Such a level of Cl− is common in the freshwater sources of Southwest USA. Ions present in the tap water increases the ionic strength which can cause aggregation and subsequent sedimentation of the NMs. Thus sorption studies if conducted in microcosm influent water can make it difficult to differentiate the removal of Ag NMs contributed by sorption onto the plant surfaces from the transformation induced by the water matrix. However, no such effect of water matrix was observed for the organic contaminants. Thus developing sorption isotherms is a reasonable way to predict the removal tendency of organic pollutants in the microcosms but this practice may not be suitable for the ENMs as their removal is also influenced by the microcosm water matrix.
(iii) Does increasing HRT improve the removal efficiency of contaminants? By increasing the HRT, the overall removal of the target contaminants improved, but it was less significant for the organic contaminants than ENMs. Since E2 is predominantly removed by sorption and sorption removes the contaminants out of the aqueous phase and makes it stationary, the effect of residence time is found less important. On the other hand, ENMs can be subjected to various removal processes as discussed in the previous sections. Aq-nC60 could be associated with organic colloids or be physically entrapped in various locations of the microcosms. These processes could be impacted by HRT, which consequently affects the net removal of the ENMs. Regardless of the change in removal with the change in HRT, our observations commensurate with studies that also found that wetlands with short HRTs of 3–4 days are also able to achieve good removal of pollutants.11,13
Conclusion
This article investigates the role of wetland plant materials to remove pollutants of different categories. Batch scale sorption experiments were conducted to investigate the interaction of pollutants with plant surfaces whereas microcosm studies were used to identify the effect of HRT on pollutant removal. Although the microcosms do not contain all the major components of a wetland including living aquatic plants or sediments, they portray the importance of wetland plants and its ability to remove both trace organic compounds and ENMs. Existing CWTs are designed and operated at particular HRTs primarily to remove bulk pollutants and nutrients. With the help of the microcosms, this study shows that wetlands when operated at relatively short HRTs can remove both categories of pollutants. We acknowledge that both plants and sediments provide surface area available for sorption in wetlands and estimating sorption affinity towards the plants can be considered as a screening tool to identify which organic pollutants are more likely to be removed. Future research is necessary to uncover details of ENM interaction within wetland matrices. Apart from their role as sorbents, wetland plants decaying in the microcosms initiate biological processes that can be responsible for contaminant removal. Thus the microcosms used in study could represent the complex environment of CWTs where multiple removal processes occur simultaneously. Current research work is investigating the different removal processes supported by the decaying wetland plants in the microcosms.Acknowledgements
The funding of this study was partially provided by Graduate Fellowship program of Science Foundation of Arizona (SfAZ), Water Research Foundation (WRF) #4334 ‘Constructed Wetlands for Treatment of Organic and Nanomaterial Pollutants’ and Paul L. Busch Award from the Water Environment Research Foundation. The authors would like to thank Yifei Wang for the TEM images and quantification of aq-nC60. The support from Prof. Rolf Halden and Thomas Bruton in HDC-ICP-MS analysis is also gratefully acknowledged.References
- L. Gray and D. Sedlak, Water Environ. Res., 2005, 77, 24–31 CrossRef.
- L. J. Fono, E. P. Kolodziej and D. Sedlak, Environ. Sci. Technol., 2006, 40, 7257–7262 CrossRef CAS.
- P. Vazquez-Roig, V. Andreu, M. Onghena, C. Blasco and Y. Picó, Anal. Bioanal. Chem., 2011, 400, 1287–1301 CrossRef CAS.
- Y. Huang, L. Oritz, P. Aguirre, J. Garcia, R. Mujeriego and J. M. Bayona, Chemosphere, 2004, 59(6), 769–777 CrossRef.
- V. Matamoros, J. Garcia and J. M. Bayona, Environ. Sci. Technol., 2005, 39, 5449–5454 CrossRef CAS.
- V. Matamoros and J. M. Bayona, Environ. Sci. Technol., 2006, 40, 5811–5816 CrossRef CAS.
- V. Matamoros, A. Caselles-Osorio and J. Garcia, Sci. Total Environ., 2008, 394(1), 171–176 CrossRef CAS.
- J. L. Conkle, J. R. White and C. D. Metcalfe, Chemosphere, 2008, 73, 1741–1748 CrossRef CAS.
- R. H. Kadlec and S. D. Wallace in Treatment Wetlands, CRC Press, FL, 2nd edn, 2008 Search PubMed.
- Metcalf and Eddy, Inc., Wastewater Engineering: Treatment, Disposal and Reuse, McGraw Hill, New York, 3rd edn, 1991 Search PubMed.
- C. C. Tanner, J. S. Clayton and M. P. Upsdell, Water Res., 1995, 29(1), 27–34 CrossRef CAS.
- A. Manceau, K. L. Nagy and M. A. Marcus, Environ. Sci. Technol., 2008, 42(5), 1766–1772 CrossRef CAS.
- D. Ghosh and B. Gopal, Ecol. Eng., 2010, 36(8), 1044–1051 CrossRef.
- T. Y. Chen, C. M. Kao, T. Y. Yeh, H. Y. Chien and A. C. Chao, Chemosphere, 2006, 64, 497–502 CrossRef CAS.
- C. S. Akratos and V. A. Tsihrintzis, Ecol. Eng., 2007, 29, 173–191 CrossRef.
- P. Kotti, D. G. Georgios and A. Tsihrintzis, Ecol. Eng., 2010, 36, 862–875 CrossRef.
- P. Westerhoff, C. Z. Tian, R. Y. Surampalli, C. K. Keith, H. Zhiqiang, R. D. Tyagi and M. C. Irene, Engineered Nanomaterials as Emerging Contaminants in Water, in Nanotechnologies for Water Environment Applications, American Society of Civil Engineers, Reston, VA, 2009, ASCE/EWRI, 978-0-7844-1030-1 Search PubMed.
- G. Oberdörster, E. Oberdörster and J. Oberdörster, Environ. Health Perspect., 2005, 113, 823–839 CrossRef.
- B. Nowack and T. D. Bucheli, Environ. Pollut., 2007, 150, 5–22 CrossRef CAS.
- T. M. Benn and P. Westerhoff, Environ. Sci. Technol., 2008, 42(11), 4133–4139 CrossRef CAS.
- C. Levard, E. M. Hotze, G. V. Lowry and G. R. Brown, Jr, Environ. Sci. Technol., 2012, 46, 6900 CrossRef CAS.
- M. Unrine, B. P. Colman, A. J. Bone, A. P. Gondikas and C. W. Matson, Environ. Sci. Technol., 2012, 46, 6195–6924 Search PubMed.
- M. L. Pinney, P. K. Westerhoff and L. M. Baker, Water Res., 2000, 34(6), 1897–1911 CrossRef CAS.
- T. L. Ingersoll and A. B. Lawrence, Water Res., 1998, 32(3), 677–684 CrossRef CAS.
- M. A. Kiser, H. Ryu, H. Jang, K. Hristovski and P. Westerhoff, Water Res., 2010, 44, 4105–4114 CrossRef CAS.
- F. Sharif, J. Wang and P. Westerhoff, Ozone: Sci. Eng., 2012, 34(1), 26–31 CrossRef CAS.
- K. Tiede, A. B. A. Boxall, S. P. Tear, H. David and J. Lewis, J. Anal. At. Spectrom., 2009, 24, 964–972 RSC.
- G. R. McGowan and M. A. Langhorst, J. Colloid Interface Sci., 1982, 89, 94–106 CrossRef CAS.
- W.-C. Hou and C. T. Jafvert, Environ. Sci. Technol., 2009, 43(2), 362–367 CrossRef CAS.
- R. J. Williams, A. C. Johnson, J. J. L. Smith and R. Kanda, Environ. Sci. Technol., 2003, 37, 1744–1750 CrossRef CAS.
- G. X. Song, J. Wang, C. A. Chiu and P. Westerhoff, Environ. Sci. Technol., 2010, 44(21), 8216–8222 CrossRef CAS.
- X. Li and J. J. Lenhart, Environ. Sci. Technol., 2012, 46, 5378–5386 CrossRef CAS.
Footnote |
| † Electronic supplementary information (ESI) available. See DOI: 10.1039/c2em30613a |
| This journal is © The Royal Society of Chemistry 2013 |
