Reliable evaluation of dye-sensitized solar cells
Xudong
Yang
*a,
Masatoshi
Yanagida
b and
Liyuan
Han
*bc
aInternational Center for Young Scientists, National Institute for Materials Science, Tsukuba, Ibaraki 305-0047, Japan. E-mail: YANG.xudong@nims.go.jp; Fax: +81 29859 2200; Tel: +81 298513354-6328
bPhotovoltaic Materials Unit, National Institute for Materials Science, Tsukuba, Ibaraki 305-0047, Japan. E-mail: HAN.liyuan@nims.go.jp; Fax: +81 298592304; Tel: +81 298592747
cState Key Laboratory of Metal Matrix Composites, Shanghai Jiaotong University, Shanghai 200240, China
First published on 20th September 2012
Abstract
Dye-sensitized solar cells (DSCs) have attracted great interest as potential candidates of “low cost solar cells” in the solution of global energy demand. To accelerate the progress of DSCs, it is important to evaluate device performance with reliable measurements that will enable more effective comparison and application of new findings in materials and technologies by different research groups. In this perspective, we review existing measurement methods and summarize the appropriate techniques for the evaluation of DSCs based mainly on our experience, which helped us to obtain reliable results close to those certified by public test centres. The key factors in the measurements that correlate to device performance are discussed, including the calibration of the solar simulator using reference cells, the measurement time of the current–voltage characteristics and the incident photon-to-current conversion efficiency, and the area for determination with a proper shading mask. We demonstrate the causes and solutions of measurement errors in the results of device performance, such as short circuit photocurrent density, open circuit voltage, fill factor, and energy conversion efficiency. Finally, a list of appropriate measurements for a more reliable evaluation of DSCs is proposed.
 Xudong Yang | Dr Xudong Yang obtained his PhD degree from the Chinese Academy of Sciences. He worked as a postdoctoral fellow at the University of Cambridge, UK, and then joined the International Center for Young Scientists of the National Institute for Materials Science, Japan. His current research is focused mainly on understanding the mechanisms of the generation, separation, transport and recombination of excited states in semiconductors, organic materials and optoelectronic devices for applications in energy conversion. |
 Masatoshi Yanagida | Dr Masatoshi Yanagida is a principal researcher at the National Institute for Materials Science (NIMS). He obtained his PhD in 1998 at Hokkaido University and worked at the National Institute of Advanced Industrial Science and Technology (AIST), where he conducted work on the development of sensitizers and the tandem structure of dye-sensitized solar cells. His current research interests include the mechanism and device structure of dye-sensitized solar cell devices. |
 Liyuan Han | Dr Liyuan Han is the director of Photovoltaic Materials Unit, National Institute for Materials Science. After obtaining his PhD from the University of Osaka Prefecture, he worked on dye-sensitized solar cells at SHARP Corporation for 12 years and moved to his current position in 2008. His current research is focused on dye-sensitized solar cells, organic solar cells, and quantum dot solar cells. He is also an inventor on around 100 patents and author in ca. 100 scientific publications. |
Broader contextPhotovoltaic technology can utilize solar light as clean and renewable energy source to help solve problems related to energy shortages and environmental pollution caused by the consumption of fossil fuels. Dye-sensitized solar cells (DSCs) are regarded as one of the most promising low cost photovoltaic devices and attract great interest in further improvement of overall energy conversion efficiency. Unfortunately, many improvements cannot be reproduced under similar or stricter conditions. This implies that these reported results, without certification, have fairly apparent errors in the evaluation of the device performance. Possible errors owing to unreliable measurements can lead to misunderstanding of the results and thus make unfavorable difficulties in the evaluation of different research activities. Here we review existing measurement methods and summarize the appropriate techniques for the evaluation of DSCs based mainly on our experience. In the conclusions, we propose a list of appropriate measurements for a more reliable evaluation of DSCs. |
1. Introduction
Owing to their low manufacturing cost and environmentally friendly character, dye-sensitized solar cells (DSCs) are regarded as promising next-generation alternatives to conventional silicon-based photovoltaic devices.1–6 The general structure of a DSC is given in Fig. 1, which comprises a dye-sensitized nano-crystalline titanium dioxide (TiO2) electrode on a transparent conducting oxide (TCO) substrate, a platinum (Pt) counter electrode, and an electrolyte solution containing iodide (I−)/tri-iodide (I3−) redox couple between the electrodes. The main processes in DSCs involve light absorption by dye molecules adsorbed on nanocrystalline TiO2 and subsequent electron transfer from the photo-excited dye molecules to the conduction band of TiO2. The electrons are then transported through the nanocrystalline TiO2 particles toward the TCO front electrode. Finally, the oxidized dye is regenerated via the electron transfer from the I− in the electrolyte and the I− is regenerated in turn by the reduction of the I3− at the interface of Pt counter electrode and the electrolyte.7,8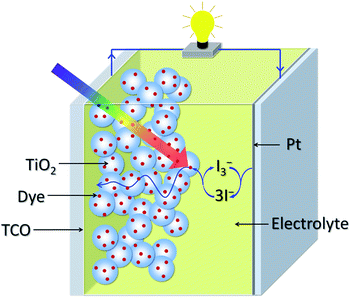 | ||
| Fig. 1 Schematic structure of dye-sensitized solar cell. | ||
A traditional method to evaluate the performance of solar cells is to measure the current–voltage (I–V) characteristic, in which the bias voltage is changed stepwise and the values of the photocurrent are measured simultaneously. The main parameters of the solar cell performance, including short circuit current (ISC) or current density (JSC), open circuit voltage (VOC), fill factor (FF), and energy conversion efficiency (η), can be obtained by analyzing the I–V curves, and their relationship is:
 | (1) |
The standards of measuring solar cells have already been established and applied, e.g. IEC 60891, IEC 60904 and IEC 61853, etc., by International Electrotechnical Commission. On the standardized basis, the lists of the highest confirmed efficiencies have been published every six months in “solar cell efficiency tables”.9,10 The current standardized evaluation of DSCs is conducted by performing the measurement in an approved public test centre, such as Fraunhofer Institute of Solar Energy (ISE, Germany), the National Institute of Advanced Industrial Science and Technology (AIST, Japan), and the National Renewable Energy Laboratory (NREL, USA), where the measurement conditions are certified.10 Performing a measurement in these public test centres is expensive and time consuming owing to the large demand. A more efficient and cost-effective way of accelerating the progress in a DSC research group is to establish a reliable and standardized test system and examine the newly developed solar cells in their own laboratory.
In the past 20 years, there has been a rapid growth in the amount of published papers on DSCs focusing on the application of new materials and technologies to improve the device performance. However, some improvements cannot be reproduced under similar or stricter conditions by other groups. This implies that the announced results, without certification, have errors in the evaluation of their device performance. Possible errors owing to unreliable measurements can lead to misunderstanding of the results and thus make unfavorable difficulties in the evaluation of different research activities.9–16 This indicates the standards for evaluating solar cells have not been widely carried out in the field of DSCs. Accompanied with this rapidly growing branch of solar cells, there are many doubts on the results of DSCs measured in unauthorized laboratories because too much is claimed regarding DSCs' special characteristics in comparison with other solar cells. To avoid doubts in the evaluation results of DSCs, especially where claims of best performance are concerned, they should follow the standard measurement of solar cells until new standards for DSCs are established in the future. As the users, but not the creators of the standards, here we follow the existing standards and report our experience for the reliable measurement of DSCs.
According to the standard measurement, in 2004 we reported the importance of reliable measurement methods such as the set-up of proper delay time and the use of a shading mask during measurement.12 By using these methods, we achieved similar evaluations to the certified ones obtained by a public research centre. This enabled highly accurate examinations of DSCs and allowed us to make successfully high efficiency DSCs in 2006 and 2011 with the records certified at a public research centre.4,6 In the latest version of the “solar cell efficiency tables” the authors, who are authorities in the measurement field, pointed out the unreliable measurement problem in DSCs.10 With these considerations in mind, here we review the measurement methods, based mainly on our experience, that helped us to obtain reliable evaluations. The correlations between the measured DSCs performances and the measurement conditions, such as the calibration of the solar simulator using reference cells, the setting of a measurement time for I–V characteristics and the incident photon-to-current conversion efficiency (IPCE), and the area for determination with a proper shading mask, etc., are demonstrated. In the conclusions, we propose a list of proper measurements for the reliable evaluation of DSCs’ performance.
2. Light source
Generally, the performance of solar cells is determined by analyzing I–V curves measured under simulated Air Mass 1.5G sun light. A high quality solar simulator is thus required for indoor measurement. The most common type of light source for solar simulators is the Xenon lamp that can provide illumination for the measurement of different sample areas with various light intensities. With AM 1.5 filters, the simulated spectrum can nearly match the spectrum of sunlight from the visible to near IR range. However, there are some unfavorable sharp atomic transitional peaks around 450 nm and 650–850 nm in the spectrum of the commercial solar simulator (Fig. 2). These peaks give high intensity light that can induce extra photocurrent in the evaluation of solar cells.11,16,17 For example, the spectral response of a DSC with the N719 dye mainly covers the wavelength range of 300 nm to 750 nm and errors can be caused by the extra light peaks around 450 and 700 nm.18,19 For DSCs with the N749 dye, more errors caused by the mismatch around 800 nm cannot be neglected as its response spectrum extends to 900 nm.4,20 In addition, the spectrum and light intensity of the lamp varies with its aging process. Therefore, it is often required to calibrate the solar simulator to minimize the mismatch of the spectra.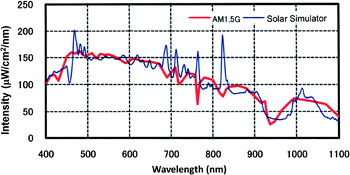 | ||
| Fig. 2 Spectra of standard AM 1.5G solar light (red curve) and a simulated AM 1.5 light source from Wacom Electric Co., Ltd (blue curve). | ||
Fig. 3 shows the schematic process of calibration of a solar simulator by using a reference cell according to IEC 60904. The reference cell has a similar spectral response to the test cell and is first calibrated by a “standard cell” under “standard conditions” in a public research centre where a certified short-circuit photocurrent of the reference cell is recorded. Then the reference cell is used to calibrate the solar simulator located at the corresponding laboratory. The solar simulator is adjusted until the reference cell generates a photocurrent of the same value as recorded in the first calibration.
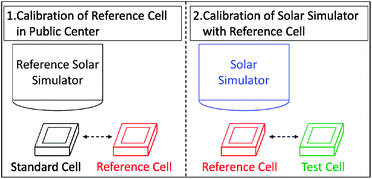 | ||
| Fig. 3 Schematic process of calibration of the solar simulator by a reference cell. | ||
Since the reference cell is important in the calibration of the solar simulator, it is required long-term stability for frequent calibrations. Until now, a DSC matching such requirements has rarely been found. Therefore, a crystalline silicon (c-Si) solar cell with long-term stability is generally used as an alternative. Fig. 4 shows the spectral response of the c-Si reference solar cell, referred to as the IPCE, which extends up to 1100 nm and is broader than that of most DSCs. The mismatch of spectral response between the c-Si reference cell and test DSCs needs to be adjusted further to minimize the measurement errors. One approach is by covering the reference cell with a light filter to give similar spectral response from the reference cell and the test cell. The light filter used should be specific for a given test cell. For instance, a KG-5 filter used during calibration would allow the reference cell (c-Si solar cell) to have a similar spectral response to a DSC sensitized with N719 dye. In addition, when the test DSC is sensitized with N749 dye, the solar simulator needs to be calibrated with a c-Si solar cell covered by the KG-3 filter (Fig. 4). For DSCs sensitized by other dyes, such as newly developed organic dyes with IPCE spectra in the range of 300 nm to 700 nm, narrower than that of N719, theoretically new corresponding reference cells are required for every specific test DSC. However, it is very hard to realize such strict conditions in practice. An effective solution is to use the existing reference cell of DSCs sensitized with N719 for calibration because it can avoid the errors induced by the peaks over 750 nm. In the near future, if we could develop DSCs with an IPCE extending further into infrared region, a careful selection of other suitable filters will be needed to adjust the IPCE spectra of the reference solar cells to match that of the test DSCs in the calibration. The use of a light adjustment filter during calibration of the solar simulator is a necessary technique to ensure that the input light for testing is suitable for the tested solar cell, and thus reduce measurement errors.
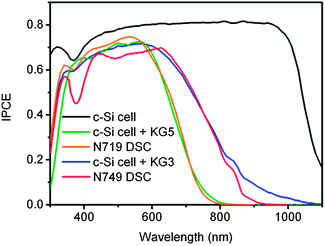 | ||
| Fig. 4 IPCE spectra of c-Si solar cell (black curve), c-Si solar cell covered with a KG5 filter (olive curve), N719 DSC (orange curve), c-Si solar cell covered with a KG3 filter (blue curve) and N749 DSC (red curve), measured under simulated AM 1.5G illumination. | ||
The errors generated in the calibration of the solar simulator can be estimated by the spectral mismatch factor (M),21,22
 | (2) |
Generally test DSCs are measured under a standard light intensity of 100 mW cm−2 from Air Mass 1.5G solar simulators. To evaluate the DSCs’ performance under weaker light, some studies have reported the measured results under exposure with weaker light, which sometimes shows a higher energy conversion efficiency than that under the “standard” intensity. Considering the complexity in the calibration of simulator, it is crucial to meet the requirements that the spectrum of solar simulator should be identical to the standard one and the reference cell should generate the corresponding photocurrent under weak light intensity. It will be very helpful to estimate the errors caused by adjusting the light intensity of the simulator in the measurement of I–V curves and IPCE spectra.
3. Equilibrium conditions
Steady state measurements of solar cells, such as the I–V characteristics and IPCE spectrum, must be performed under equilibrium conditions. During the measurement of solar cells, any variation of the measurement conditions, such as applied bias voltage, irradiance of incident light, temperature, etc., will change the internal state of solar cells to non-equilibrium conditions. A delay time (Td) is then needed for solar cells to reach new equilibrium conditions.3.1 I–V characteristics
In the measurement of I–V characteristic curves, the applied bias voltage is changed stepwise from short circuit to open circuit (normal scan) or in the reverse direction. The measurement of photocurrent in each step should be performed after a delay time until the test cell is in an equilibrium condition, which depends on its intrinsic properties (Fig. 5a).13 Generally the delay time should be 4 times as long as the time constant of the test cell.23 The time constant represents the time for the photocurrent to decrease or increase by a factor of (1 − 1/e) of the total variation (e is the mathematical constant, approximately equal to 2.71828). The time constant in silicon solar cells is in the time range of ∼ns to ∼μs and that in DSCs is generally ∼ms or larger. After a delay time as long as 4 times the time constants, the variation of photocurrent reaches 0.98 of its final value, which is nearly to the equilibrium state. For the Si solar cell, both the normal and reverse scan I–V curves are identical to each other when the sampling delay time is set as 1 ms. However in a DSC, a small hysteresis window can be observed between the normal and reverse scan I–V curves with a delay time of 1 ms (Fig. 5b).12 The corresponding values of VOC, FF and η obtained from the I–V curve of the reverse scan are 0.735, 0.778, and 8.85% respectively, which are larger than those in the normal scan, given as 0.714, 0.717, and 7.94% respectively (Table 1).12 Such a discrepancy between the values obtained from normal and reverse scans induces a considerable error of 10% when the applied Td is shorter than the time required for the equilibrium of the cell. The error decreases with the increase of Td and can be reduced to 2% when the Td is 100 ms. The dependence of the measured parameters on delay time shows that Td should be several tens of ms larger in the I–V measurement of DSCs than that in conventional Si solar cells. Another suitable method to reduce errors, as proposed in our previous work is to take the average of measured values obtained in the normal and reverse scans.12 This method is beneficial to get relatively reliable results with shorter Td and has been adopted by some companies for outdoor measurements where fast measurements are needed owing to the fluctuation of solar irradiation.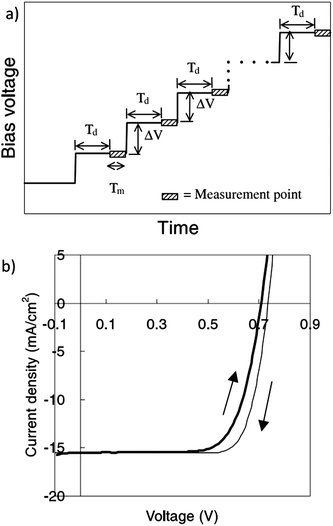 | ||
| Fig. 5 (a) The setting of delay time (Td) in measurements with stepwise applied voltage; (b) the I–V characteristics of DSCs in normal scan (short circuit to open circuit) and reverse scan (open circuit to short circuit) under simulated AM 1.5G illumination.13 | ||
| Cell type | T d/ms | Scan direction | J SC/mA cm−2 | V OC/V | FF | η/% | Average |
|---|---|---|---|---|---|---|---|
| DSC | 1 | Normal | 15.5 | 0.714 | 0.717 | 7.94 | 8.40 |
| Reverse | 15.5 | 0.735 | 0.778 | 8.85 | |||
| 10 | Normal | 15.5 | 0.719 | 0.731 | 8.13 | 8.30 | |
| Reverse | 15.5 | 0.732 | 0.747 | 8.46 | |||
| 40 | Normal | 15.5 | 0.722 | 0.733 | 8.19 | 8.29 | |
| Reverse | 15.5 | 0.731 | 0.740 | 8.39 | |||
| 100 | Normal | 15.4 | 0.724 | 0.733 | 8.18 | 8.29 | |
| Reverse | 15.4 | 0.729 | 0.739 | 8.35 | |||
| Si | 1 | Normal | 36.7 | 0.644 | 0.713 | 16.9 | 16.9 |
| Reverse | 36.7 | 0.644 | 0.713 | 16.9 |
The time constant for equilibrium of DSCs can be estimated by the measurement of the transient photocurrent under the application of a stepwise-changed voltage. Fig. 6 shows the stepwise applied voltage around VOC in a step of 10 mV with 50 ms holding time and the transient photocurrent responses of DSCs both in normal and reverse scans. In the normal scan, an overshot current appears immediately after an abrupt increase of applied voltage and then the current gradually decreases to an equilibrium state after a delay time of about 30 ms. If the delay time in photocurrent measurement is shorter than 30 ms, the overshot current would reach zero earlier than the equilibrium photocurrent in the measurement of I–V curves. As a result, the VOC obtained in the normal scan would be underestimated when a short Td is applied. In the reverse scan (thin lines), an abrupt decrease of voltage induces a current shortage and it costs about 30 ms to reach equilibrium. A shorter delay time will cause the measured photocurrent to reach zero earlier than the equilibrium photocurrent, and hence result in the overestimation of VOC. Therefore, a larger VOC would be obtained in the reverse scan than that in normal scan when the applied Td is shorter than the equilibrium time.
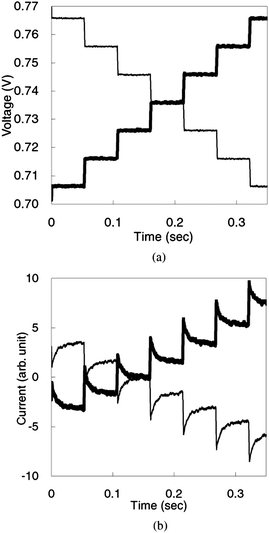 | ||
| Fig. 6 Transient photocurrent of a DSC after application of a stepwise-changed voltage with a delay time of 1 ms: (a) applied voltage; (b) transient photocurrent. Data of normal and reverse scans are depicted as bold and thin lines, respectively. The composition of the electrolyte solution is 1,2-dimethyl-3-propyl imidazolium iodide (0.6 M), lithium iodide (0.1 M), iodine (0.05 M) and 4-tert-butylpyridine (0.5 M) in acetonitrile.13 | ||
For a deeper understanding of the dependence of I–V parameters on Td, an equivalent circuit model (Fig. 7) was proposed to simulate the I–V curves of DSCs.13,14 It was deduced that the large time constant of DSCs is due to the large capacitance, which is possibly induced by a large interfacial area between the TiO2 electrode and electrolyte. However, the measured I–V curves for a polymer-based bulk heterojunction solar cell, which also has a large internal interface between donors and acceptors, are almost independent of Td in the range of 1 ms to 100 ms. Therefore, the large internal interface could not be the reason for the large time constant in DSCs. The results from further simulations with equivalent circuit models suggested that the large time constant was mainly due to the slow Nernstian diffusion of ions in the electrolyte.13
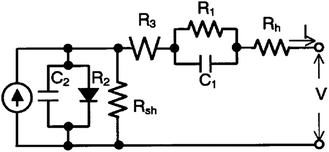 | ||
| Fig. 7 Equivalent circuit model for DSCs. R1 and C1: impedance at the Pt counter electrode; R2 and C2: impedance at the TiO2/dye/electrolyte interface; R3: impedance of Nernstian diffusion in the electrolyte; Rh: sheet resistance of the F-doped SnO2 glass; Rsh: shunt resistance at TiO2/dye/electrolyte interface. R1, R3, and Rh represent series internal resistance.14 | ||
The above results are obtained in the measurement of DSCs in which acetonitrile is used as electrolyte solvent and the viscosity of acetonitrile is ∼0.3 mPa s. For DSCs with high stability, ionic liquids with high viscosity have been widely used as solvents for the electrolyte.24,25 The ion diffusion may be much slower in electrolytes with higher viscosity, and it may induce a larger equilibrium time constant that requires a longer Td for reliable measurement. As an example, we made ionic-liquid electrolyte based DSCs utilizing 1-propyl-3-methyl-imidazolium iodide which has a relatively high viscosity (∼880 mPa s).26 The I–V curves were measured in the normal scan with various delay times ranging from 5 to 5000 ms. Because the measurement time would be 10 minutes long when Td is 5000 ms and the temperature would be changed by the heat generated during the long time irradiation, the test DSC was illuminated for 20 minutes before measuring I–V curves, to stabilize the temperature.
The result shows that the delay time affects not only the VOC but also the JSC significantly. As shown in Fig. 8a, the JSC measured with a delay time of 5000 ms is 8.9 mA cm−2, while it is 10.1 mA cm−2 when measured with a 5 ms delay time. The JSC is overestimated by 11% in the measurement with a shorter delay time. The extra photocurrent may be due to the long equilibrium time of the ionic-liquid electrolyte based DSCs as well as the scan conditions. Before starting the scanning, the DSC is in the open circuit state and contains a large amount of charges with a density of about 1018 cm−3 under the illumination of simulated AM 1.5G solar light.27,28 When the scan in the normal direction starts with the applied voltage less than zero (Fig. 8a), the stored charges in the DSC will be released into the external circuit and induce an extra current. If the delay time is long enough, for example 5000 ms, it will cost 100 s to change the bias voltage from −0.20 to 0.00 V at a step of 10 mV. Most of the unwanted stored charges will be discharged after several steps of I–V measurement. The remaining amount of stored charge would be very little, and could only sustain a relatively low extra current, and the total current will almost approach the equilibrium value. Conversely, by setting a delay time of 5 ms it would take about 100 ms to change the bias voltage from −0.20 to 0.00 V at a step of 10 mV. During this short period, only a small amount of stored charge is released and the large amount of remaining charges can still contribute to a relatively-high extra current. An overestimation of JSC is then obtained by setting a short delay time. Similarly, in the reverse scan with short Td, the discharge of stored charges isn't adequate to reach equilibrium, as revealed by the gradual decrease of photocurrent when the bias voltage changes from 0.40 to 0.00 V. With increasing Td, the influence of the stored charges is reduced and the values of JSC approach that in the equilibrium state. The JSC values obtained under normal and reverse scans would be almost the same when Td is large enough.
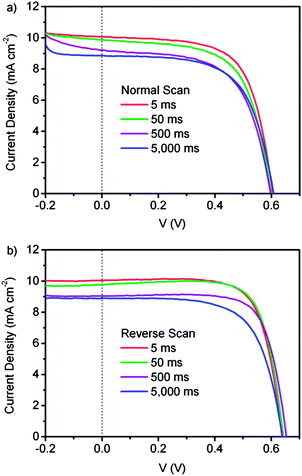 | ||
| Fig. 8 I–V curves of an ionic electrolyte based DSC with a large time constant, measured in the (a) normal direction and (b) reverse direction with a delay time of 5 ms, 50 ms, 500 ms and 5000 ms under AM 1.5 simulated solar light. The electrolyte consists of 0.03 M LiI, 0.26 M I2 and 0.3 M tert-butylpyridine, dissolved in MPImI (1-propyl-3-methyl-imidazolium iodide). The DSC is measured at 25 °C using a shading mask and the aperture area is used for calculation. | ||
Fig. 9 shows more detailed results of the dependence of JSC and VOC on the delay time ranging from 2 ms to 5000 ms. When Td increases, the JSC decreases gradually in both the normal and reverse scans. It decreases rapidly from 10.1 mA cm−2 to about 9.1 mA cm−2 in the time range from 2 ms to 500 ms and then reaches a stable value when the delay time is larger than 500 ms. In the normal scan, the VOC decreases from 0.604 V to 0.590 V in the time range from 2 ms to 200 ms and then stabilizes at 0.608 V with a longer delay time. In the reverse scan, the VOC increases from 0.638 V to 0.654 V in the time range from 2 ms to 500 ms and then stabilizes at 0.640 V with a 5000 ms delay time. The fill factor also varies with the scan direction and the delay times. In the normal scan, the fill factor decreases from 0.66 to 0.61 when the delay time increases from 2 ms to 200 ms, and then slowly increases to 0.63 with longer delay time. In the reverse scan with a delay time of 2 ms the fill factor is 0.725, and increases to 0.78 at 200 ms. It then decreases to 0.665 when delay time is 5000 ms. The variation of fill factor correlates to that of the JSC and VOC, which are influenced by the slow ion diffusion and the stored charges. In the case of energy conversion efficiency measurement, a shorter delay time than the equilibrium time can result in large errors. For example, the value of η is 4.69% in the reverse scan with delay time of 50 ms, while in a normal scan with a delay time of 1000 ms η is 3.37%. There is nearly a 40% difference between them, and it is large enough to raise arguments about the estimation of conversion efficiency. A longer delay time is definitely required for reliable measurement of ionic-liquid electrolyte based DSCs owing to the large equilibrium time constants that need to be further studied to reveal the underlying mechanism. Considering the obvious difference between the values measured in the normal and reverse scans, a suitable method suggested by our previous study is by averaging the results obtained by the two scans.12 As shown in Fig. 9, the average values of JSC, VOC and η are almost constant when the delay time is larger than 1000 ms. These studies have shown the importance of the equilibrium conditions of DSCs for measuring the I–V characteristics in which the optimization of delay time is required in each step of measurement to generate a stable photocurrent.
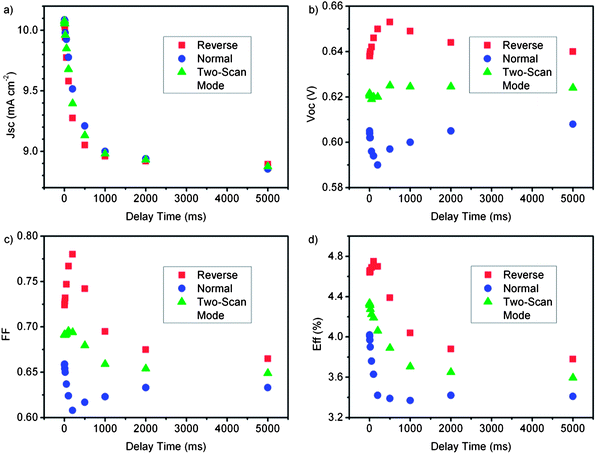 | ||
| Fig. 9 The main parameters of DSCs with large time constant as functions of delay time, measured under normal scan (blue circle), reverse scan (red square) and the average values from the two scans (green triangle) under AM 1.5 simulated solar light. The electrolyte consists of 0.03 M LiI, 0.26 M I2, 0.3 M tert-butylpyridine, dissolved in MPImI (1-propyl-3-methyl-imidazolium iodide). The DSC is measured at 25 °C with using a shading mask and the aperture area is used for calculation. | ||
3.2 IPCE measurement
The consideration of the equilibrium conditions is also required in the IPCE measurement where the spectral response is taken under short circuit conditions. There are two main methods for IPCE measurement, classified as the AC mode and the DC mode.In the AC mode, the test DSC is illuminated by monochromatic light with the addition of simulated AM 1.5G solar light to represent the solar cell working conditions. The photocurrent responding to the monochromatic light is measured precisely by a lock-in amplifier at a frequency that is also applied to a mechanical chopper to modulate the monochromatic light. As shown in Fig. 10a, the IPCE spectra of a polymer-based bulk heterojunction solar cell (BHSC) and c-Si solar cell measured by the AC mode with bias light are independent of the chopping frequency of 10 to 80 Hz; while for DSC, the IPCE spectrum strongly depends on the chopping frequency of the monochromatic light (Fig. 10b). For example, when the chopping frequency is 80 Hz, the IPCE value measured at 600 nm is 0.56 (Fig. 10c). It increases when the chopping frequency decreases and becomes almost stable at 0.71 when the chopping frequency is lower than 5 Hz. The IPCE values measured under other wavelength show a similar tendency. These results indicate the test DSC needs a much longer equilibrium time than BHSC and c-Si solar cells for IPCE measurement. Therefore, in the measurement of IPCE of DSC, the chopping frequency must be low enough to keep a sufficiently long time of illumination on the solar cell to stabilize the photocurrent.
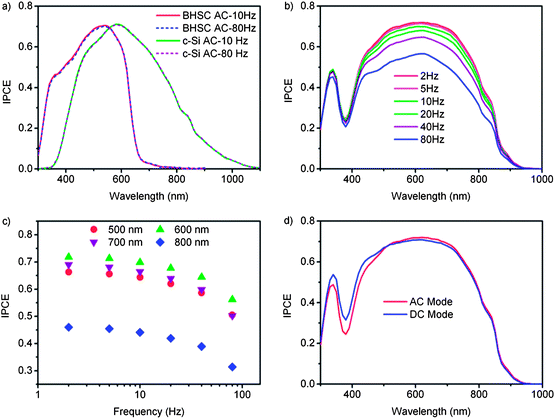 | ||
| Fig. 10 (a) IPCE spectra of c-Si cell, polymer-based bulk heterojunction solar cell (BHSC); (b) IPCE spectra of DSC measured in AC mode with different chopping frequencies; (c) IPCE measured at 500 nm (solid circle), 600 nm (up triangle), 700 nm (down triangle) and 800 nm (diamond) as a function of chopping frequency; (d) IPCE of DSC measured under AC mode with AM 1.5 simulated sunlight (red curve) and DC mode without simulated sunlight (blue curve). The electrolyte consists of 0.6 M dimethylpropyl-imidazolium iodide, 0.05 M I2, 0.1 M LiI and 0.4 M tert-butylpyridine in acetonitrile. The DSC is measured at 25 °C with using a shading mask and the aperture area is used for calculation. | ||
In the DC mode, the photocurrent is measured under the illumination of monochromatic light with a fixed photon flux which is normally 1014 cm−2 s−1. The generated photocurrent may be 3 orders of magnitude smaller than that generated under AM 1.5G solar light. However, it is hard to measure the IPCE of DSCs precisely with such small photon flux, so the photon flux of the monochromatic light is increased to 1016 cm−2 s−1. Fig. 10d shows the IPCE spectra of a DSC measured under the AC mode (2 Hz) and the DC mode with fixed photon flux of 1016 cm−2 s−1, respectively. In the range of 500 nm to 900 nm, the IPCE values of the two modes are very close to each other. The total photocurrent can be estimated from IPCE spectra by integrating the incident photon flux density Iphoton (λ) and IPCE (λ) over the wavelength of the incident light, expressed as:8
 | (3) |
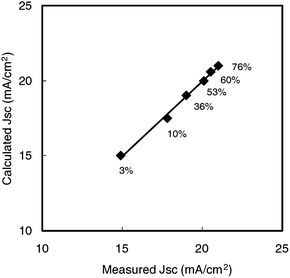 | ||
| Fig. 11 A linear relationship between JSC calculated from eqn (3) and JSC measured from I–V characteristics. The solid line shows a good fit to the data, y = 0.99 x − 0.008. Percentage values indicate the haze of TiO2 electrodes at 800 nm.4 | ||
4. Area for determination
In the evaluation of DSCs, generally there are two different areas to be used for the determination of the photocurrent density and energy conversion efficiency: the aperture area (Aap) and the active area (Aac).12,15 The aperture area is restricted to the illumination area by using a shading mask to prevent all other possible incident light and the active area is the area of the dye-sensitized TiO2 electrode (Fig. 12). We use masks made of steel with a thickness of 0.2–0.3 mm. All the surfaces are black to ensure the transmittance to be 0% and the reflectance to be less than 5% in the UV to near-IR range. Black paint or plastic tape is not suitable for the mask because of their relatively higher transmittance and reflectance.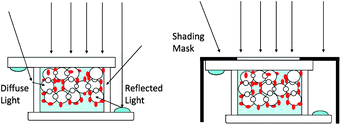 | ||
| Fig. 12 Incident light into DSC with and without shading mask. | ||
Fig. 13a shows the I–V curves of a DSC measured with and without a shading mask, respectively. When covered by a shading mask, the area used for calculation of the photocurrent density is equal to Aap, which is approximate to Aac. In this case JSC and η are 19.1 mA cm−2 and 10.1% respectively, while in case of no shading mask, Aac is used for the calculation of the photocurrent density. JSC and η obtained from the I–V curve are 25.2 mA cm−2 and 13.1% respectively. A 30% overestimation of η is induced by the absence of the shading mask. Moreover, in the IPCE spectra, the maximum calculated by Aap is 0.77 when the test DSC is covered by a shading mask (Fig. 13b). When the measurement is taken without the shading mask and the area used for calculation is solely Aac, an overestimation of the maximum value of 0.93 is obtained.
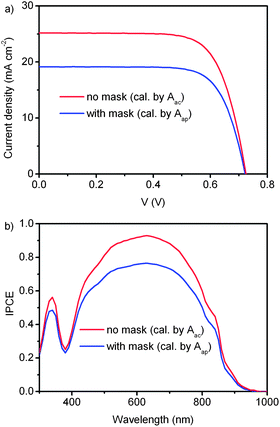 | ||
| Fig. 13 I–V curves and IPCE of DSC measured under AM 1.5 simulated solar light with (blue curve) and without (red curve) shading mask. When using the shading mask, the mask aperture area is the area for the calculation of photocurrent density or IPCE. In case of no shading mask, JSC and IPCE are calculated with the active area of the TiO2 electrode. | ||
As shown in Fig. 12, when a DSC is exposed to the light without any mask, the diffuse light from the transparent glass and reflected light from metal electrode will induce extra incident light. They will be partially incident into TiO2 electrodes from the edges and absorbed by dye molecules. Considering that the effective irradiated area of the solar simulator is generally larger than the active area of TiO2 electrodes, the extra incident light from the edges of the solar cell may result in overestimation of the photocurrent and energy conversion efficiency. A shading mask covering the solar cell would dismiss the extra diffused and reflected light. The power of the total incident light can be quantified by determining the illumination area, i.e. the aperture area, when the irradiance of the solar simulator is known. Therefore the area for calculation of the photocurrent density and efficiency should exactly be equal to the aperture area of the shading mask in the reliable measurement of a DSC.
Although the rules for reliable evaluation of solar cells emphasize the importance of using masks and calculating with the aperture area, some papers suggest using the active area for calculating efficiency when a larger aperture area is used, by which a higher efficiency of test DSC can be obtained. This is obviously contrary to the rules of using the aperture area for measurement and calculation. The obtained higher JSC is interpreted as a result of the special property of DSCs that the diffuse light is important in the generation of photocurrent. However, in the measurement of other solar cells the diffuse light also affects the photocurrent. Table 2 shows the performance of DSCs and thin film micro-crystalline silicon solar cells measured with/without a shading mask and calculated with the aperture area/active area, respectively. The photocurrent and efficiency are all increased when the shading mask is removed to enable the incidence of more diffuse light. But the evaluation of thin film micro-crystalline silicon solar cells still follows the requirements of the standard measurement of solar cells. The evaluation of amorphous Si solar cells is another good example. The performance of an amorphous Si solar cell increases with the increase of temperature and a higher efficiency can be obtained at a higher temperature, but the evaluation of this kind of solar cell still conforms to the standards by setting at 25 °C. In addition, Table 3 shows the efficiency of 5 DSCs fabricated in the same condition which are measured with and without shading mask, respectively. It is obvious that the uncertainty of efficiency measured with the mask and aperture area is much smaller than that obtained without a mask and calculated with the active area. Hence, using aperture area with a mask helps us to obtain reliable results and increase the research efficiency.
| Mask/area | J SC/mA cm−2 | V OC/V | FF | Efficiency/% | |
|---|---|---|---|---|---|
| DSC | N/active | 22.8 | 0.73 | 0.66 | 10.9 |
| Y/aperture | 20.8 | 0.73 | 0.67 | 10.2 | |
| μ c-Si | N/active | 25.7 | 0.52 | 0.70 | 9.3 |
| Y/aperture | 24.5 | 0.52 | 0.70 | 8.9 |
| Mask/area | A | B | C | D | E |
|---|---|---|---|---|---|
| N/active | 11.12 | 11.21 | 11.15 | 11.27 | 11.35 |
| Y/aperture | 10.14 | 10.15 | 10.15 | 10.16 | 10.15 |
The selection of proper size of the aperture area is also important for reliable measurement.12,15 To clarify the effect of aperture area on the DSC performance, we made a series of masks with different aperture areas and measured the corresponding I–V curves on a DSC covered by each of them. As given in Fig. 14, it is obvious that the JSC and VOC are dependent on the ratio of aperture area to the active area of the TiO2 electrode. When the ratio increases from 0.15 to 1.99, JSC decreases from 19.0 mA cm−2 to 9.5 mA cm−2 and VOC increases from 0.67 V to 0.73 V. The uncertainties in the measurement have been raised by selecting different sizes of the aperture area, that could be larger, equal or smaller than the active area.
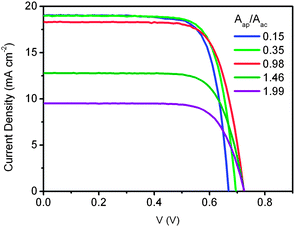 | ||
| Fig. 14 I–V curves of DSC measured under AM 1.5 simulated solar light with different ratios of aperture area (Aap) to TiO2 electrode area (Aac), 0.15 (blue), 0.35 (green), 0.98 (red), 1.46 (olive), and 1.99 (purple). The area for calculation is the aperture area. | ||
Fig. 15 shows more details about the dependence of JSC, VOC, FF and η on aperture area. When covered by a shading mask with an aperture area larger than the active area of TiO2 electrode, the light incident on the surrounding area of TiO2 electrode can be diffused or reflected into active area and contribute to the photocurrent as well as the light directly incident on active area. When the aperture area increases, the photocurrent density will decrease because of the incident light from the surroundings of the active area cannot be absorbed as efficiently as that directly incident on the active area. Conversely, the photocurrent density obtained would be higher by increasing the aperture size if the active area is used in the calculation. The overestimation of device performance is against the regulations that widely applied to solar cells.9,10 When the aperture size is larger than the active area, measurement errors may be induced because the quantification of light diffusion, reflection and absorption in the surrounding area of active TiO2 is complex and the uncertainties cannot be ignored. This indicates that such errors can be reduced if the aperture area of the shading mask is equal to or smaller than the active area.
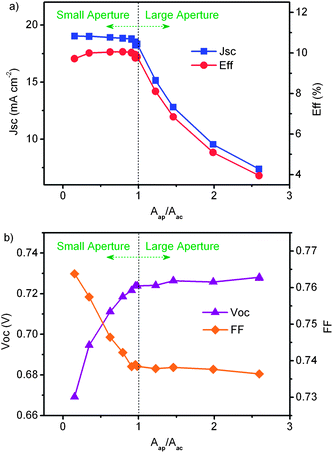 | ||
| Fig. 15 Performance of DSC as a function of the ratio of the aperture area to the active area of TiO2 electrode. The area for calculation is the aperture area. | ||
When considering the shading mask with an aperture area equal or very close to that of the TiO2 electrode, a small variation in the photocurrent density is observed due to the difficulty in finding a mask with a precise size matching the irregular active area of the TiO2 electrode.13 The active area of TiO2 electrodes can be measured by an optical microscope equipped with an image analysis program and a high resolution digital camera. However the edges of the screen-printed TiO2 electrodes are rough and unclear, which can lead to error in determining the active area. As shown in Fig. 16, the black area is a 5.0 mm × 5.0 mm dye-sensitized TiO2 electrode. The irregular edges have a width of about 0.1 mm and occupy about 5% of the total black area. Therefore the effects of irregular edges on the photocurrent density and the total energy conversion efficiency can induce uncertainty in the evaluation of new active materials.
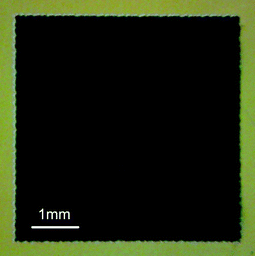 | ||
| Fig. 16 The top view of 5 mm × 5 mm dye sensitized TiO2 electrode by optical microscope. | ||
In the case of an aperture size significantly smaller than the active area of TiO2 electrode, the active area of the illuminated DSC is divided into an illuminated section and a dark section. In the illuminated section, the incident light is partially diffused into the dark section from the scattering layer or the rough surface of the Pt counter electrode. With the decrease of aperture size, the diffuse light has a longer diffusion length in the dark section, which can increase both the light absorption and the photocurrent density (Fig. 15a). According to the modelling of the equivalent circuit for DSCs, the interface of the TiO2/dye/electrolyte behaves as a diode.14,31,32 So, the illuminated section and dark section of active area are equivalent to the parallel connections of an illuminated diode and a dark diode. When the external bias is increased stepwise up to the VOC, the dark current will increase exponentially and the photocurrent generated from the illuminated diode will partially pass through the dark diode. The loss of the photocurrent will cause a fast drop of the net output current at high applied voltage. When the net current equals to zero, the value of the bias is recorded as the VOC, which would be much lower than that measured with a larger aperture area (Fig. 15b). This fast drop of net current at large bias and low VOC will also give a larger FF. Therefore, a mask with significantly smaller aperture area than TiO2 electrode can induce complex processes in a DSC and affect its performance, which may lead to further complications when comparing various works on DSCs.
Considering the above effects of the different aperture area on measured parameters, a shading mask with an aperture size just slightly smaller than the active TiO2 area provides the least measurement errors. Therefore, it is recommended to use such an aperture size in order to obtain the most reliable evaluation of DSCs.
The DSCs’ performance also depends on the cell temperature, which is set at 25 °C in standard measurement by a qualified public test centre.9,10 When a test DSC covered by a shading mask is illuminated, a sufficient amount of heat owing to the light absorption of the shading mask would increase the cell temperature to higher than its surroundings. Previous studies reported the temperature effect on the cell performance and found that the increase of temperature induced a decrease of VOC and an increase of JSC.33–35 To avoid the uncertainties induced by the fluctuation of temperature, it is crucial to perform the measurement at a constant temperature of 25 °C. Fig. 17a shows a sample of package assembled with a test DSC (1 cm × 1 cm), shading mask, water cooling system and temperature monitors. During measurement, the temperature can be controlled with a variation less than 1° at 25 °C. Fig. 17b shows the measurement result in a qualified public test centre. The efficiency is certified to be 10.9% which is obtained by measuring I–V curves in normal scan and calculating with the aperture area. Table 4 shows the samples of measurement results in our own laboratory in recent 6 years as the comparison with those certified by a public test center.4,6,36 The efficiency of our results is almost the same as the certified one with a tiny difference of 0.1%.
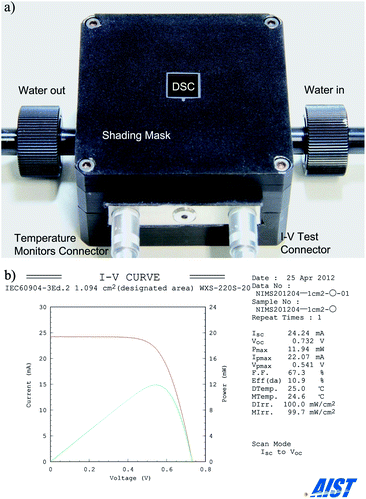 | ||
| Fig. 17 (a) A DSC with a shading mask, a water cooling system and temperature monitors. (b) I–V curve measured independently by the Research Centre for Photovoltaics, AIST. | ||
| Date | J SC/mA cm−2 | V OC/V | FF | Efficiency/% | Aperture area/cm2 | Measured by |
|---|---|---|---|---|---|---|
| 2006.5.27 | 21.11 | 0.727 | 0.727 | 11.2 | 0.219 | SHARP |
| 20.86 | 0.736 | 0.722 | 11.1 | AIST | ||
| 2011.6.22 | 20.88 | 0.743 | 0.727 | 11.3 | 0.231 | NIMS |
| 21.34 | 0.743 | 0.722 | 11.4 | AIST | ||
| 2012.4.25 | 21.81 | 0.724 | 0.684 | 10.8 | 1.094 | NIMS |
| 22.16 | 0.732 | 0.673 | 10.9 | AIST |
Finally, we briefly introduce the evaluation of integrated DSC modules composed of a number of unit cells. In our previous studies, the integrated DSC modules with a large ratio of active area achieved high efficiencies over 8%, certified by a public centre.37,38 The module was measured with a shading mask and the area for calculation of photocurrent density and energy conversion efficiency was the aperture area. Some papers used the active area to determine the performance of the integrated DSC module and got a higher efficiency. However, this cannot be accepted as a reliable measurement owing to its overestimation of JSC induced by the diffuse light from the interval area. So we made 3 modules with the same active area that each consists of 9 unit cells separated by 8 intervals to study the effect of diffuse light (as shown schematically in Fig. 18). The size of unit cell is 5 mm × 50 mm and that of the intervals are 1 mm × 50 mm, 2 mm × 50 mm, and 3 mm × 50 mm, respectively. The aperture sizes are 53 mm × 50 mm, 61 mm × 50 mm, 69 mm × 50 mm, respectively. The ratios of the interval area to the aperture area are 15%, 26%, and 35% respectively. When the area of the intervals between the unit cells increased, as expected the total photocurrent increased because the incident light at the interval area would be diffused or reflected into the active area and then contribute to the photocurrent. However, the photocurrent density and energy conversion efficiency dropped because the increase of the photocurrent is less than that of the aperture area used for the calculations. On the other hand, if the active area of TiO2 electrode was used for evaluation, the photocurrent density and energy conversion efficiency would increase by about 11% with the larger interval area. Considering the large overestimation by using the active area of TiO2 electrode for calculation, the aperture area can provide more reliable results in the evaluation of DSC modules.
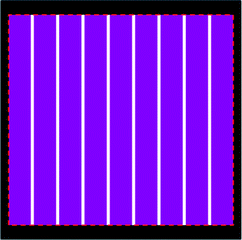 | ||
| Fig. 18 Schematic diagram of DSC module composed of 9 unit cells covered by a shading mask (black area) with a single aperture (rectangle indicated by red dash line). The active area (purple parts) is separated by 8 intervals (white parts). | ||
5. Conclusions
The measured performance of DSC is highly responsive to the external measurement conditions. A reliable evaluation report requires the measurement to be performed under proper conditions and the details of the measurement should be clearly described in the report. A list of proposals for the measurement of DSCs is given below:5.1 Light source
An AM 1.5G solar light simulator should be calibrated by a reference cell, generally a filtered c-Si solar cell, which has a similar IPCE spectrum compared to the test DSC.5.2 Time setting in I–V and IPCE measurement
The delay time of each measurement step should be sufficiently long to allow the test cell to reach its equilibrium state. The equilibrium state can be estimated by measuring the response of transient photocurrent.In I–V characteristics, the normal scan is more preferred than the reverse scan for the latter will easily induce an overestimation. The method of averaging the results obtained by normal and reverse scan is recommended if the delay time and the total measurement time are unfavorably long in the measurement of DSCs with a long equilibrium time. For example, the delay time should be longer than 40 ms when measuring DSCs with organic solvent electrolyte and should be longer than 1000 ms in DSCs with ionic liquid electrolyte.
In the measurement of IPCE, the AC mode with frequency lower than 5 Hz and the DC mode with large photon flux (1016 cm−2 s−1) of the monochromatic light are recommended.
5.3 Area for determination
The test DSC should be covered by a shading mask and be tightly packaged to prevent light incident from the edges. The area used in the determination of photocurrent density and energy conversion efficiency should be the aperture area of the shading mask. The aperture area is recommended to be just slightly smaller than the active area of the TiO2 electrode to minimize uncertainties.5.4 Cell temperature
During the measurement, the cell temperature should be stable at 25 °C with a fluctuation of less than 1 degree. Illuminating test DSCs for a long time before starting measurement is recommended to stabilize the heat generated by light absorption in the cell.5.5 Certification
It is recommended for any report that claims a new record of best energy conversion efficiency in its field to be independently certified by a qualified public test centre.Implementation of these recommendations and clearly describing the measurement details in the final report would be very helpful for the reliable evaluation of DSCs’ performance. It will be more effective to compare and apply new findings reported by different research groups and accelerate the development of dye-sensitized solar cells for the solution of global energy issues.
Acknowledgements
We thank Dr Takeshi Yasuda for the help of providing BHSC. We also thank Mr Naoki Koide (Sharp Corporation), Dr Yoshihiro Hishikawa (AIST), Dr Shufang Zhang, and Dr Noviana Tjitra Salim for many helpful discussions. This research is supported by grants from the International Center for Young Scientists, National Institute for Materials Science, Japan (215113), Japan Society for the Promotion of Science (JSPS KAKENHI, 22760054) and Core Research for Evolutional Science and Technology (CREST) of the Japan Science and Technology Agency.References
- B. O'Regan and M. Grätzel, Nature, 1991, 353, 737–740 CrossRef CAS.
- U. Bach, D. Lupo, P. Comte, J. E. Moser, F. Weissörtel, J. Salbeck, H. Spreitzer and M. Grätzel, Nature, 1998, 395, 583–585 CrossRef CAS.
- M. K. Nazeeruddin, A. Kay, I. Rodicio, R. Humphry-Baker, E. Müller, P. Liska, N. Vlachopoulos and M. Grätzel, J. Am. Chem. Soc., 1993, 115, 6382–6390 CrossRef CAS.
- Y. Chiba, A. Islam, Y. Watanabe, R. Komiya, N. Koide and L. Han, Jpn. J. Appl. Phys., 2006, 45, L638–L640 CrossRef CAS.
- A. Yella, H.-W. Lee, H. N. Tsao, C. Yi, A. K. Chandiran, M. K. Nazeeruddin, E. W.-G. Diau, C.-Y. Yeh, S. M. Zakeeruddin and M. Grätzel, Science, 2011, 334, 629–634 CrossRef CAS.
- L. Han, A. Islam, H. Chen, C. Malapaka, B. Chiranjeevi, S. Zhang, X. Yang and M. Yanagida, Energy Environ. Sci., 2012, 5, 6057–6060 CAS.
- S. Ardo and G. J. Meyer, Chem. Soc. Rev., 2009, 38, 115–164 RSC.
- A. Hagfeldt, G. Boschloo, L. Sun, L. Kloo and H. Pettersson, Chem. Rev., 2010, 110, 6595–6663 CrossRef CAS.
- M. A. Green, K. Emery, Y. Hishikawa, W. Warta and E. D. Dunlop, Prog. Photovoltaics, 2011, 19, 565–572 Search PubMed.
- M. A. Green, K. Emery, Y. Hishikawa, W. Warta and E. D. Dunlop, Prog. Photovoltaics, 2012, 20, 12–20 Search PubMed.
- H. J. Snaith, Energy Environ. Sci., 2012, 5, 6513–6520 Search PubMed.
- N. Koide and L. Han, Rev. Sci. Instrum., 2004, 75, 2828–2831 CrossRef CAS.
- N. Koide, Y. Chiba and L. Han, Jpn. J. Appl. Phys., 2005, 44, 4176–4181 CrossRef CAS.
- L. Han, N. Koide, Y. Chiba and T. Mitate, Appl. Phys. Lett., 2004, 84, 2433–2435 CrossRef CAS.
- S. Ito, M. K. Nazeeruddin, P. Liska, P. Comte, R. Charvet, P. Péchy, M. Jirousek, A. Kay, S. M. Zakeeruddin and M. Grätzel, Progr. Photovolt.: Res. Appl., 2006, 14, 589–601 CrossRef CAS.
- S. Ito, H. Matsui, K. Okada, S. Kusano, T. Kitamura, Y. Wada and S. Yanagida, Sol. Energy Mater. Sol. Cells, 2004, 82, 421–429 CrossRef CAS.
- V. Shrotriya, G. Li, Y. Yao, T. Moriarty, K. Emery and Y. Yang, Adv. Funct. Mater., 2006, 16, 2016–2023 CrossRef CAS.
- M. K. Nazeeruddin, F. D. Angelis, S. Fantacci, A. Selloni, G. Viscardi, P. Liska, S. Ito, B. Takeru and M. Grätzel, J. Am. Chem. Soc., 2005, 127, 16835–16847 CrossRef CAS.
- Z.-S. Wang, H. Kawauchi, T. Kashima and H. Arakawa, Coord. Chem. Rev., 2004, 248, 1381–1389 CrossRef CAS.
- M. K. Nazeeruddin, P. Péchy, T. Renouard, S. M. Zakeeruddin, R. Humphry-Baker, P. Comte, P. Liska, L. Cevey, E. Costa, V. Shklover, L. Spiccia, G. B. Deacon, C. A. Bignozzi and M. Grätzel, J. Am. Chem. Soc., 2001, 123, 1613–1624 CrossRef CAS.
- K. Emery, C. R. Osterwald, T. W. Cannon, D. R. Myers, J. Burdick, T. Glatfelter, W. Czubatyj and J. Yang, in Proc. 18th IEEE Photovoltaic Specialist Conf., IEEE, 1985, pp. 623–628 Search PubMed.
- C. R. Osterwald, Sol. Cells, 1986, 18, 269–279 CrossRef CAS.
- Japanese Industrial Standard, JIS C 8913, 1998; Japanese Industrial Standard, JIS C 8934, 1995.
- P. Wang, S. M. Zakeeruddin, P. Comte, I. Exnar and M. Grätzel, J. Am. Chem. Soc., 2003, 125, 1166–1167 CrossRef CAS.
- P. Wang, S. M. Zakeeruddin, J.-E. Moser and M. Grätzel, J. Phys. Chem. B, 2003, 107, 13280–13285 CrossRef CAS.
- M. Gorlov and L. Kloo, Dalton Trans., 2008, 2655–2666 RSC.
- S. Zhang, X. Yang, K. Zhang, H. Chen, M. Yanagida and L. Han, Phys. Chem. Chem. Phys., 2011, 13, 19310–19313 RSC.
- K. Lobato, L. M. Peter and U. Würfel, J. Phys. Chem. B, 2006, 110, 16201–16204 CrossRef CAS.
- S.-J. Moon, J.-H. Yum, R. Humphry-Baker, K. M. Karlsson, D. P. Hagberg, T. Marinado, A. Hagfeldt, L. Sun, M. Grätzel and M. K. Nazeeruddin, J. Phys. Chem. C, 2009, 113, 16816–16820 CAS.
- S.-J. Moon, Y. Itzhaik, J.-H. Yum, S. M. Zakeeruddin, G. Hodes and M. Grätzel, J. Phys. Chem. Lett., 2010, 1, 1524–1527 CrossRef CAS.
- Y. Liu, A. Hagfeldt, X.-R. Xiao and S.-E. Lindquist, Sol. Energy Mater. Sol. Cells, 1998, 55, 267–281 CrossRef CAS.
- J. Bisquert and I. Mora-Seró, J. Phys. Chem. Lett., 2010, 1, 450–456 CrossRef CAS.
- Y. M. Cao, Y. Bai, Q. J. Yu, Y. M. Cheng, S. Liu, D. Shi, F. F. Gao and P. Wang, J. Phys. Chem. C, 2009, 113, 6290–6297 CAS.
- G. Kron, T. Egerter, G. Nelles, A. Yasuda, J. H. Werner and U. Rau, Thin Solid Films, 2002, 403–404, 242–246 CrossRef CAS.
- H. J. Snaith, L. Schmidt-Mende, M. Grätzel and M. Chiesa, Phys. Rev. B: Condens. Matter Mater. Phys., 2006, 74, 45306 CrossRef.
- Y. Chiba, A. Islam, R. Komiya, N. Koide and L. Han, Appl. Phys. Lett., 2006, 88, 223505 CrossRef.
- L. Han, A. Fukui, Y. Chiba, A. Islam, R. Komiya, N. Fuke, N. Koide, R. Yamanaka and M. Shimizu, Appl. Phys. Lett., 2009, 94, 13305 CrossRef.
- A. Fukui, N. Fuke, R. Komiya, N. Koide, R. Yamanaka, H. Katayama and L. Han, Appl. Phys. Express, 2009, 2, 082202 CrossRef.
| This journal is © The Royal Society of Chemistry 2013 |
