Deactivation mechanism of Ce/TiO2 selective catalytic reduction catalysts by the loading of sodium and calcium salts
Haiqiang
Wang
a,
Xiongbo
Chen
ab,
Shan
Gao
a,
Zhongbiao
Wu
*ac,
Yue
Liu
a and
Xiaole
Weng
a
aDepartment of Environment Engineering, Zhejiang University, Yuhangtang Road 866, Hangzhou 310058, P. R. China. E-mail: zbwu@zju.edu.cn; Tel: +86 571 8795 3088; Fax: +86 571 8795 3088
bSouth China Institute of Environmental Sciences, Ministry of Environmental Protection, Guangzhou 510655, P. R. China
cZhejiang Provincial Engineering Research Center of Industrial Boiler & Furnace Flue Gas Pollution Control, Hangzhou 311202, P. R. China
First published on 26th October 2012
Abstract
In this paper, the poisoning effect of alkali and alkaline earth metal on Ce/TiO2 catalysts was investigated for the first time and a deactivation mechanism was proposed. The Ce/TiO2 catalyst was observed to be deactivated seriously by the loading of Na+, K+ or Ca2+ ions. When the Na/Ce, K/Ce or Ca/Ce molar ratio exceeded 0.25, NO conversion of the Ce/TiO2 catalyst at 380 °C decreased from 78% to negligibly low. After subjecting it to a range of analytical techniques, including X-ray diffraction (XRD), X-ray photoelectron spectroscopy (XPS), transmission electron microscopy (TEM), Raman spectra etc., it was found that amorphous ceria was dominant in the Ce/TiO2 sample, and would change to ceria crystals with the loading of Na+ or Ca2+ ions, leading to a poor dispersion of ceria on the surface of TiO2 as well as the transformation of Ce3+ to Ce4+. Both of these led directly to the disappearance of oxygen vacancies in the ceria particles, slowing down the reduction rate of ceria and hence decreasing its rate of oxidation/reduction recycle. We proposed that the enlargement of ceria nanoparticles, the reduced Ce4+/Ce3+ redox cycle rate and the change in the surface acidity could be the three major factors contributing to the decline of selective catalytic reduction (SCR) activity of the Ce/TiO2 catalyst after loading with Na+ or Ca2+ ions.
1. Introduction
The SCR of NOx with ammonia has proven to be a reliable process for eliminating NOx from stationary sources. Commercial vanadia-based SCR catalysts have shown excellent catalytic activity within the temperature range of 300–400 °C,1–3 but the following drawbacks still remain: the toxicity of vanadium pentoxide to the environment; the over-oxidation of NH3 (leading to the formation of N2O in high temperature ranges); the high oxidation activity of SO2 to SO3 with increasing amounts of vanadium; and deactivation by loading of alkali and alkaline earth metal salts in the ashes.4–7 Furthermore, with the wide usage of second-generation biofuels, catalyst deterioration from inorganic impurities like alkali compounds has gained more and more attention.8–10 Due to these drawbacks, many researchers have sought to develop non-vanadia SCR catalysts with promising performance and non-toxicity to the environment, such as Ce/TiO2, Fe-ZSM-5, Cu-ZSM-5, FexTiOy, CeO2/Al2O3, and others.11–19Ceria had remarkable redox and oxygen storage capabilities, and has attracted much attention in recent years. R. Q. Long et al. developed a superior Fe-ZSM-5 catalyst, which showed remarkably NH3-SCR performance with the addition of ceria.13 In this catalyst, ceria plays a stabilization role and could lower the activity for SO2 oxidation to SO3. W. Xu et al. reported that Ce/TiO2 catalysts had high activity in the temperature range of 275–400 °C and showed an excellent selectivity to N2.20 Moreover, L. Chen et al. found that the addition of tungsten could enhance the catalytic activity of Ce/TiO2 catalysts for NH3-SCR.21,22 Ce-based catalysts are environmentally friendly and may be promising candidates for NH3-SCR in the future, but further work on investigating the influence of alkali and alkaline earth metals is still in demand.
For vanadia-based catalysts, it is generally accepted that alkali and alkaline earth metal salts (mainly Na, K, Ca, Mg) could decrease the acidity and might partially react with V2O5,4–7,23,24 leading to deactivation of the SCR activity. When P or S coexists with these alkaline metals, pore condensation25 or pore blocking26 takes place as a major deactivation mechanism. For Fe-zeolite catalysts, it is reported that reduced acidity and ammonia storage capacity contributed to the observed deactivation by alkaline metals.27,28 Additionally, some other transition metals, e.g. Fe and Cu, supported on traditional TiO2 and ZrO2 carriers were also deactivated seriously in alkali containing flue gases, which was ascribed to the reduction in acidity.29 However, the performance of Ce/TiO2 catalysts in SCR reactions with loading by alkali metal salts or alkali earth metal salts, and the interaction between ceria and these poisons, is still unknown. The poisoning effect of Na+ or Ca2+ ions on the Ce/TiO2 catalysts was therefore investigated in this study. The main purpose of this work is to explore the substantial changes in the Ce/TiO2 catalysts caused by the loading of Na+ or Ca2+ ions and to clarify their deactivation mechanism.
2. Experimental
2.1 Catalyst preparation
The commercial titania nanoparticle-P25 (Degussa, Germany) was used as the catalyst support. The doping of cerium to P25 was conducted by wet impregnation method.30 The P25 nanoparticles were firstly mixed with the required amount of cerium nitrate solution (Ce/Ti mole ratio at 1![[thin space (1/6-em)]](https://www.rsc.org/images/entities/char_2009.gif) :19), which was then stirred for 6 h, dried at 80 °C for 18 h and calcined at 450 °C for 3 h to obtain the final ceria loaded catalysts for further analysis and preparation (denoted as Ce/Ti).
:19), which was then stirred for 6 h, dried at 80 °C for 18 h and calcined at 450 °C for 3 h to obtain the final ceria loaded catalysts for further analysis and preparation (denoted as Ce/Ti).
The sodium loaded Ce/Ti catalysts with different molar ratio of Na/Ce at x (denoted as Na-Ce/Ti-x) were prepared by impregnating the Ce/Ti catalysts in sodium nitrate solution of the required concentration. Thereafter, the mixture was stirred for 6 h, dried at 80 °C for 18 h and calcined at 450 °C for 3 h. The Ca2+ ion loaded Ce/Ti catalysts (denoted as Ca-Ce/Ti-x) and K+ ion loaded Ce/Ti catalysts (denoted as K-Ce/Ti-x) were prepared following an identical process to that of Na-Ce/Ti catalysts.
2.2 Catalyst characterization
The crystal phases of the catalysts were analyzed by using XRD (model D/max RA, Rigaku Co., Japan; Cu Kα radiation, 0.15418 nm). The data were collected for scattering angles (2θ) ranging between 10 and 80° with a step size of 0.02°. X-ray photoelectron spectroscopy with Al Kα X-ray (hν = 1486.6 eV) radiation operated at 150 W (XPS: Thermo ESCALAB 250, USA) was used to investigate the surface properties of the catalyst. The shift of the binding energy due to relative surface charging was corrected using the C 1 s level at 284.8 eV as an internal standard. The morphology, structure and grain size of the catalysts were investigated using a model Tecnai G2 F20 S-TWIN (FEI Company, USA) high-resolution TEM (HR-TEM, 400 kV accelerating voltage) instrument equipped with STEM (scanning transmission electron microscopy), EDX (energy dispersive X-ray spectroscopy) and HAADF (high-angle annular dark-field, standard configurations). Raman spectra were recorded at room temperature using a micro-Raman spectrometer (Raman: RAMANLOG 6, USA) with a 514.5 nm Ar+ laser as the excitation source in a backscattering geometry. The laser power incident on the catalysts was less than 10 mW. The time of acquisition was varied according to the intensity of the Raman scattering. Temperature programmed reduction (TPR) and temperature programmed desorption (TPD) were carried out on a custom-made TCD (thermal conductivity detector) setup using 50 mg catalysts. Prior to the TPR experiments, catalysts were pre-treated in pure N2 at 400 °C for 1 h. TPR runs were carried out with the linear heating rate (10 °C min−1) in pure N2 containing 6% H2 at a flow rate of 30 ml min−1. For NH3-TPD experiments, after pre-treating in He at 400 °C for 1 h, catalysts were saturated with anhydrous NH3 (4% in He) at a flow rate of 30 ml min−1 for about 30 min. Desorption was carried out by heating the catalyst in He (30 ml min−1) from 70 to 400 °C with a heating rate of 10 °C min−1. Both for TPD and TPR, a preheat treatment at 70 °C for 1 h was performed before the temperature raising process.2.3 SCR activity measurements
SCR of NO with NH3 was carried out in a fixed-bed reactor. The experiments were performed under atmospheric pressure at 200–470 °C. The reactor consisted of a quartz tube of 1 cm diameter which was filled with 0.5 g of catalyst. A type K thermocouple was placed at the centre of the bed for temperature measurements. The typical reactant gas composition was as follows: 600 ppm NO, 600 ppm NH3, 3.5% O2 and the balance N2. The gas hourly space velocity (GHSV) was about 100000 h−1 for this system. NO, NO2, N2O and O2 concentration were monitored by an infrared gas analyser which was affiliated with an O2 sensor (Photon II Madur Electronics, Austria). NH3 was detected by a Fourier transform infrared (FT-IR) gas analyzer (ALPHA-GFT-IR, Bruker Optics, Germany). The catalysts were evaluated for their activity toward NO reduction and NH3 oxidation (performed in the absence of NO).
NO conversion was calculated according to the following equations:
| NO conversion % = ([NOx]in − [NOx]out)/[NOx]in × 100 | (1) |
| k = −ln(1 − X) × Fgas ÷ mcat | (2) |
3. Results and discussion
3.1 SCR activity test
Fig. 1 shows NO conversion as a function of reaction temperature over the Ce/Ti catalysts with different Na+ or Ca2+ loading. The Ce/Ti catalyst had a good catalytic performance in the temperature range of 300–400 °C, which is in accord with previous reports.20–22 However, the NO conversion of Na-Ce/Ti catalysts decreased very fast with increasing Na/Ce molar ratio. The NO conversion of Ca-Ce/Ti-0.25 catalysts at 380 °C was only 22%. In addition, when Na/Ce molar ratio exceeded 0.25, NO conversion at 380 °C decrease from 78% to negligibly low. Similarly, the NO conversion of Ca-Ce/Ti catalysts at 380 °C decreased to only 40% when the Ca/Ce molar ratio was 0.25. As the Ca/Ce molar ratio further increased, the NO conversion of Ca-Ce/Ti catalyst approached zero. The decrease in NO conversion for K-Ce/Ti series seemed smaller than that of Na-Ce/Ti or Ca-Ce/Ti series, but serious deactivation could still be observed when the molar ratio of K/Ce exceeded 0.25.![Variation of NO conversion with reaction temperature over the catalysts. Reaction conditions: [NO] = [NH3] = 600 ppm, [O2] = 3.5%, balance N2, catalyst 0.5 g, and GHSV about 100 000 h−1.](/image/article/2013/CY/c2cy20568h/c2cy20568h-f1.gif) | ||
| Fig. 1 Variation of NO conversion with reaction temperature over the catalysts. Reaction conditions: [NO] = [NH3] = 600 ppm, [O2] = 3.5%, balance N2, catalyst 0.5 g, and GHSV about 100000 h−1. | ||
The observed catalyst activity constant, k, as a function of Na+, K+ or Ca2+ loading is presented in Fig. 2. It can be seen that k on the Na+-Ce/Ti catalysts decreased very sharply from 88 to 15 cm−3 g−1 s−1 after loading Na+ with Na/Ce molar ratio at 0.25. In comparison, with the same loading of K+ or Ca2+, k on K+-Ce/Ti and Ca2+-Ce/Ti catalysts decreased to 37 and 25 cm−3 g−1 s−1, respectively. Further increasing of the loading of these three poisons resulted in a very low value of k.
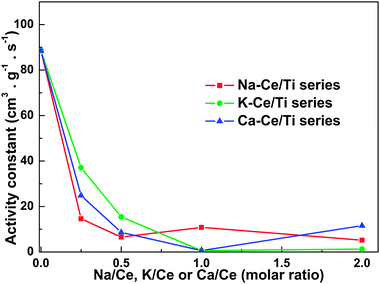 | ||
| Fig. 2 Observed catalyst activity constant k at 350 °C for CeO2/TiO2 catalysts with different loading of Na, K or Ca. | ||
During SCR activity tests, N2O was not detected over either fresh or poisoned catalysts, which indicated the excellent N2 selectivity of ceria catalysts. In addition, NH3 oxidation tests were performed under the same reaction conditions, but without NO in the mixed gas. Under these conditions, ammonia can be oxidized into N2 and NOx.2 The formation of NOx was favoured with respect to that of N2 at higher temperatures, while the reverse was true at lower temperatures.2 The results shown in Fig. 3 demonstrate that little NH3 was oxidised into NOx over these catalysts below 300 °C, whereas above 300 °C, the production of NOx increased to some extent.
![[NOx]out/[NH3]in for NH3 oxidation. Reaction conditions: [NH3] = 600 ppm, [O2] = 3.5%, balance N2, catalyst 0.5 g.](/image/article/2013/CY/c2cy20568h/c2cy20568h-f3.gif) | ||
| Fig. 3 [NOx]out/[NH3]in for NH3 oxidation. Reaction conditions: [NH3] = 600 ppm, [O2] = 3.5%, balance N2, catalyst 0.5 g. | ||
The above results suggest that the addition of Na+, K+ or Ca2+ ions could seriously poison the CeO2/TiO2 catalysts for the SCR of NO by NH3. Na+ and Ca2+ exhibited greater poisoning effect than K+ ions, which was different from vanadia catalysts. In the case of vanadia catalysts, the strength of the poisoning effect for Na+, K+ and Ca2+ was directly related to their basicity.31 This suggested some other changes besides acidity occur on CeO2/TiO2 catalysts after loading of poisons.
3.2 Structure and morphology
The XRD patterns of the fresh and poisoned Ce/Ti catalysts are shown in Fig. 4. The XRD peaks belonging to the anatase (PDF-#21-1272) phase (at 2θ = 25.28°, 37.80°, 48.05°, 53.89°, 55.06° and 62.69°) and rutile (PDF-#21-1276) phase (at 2θ = 27.45°, 36.09° and 54.32°) were clearly observed in all the catalysts. The intensities of the characteristic peaks (at 2θ = 28.55°, 33.08°, 47.48° and 56.33°) of cerianite [PDF#34-0394] were negligibly small on the Ce/Ti catalyst, with the strongest peak locating at 28.55°. However, the cerianite peaks became obvious after the Na+ or Ca2+ doping and the peak intensities increased with the loading of Na+ or Ca2+. Theoretically, the weight percent of CeOx on the Ce/Ti catalyst was calculated as ca. 10% (Ce/Ti molar ratio = 1:19), which was above the detection limit of XRD spectra. As such, the obvious change of cerianite peaks after the addition of Na+ or Ca2+ suggested that amorphous ceria, existing as small nanoparticles, was the dominant component in the fresh Ce/Ti catalyst, but transformed to the crystalline form in the poisoned catalysts.
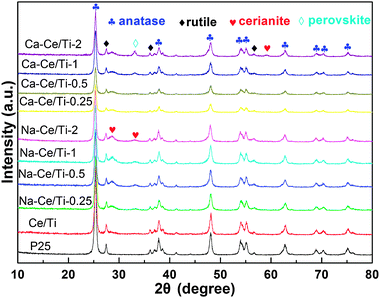 | ||
| Fig. 4 Powder XRD patterns of Ce/Ti catalysts with different loading of alkali metals. | ||
Table 1 shows the particle size of CeO2 and anatase which was calculated using the Scherrer equation. It can be seen that CeO2 grain size increased with the content of Na or Ca, which revealed the improved growth of ceria crystals. It is well known that lattice defects increase with the decrease of ceria particle size.32,33 With the particle size decreasing from 20 nm to 3 nm, the surface defects surprisingly changed by two orders of magnitude.34 This means the defects on the surface of ceria/titania catalyst decreased sharply with the increasing of Na or Ca loading, which will be further discussed in Section 3.3. However, the grain size of anatase for Ce/Ti only increased a little, indicating the relatively stable structure of the titania carrier.
| Sample | CeO2 grain size calculated by [111] plane (nm) | Anatase grain size calculated by [101] plane (nm) |
|---|---|---|
| Na-Ce/Ti-2 | 8 | 19.0 |
| Na-Ce/Ti-1 | 7.4 | 18.9 |
| Na-Ce/Ti-0.5 | 7.2 | 18.7 |
| Na-Ce/Ti-0.25 | 6.2 | 18.6 |
| Ce/Ti | — | 18.5 |
| P25 | — | 17.7 |
| Ca-Ce/Ti-0.25 | 6.9 | 18.7 |
| Ca-Ce/Ti-0. 5 | 7.1 | 18.6 |
| Ca-Ce/Ti-1 | 7.1 | 18.7 |
| Ca-Ce/Ti-2 | 7.7 | 18.8 |
Notably, peaks belonging to Na-containing compounds were not observed while those belonging to Ca-containing compounds appeared. Once the molar ratio of Ca/Ce reached 2, the characteristic peaks of perovskite (PDF-#42-0423), around 33.11°, became obvious. This peak was located very close to one of the cerianite peak at 33.08°. These two peaks overlaid and led to a significant increasing of peak intensity, which became even greater than the major peak of cerianite at 28.55°.
Raman spectroscopy also provided valuable information about the phase composition, crystallinity, crystallite size, and defect concentration of the catalysts. Fig. 5 shows the Raman spectra of P25, Ce/Ti, Na-Ce/Ti-1 and Ca-Ce/Ti-1 catalysts. The observed peaks at 139 cm−1, 194 cm−1, 512 cm−1 and 635 cm−1 in the spectra of the catalysts were the typical characteristic peaks of anatase phase,35,36 which suggested that the anatase phase TiO2 was the predominant component. The peak at 458 cm−1, which is characteristic of the cerianite phase,37,38 was observed in the Na-Ce/Ti-1 and Ca-Ce/Ti-1 catalysts. In contract, this peak was not found in the Ce/Ti catalyst. These results confirm that amorphous ceria was the predominant phase of ceria in the Ce/Ti catalyst. Furthermore, the loading of Na+ or Ca2+ ions could promote the crystallization of cerianite, which led to the transformation of amorphous ceria to cerianite. Raman spectroscopy results were consistent with the XRD results.
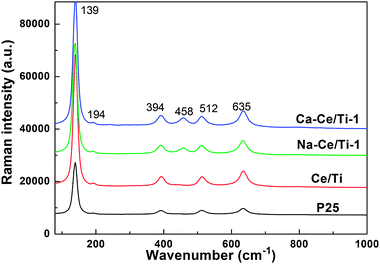 | ||
| Fig. 5 Raman spectra of P25, Ce/Ti, Na-Ce/Ti-1 and Ca-Ce/Ti-1 catalysts. | ||
The morphology, structure and particle size of the catalysts were further observed by TEM. As shown in Fig. 6(a), an extremely small number of CeO2 particles were observed in the Ce/Ti catalyst. The ratio of CeO2 particles to TiO2 particles was calculated to be ca. 6:100. The average diameter of CeO2 particles was about 5.1 nm. However, both the size and number of CeO2 particles increased after the loading of Na+ (Fig. 6(b)), when the ratio of CeO2 particles to TiO2 particles was calculated to be ca. 70:100. The average diameter of CeO2 particles was about 5.6 nm. The STEM images inserted in the bottom-right corner of Fig. 6(a) and (b) also show the comparatively larger CeO2 particles after Na+ was added. Fig. 6(c) shows high-magnification TEM images of the Na-Ce/Ti-1 catalyst. The interplanar fringe spacings of 0.32 and 0.31 nm with a cross angle of 109° represent lattice spacings of the [1 1 1] and [1 −1 −1] planes of CeO2, respectively.39,40 The obvious difference in the number of crystalline CeO2 particles between fresh and Na+ deposited Ce/Ti catalyst further confirmed the improved crystallization of ceria after the loading of Na+, which was accompanied by the transformation of amorphous ceria to crystalline ceria. Moreover, this phase transformation led to the aggregation of CeO2 after loading of Na+. This could be deduced from the increase of both the size and the number of CeO2 particles. The TEM results were in agreement with the XRD and Raman investigations. In fact, the decrease in amorphous ceria as a result of structural transformation meant that the dispersion of ceria could become worse after Na+ addition. Additionally, the Ca-Ce/Ti-1 catalysts showed a similar morphology to that of the Na-Ce/Ti-1 catalysts (not shown).
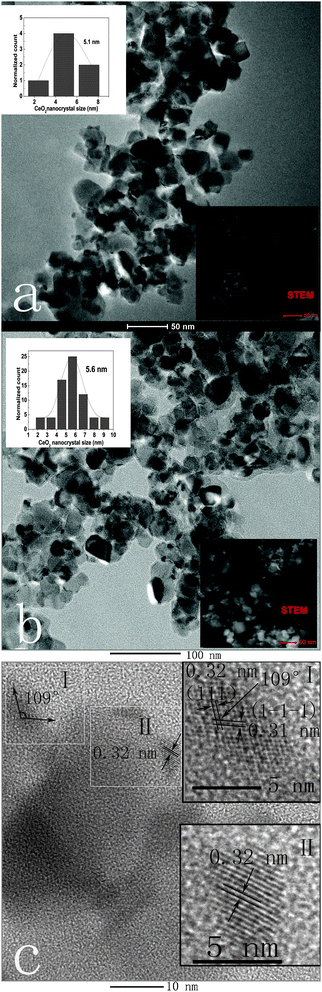 | ||
| Fig. 6 TEM images of Ce/Ti catalyst (a) and Na-Ce/Ti-1 catalyst (b); HR-TEM of Na-Ce/Ti-1 catalyst (c). | ||
3.3 Surface species
Catalysts were further analyzed using XPS to identify their surface nature and element concentration. Table 2 shows that the molar ratio of Ce/Ti decreased from 0.16 to 0.13 after the loading of Na+ with Na/Ce molar ratio of 1, which reveals that the surface concentration of cerium decreased after the loading of Na+. Similarly, the molar ratio of Ce/Ti decreased from 0.16 to 0.12 after loading of Ca2+. XRD, Raman and TEM investigations confirm that amorphous ceria transformed to crystalline ceria and the crystallinity of ceria improved after loading of Na+ or Ca2+. Considering the decrease in surface concentration of the cerium, it could be deduced that the dispersion of ceria on the surface of TiO2 worsened after loading of Na+/Ca2+.| Name | Ce/Ti (%) | Na-Ce/Ti-1(%) | Ca-Ce/Ti-1(%) |
|---|---|---|---|
| O 1s | 73.85 | 72.92 | 74.37 |
| Ti 2p | 22.53 | 23.91 | 22.86 |
| Ce 3d | 3.62 | 3.17 | 2.78 |
| Ce/Ti | 0.16 | 0.13 | 0.12 |
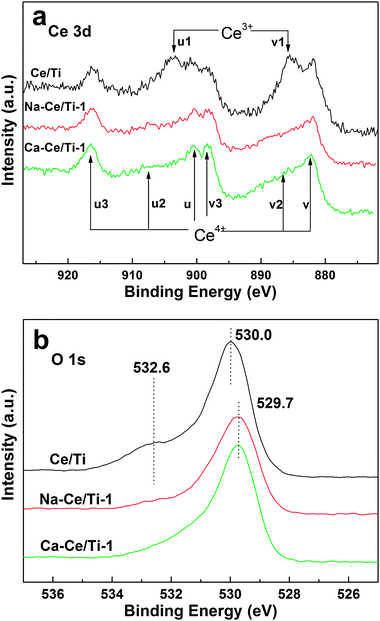
The XPS spectra of Ce 3d over Ce/Ti, Na-Ce/Ti-1 and Ca-Ce/Ti-1 catalysts are shown in Fig. 7a. The peaks labeled as u, u2, u3, v, v2 and v3 represented the 3d104f0 state of Ce4+ species, while those labeled as u1 and v1 represented the 3d104f1 initial electronic state corresponding to Ce3+ species.41,42 In the Ce/Ti catalyst, Ce3+ and Ce4+ coexisted. It is widely accepted that the presence of Ce3+ species could create a charge imbalance and form oxygen vacancies and unsaturated chemical bonds, which will lead to an increase of chemisorbed oxygen on the catalyst surface.41,42 However, in the case of Na-Ce/Ti-1 and Ca-Ce/Ti-1 catalysts, the u1 and v1 peaks belonging to Ce3+ almost disappear, whereas the u, v and v3 peaks belonging to Ce4+ are slightly enhanced. These results suggest that the Ce4+ species were dominated on the surface of Na-Ce/Ti-1 and Ca-Ce/Ti-1 catalysts. Since the Ce3+ came from the ceria defects, the amount of which would decrease once the particle size increased,32,33,43 the XPS results imply that alkali metal salts or alkali earth metal salts could be beneficial to the crystallization of ceria nanoparticles, but harmful to the maintenance of ceria defects and Ce3+, which will be further discussed in the following sections.
 | ||
| Fig. 7 XPS spectra of two catalysts (a) Ce 3d; (b) O 1s. | ||
Fig. 7b shows the O 1 s XPS spectra of the Ce/Ti, Na-Ce/Ti-1 and Ca-Ce/Ti-1 catalysts. Generally, the surface oxygen was classified as two types: the lattice oxygen (OI) and the chemisorbed oxygen (OII).44–46 The chemisorbed oxygen was very active and played an important role in the catalytic reaction.44–46 Furthermore, the oxygen in the gas or in the molecules absorbed on the catalysts could easily exchange with the chemisorbed oxygen. As shown in Fig. 7b, two peaks at 530.0 eV and 532.6 eV were observed on the Ce/Ti catalyst, which could be attributed to the OI type (529.0–530.0 eV) and OII type (531.0–532.0 eV) oxygen on catalyst surface.44–46 In contrast, for the Na-Ce/Ti-1 and Ca-Ce/Ti-1 catalysts, only one oxygen peak (529.7 eV), which belonged to lattice oxygen, was observed. This meant that chemisorbed oxygen was absent from the catalyst surface after the loading of Na+ or Ca2+. Moreover, the binding energy of the lattice oxygen tended to shift slightly towards a lower binding energy (approximately 0.3 eV) after loading of Na+ or Ca2+. This shift was coherent with the conversion of Ce3+ species into Ce4+ species, in good agreement with the previous literature.44–46
3.4 Surface acidity
Previous reports focusing on the alkaline poisoning of the deNOx catalysts attribute the alkaline deactivation to the decrease of both number and strength of the acid sites, which could be explained by the remarkably low NH3-adsorption.23,24 The adsorption capacity of NH3 on ceria catalysts was also investigated by NH3-TPD tests. Fig. 8 presents the NH3-TPD profiles of the fresh, sodium and calcium containing catalysts, obtained in the range 70–500 °C. One continuous peak lasting from 100 °C to 400 °C was observed in the profile of the Ce/Ti catalyst, indicating the presence of adsorbed ammonia species on the surface. Notably, the intensity of this desorption peak (only 3 a.u.) was much weaker than those of other SCR catalysts. This indicated ceria could only generate weak acid sites,47 and most probably existed as a Lewis acid according to previous reports.48 With the addition of calcium and sodium, this peak decreased significantly, suggesting that the poisoning elements strongly affected the adsorption of NH3. The calculated peak area for Ce/Ti, Ca-Ce/Ti-1 and Na-Ce/Ti-1 were 280.1, 172.5 and 64.8 respectively, which meant the adsorption capability decreased by 38% with the addition of calcium and decreased more dramatically, by 77%, with the addition of sodium. The difference in the drop in ammonia adsorption capacity with the addition of different poisoning elements is in agreement with the differing alkalinity of the additives. Though the surface acidity of Ca-Ce/Ti-1 and Na-Ce/Ti-1 decreased by different amounts, the catalytic activity for the SCR of NO of both became negligibly low. These results indicate that the surface acidity affected the SCR activity of ceria catalysts, but these are not linearly related.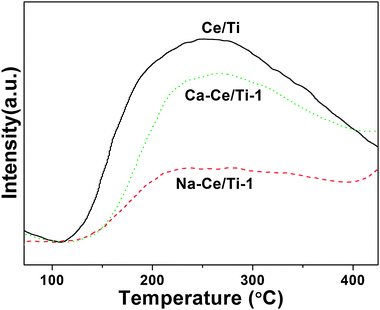 | ||
| Fig. 8 NH3-TPD profiles over the Ce/Ti, Na-Ce/Ti and Ca-Ce/Ti catalysts. | ||
3.5 Reducibility of cerium species
In order to investigate the effect of Na+ and Ca2+ doping on the reduction behaviors of the dispersed cerium species, H2-TPR profiles of the Ce/Ti, Na-Ce/Ti-1 and Ca-Ce/Ti-1 catalysts are presented in Fig. 9. It is generally accepted that the reduction of ceria occurs first on the surface in the low temperature range and then progressively affects the bulk in the high temperature range.49,50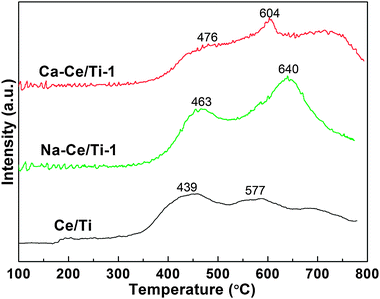 | ||
| Fig. 9 H2-TPR profiles over various catalysts. | ||
In the case of the Ce/Ti catalyst, a H2 consumption peak at around 439 °C could be observed, corresponding to the reduction of surface oxygen. Based on the results of XRD, TEM and XPS analyses, this peak could be ascribed to the reduction of amorphous CeO2 on the surface of TiO2. In addition, an insignificant peak around 577 °C appeared, corresponding to the reduction of bulk CeO2.
The profile of the Na-Ce/Ti-1 catalyst contains two reduction peaks, that is, the peak at around 463 °C and the peak at around 640 °C. The former peak was assigned to the reduction of surface CeO2 and the latter peak was attributed to the reduction of bulk CeO2. XRD, XPS and TEM investigations have revealed that crystallized ceria was the predominant state of ceria in the Na-Ce/Ti-1 catalyst. Thus, the reduction peak around 640 °C could be attributed to the total reduction of ceria, forming Ce2O3. Similarly to the Na-Ce/Ti-1 catalyst, the Ca-Ce/Ti-1 catalyst also exhibited two peaks at around 476 and 604 °C. B. H. Davis found that bulk CeO2 reduction is greatly facilitated by Ca-doping.51 Indeed, the Ca-Ce/Ti-1 catalyst showed a much sharper reduction peak of bulk CeO2 than the Ce/Ti catalyst. However, this peak intensity was lower than that of the Na-Ce/Ti-1 catalyst, which indicated that Na-loading could be a better promoter of bulk ceria reduction than Ca-loading.
It is important to note that the two poisoned catalysts both showed higher reduction temperatures. The shifting in the reduction temperatures indicated that the addition of Na+ and Ca2+ could lead to a stabilization of cerium species and result in them becoming less reducible. It can be concluded that the amorphous ceria was more active than the crystalline ceria. This could be contributed to the high NH3-SCR activity in the temperature range of 275–400 °C over the Ce/Ti catalyst.
3.6 Discussion and proposed deactivation mechanism
As is already well known, the remarkable redox property and oxygen storage capability of ceria played the most important role in the catalysis reactions. In fact, the actual catalytic activity was controlled by not only the oxygen storage capability, but also the rates of the redox cycles. The rate of cerium oxidation is fast, while the reduction of ceria is generally sluggish.52 As reported in the previous literature, the reduction of ceria depended on the nature of oxygen vacancies, and the type, size and concentration of the oxygen vacancies were the rate-controlling factors for ceria reduction.33,43 Actually, the control of the density and the nature of the oxygen vacancies could provide a means for tailoring the reactivity of ceria-based catalysts.33 Furthermore, it was widely accepted that Ce3+ species played a crucial role in the excellent SCR performance of the Ce/TiO2 catalyst. The existence of the oxygen vacancy could be accompanied by the presence of Ce3+ in the ceria particle,32 which was generated from the surface defects, and the number of surface defects would increase with the decrease in size of ceria particles.32Our XPS results verified the existence of Ce3+ in the Ce/Ti catalyst and its disappearance in the Na-Ce/Ti and Ca-Ce/Ti catalysts. The results of analysis of XRD, Raman and TEM indicated that the number of crystalline CeO2 particles increased and the crystal size and crystallization of the CeO2 particles were amplified after the loading of Na+ and Ca2+ ions. Both of these obviously changes could be mainly ascribed to the effect of “molten salt flux”.53–55 In real flue gas conditions or in the simulated loading condition-calcination process, the loaded sodium nitrate or calcium nitrate would form a molten salt flux on the surface of the Ce/TiO2 catalyst, covering the ceria nanoparticles. Under this condition, the crystal size of the ceria nanoparticles would be enlarged and their crystallinity improved,53–55 which would show similar phenomena to our observations. During the “molten salt flux”, the defects on the ceria particles, as well as the oxygen vacancies, diminished step by step, and finally disappeared. Thus the reduction rate of the ceria declined and the rate of repeatable Ce4+/Ce3+ redox cycles also decreased. In addition, the drop in surface acidity also negatively affected the SCR activity of ceria catalysts, though these were not linearly related.
Based on the contributions of previous researchers and the above discussion, a deactivation mechanism of the Ce/TiO2 SCR catalyst by the loading of Na+ or Ca2+ ions was proposed (shown in Fig. 10),20–22,56 which involves the crystal growth of ceria, a drop in surface acidity and decreased Ce4+/Ce3+ redox cycles.
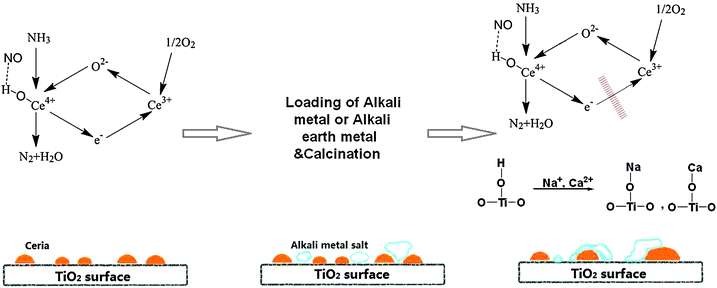 | ||
| Fig. 10 Proposed deactivation mechanism of Ce/TiO2 SCR catalyst by the loading of Na+ and Ca2+ ions. | ||
Conclusions
The Ce/Ti catalyst was observed to be seriously poisoned by the doping of Na+, K+ or Ca2+ ions. When Na/Ce or Ca/Ce molar ratio exceeded 0.25, NO conversion of the Ce/Ti catalyst at 380 °C decreased from 78% to negligibly low. Characterization of the catalysts by XRD, TEM and Raman spectra revealed that amorphous ceria was dominant in the Ce/Ti catalyst, but would transform to the crystalline form after loading of Na+ or Ca2+ ions. Investigation by XPS revealed that the loading of Na+ or Ca2+ ions led to the transformation of Ce3+ to Ce4+, resulting in the disappearance of oxygen vacancies and Ce3+ in ceria particles. Thus the reduction rate of ceria slowed down and the oxidation/reduction recycle reduced. Besides the decrease in surface acidity, we propose that the enlargement of ceria nanoparticles and the reduced Ce4+/Ce3+ redox cycle rate could be the major factors contributing to the decline in the SCR activity of the Ce/TiO2 catalyst after Na+ or Ca2+ ion loading.Notes and references
- L. J. Alemany, F. Berti, G. Busca, G. Ramis, D. Robba, G. P. Toledo and M. Trombetta, Appl. Catal., B, 1996, 10, 299–311 CrossRef CAS.
- G. Busca, L. Lietti, G. Ramis and F. Berti, Appl. Catal., B, 1998, 18, 1–36 CrossRef CAS.
- P. Forzatti, Appl. Catal., A, 2001, 222, 221–236 CrossRef CAS.
- F. Tang, B. Xu, H. Shi, J. Qiu and Y. Fan, Appl. Catal., B, 2010, 94, 71–76 CrossRef CAS.
- A. Kling, C. Andersson, A. Myringer, D. Eskilsson and S. G. Jaras, Appl. Catal., B, 2007, 69, 240–251 CrossRef CAS.
- Y. J. Zheng, A. D. Jensen, J. E. Johnsson and J. R. Thogersen, Appl. Catal., B, 2008, 83, 186–194 CrossRef CAS.
- D. Nicosia, I. Czekaj and O. Krocher, Appl. Catal., B, 2008, 77, 228–236 CrossRef CAS.
- Y. P. Li, T. J. Wang, C. Z. Wu, Y. Gao, X. H. Zhang, C. G. Wang, M. Y. Ding and L. L. Ma, Ind. Eng. Chem. Res., 2010, 49, 3176–3183 CrossRef CAS.
- Y. Li, T. Wang, X. Yin, C. Wu, L. Ma, H. Li and L. Sun, Fuel, 2009, 88, 2181–2187 CrossRef CAS.
- S. Albertazzi, F. Basile, J. Brandin, J. Einvall, G. Fornasari, C. Hulteberg, M. Sanati, F. Trifirò and A. Vaccari, Energy Fuels, 2008, 23, 573–579 CrossRef.
- Y. L. Wang, Z. Y. Liu, L. A. Zhan, Z. G. Huang, Q. Y. Liu and J. R. Ma, Chem. Eng. Sci., 2004, 59, 5283–5290 CrossRef CAS.
- F. Liu, W. Shan, X. Shi, C. Zhang and H. He, Chin. J. Catal., 2011, 32, 1113–1128 CrossRef CAS.
- R. Q. Long and R. T. Yang, J. Am. Chem. Soc., 1999, 121, 5595–5596 CrossRef CAS.
- J.-H. Park, H. J. Park, J. H. Baik, I.-S. Nam, C.-H. Shin, J.-H. Lee, B. K. Cho and S. H. Oh, J. Catal., 2006, 240, 47–57 CrossRef CAS.
- J. J. Yu, X. P. Wang, L. D. Li, Z. P. Hao, Z. P. Xu and G. Q. Lu, Adv. Funct. Mater., 2007, 17, 3598–3606 CrossRef CAS.
- G. S. Qi, R. T. Yang, R. Chang, S. Cardoso and R. A. Smith, Appl. Catal., A, 2004, 275, 207–212 CrossRef CAS.
- H. Tounsi, S. Djemal, C. Petitto and G. Delahay, Appl. Catal., B, 2011, 107, 158–163 CrossRef CAS.
- J. Li, J. Chen, R. Ke, C. Luo and J. Hao, Catal. Commun., 2007, 8, 1896–1900 CrossRef CAS.
- K. Skalska, J. S. Miller and S. Ledakowicz, Sci. Total Environ., 2010, 408, 3976–3989 CrossRef CAS.
- W. Q. Xu, Y. B. Yu, C. B. Zhang and H. He, Catal. Commun., 2008, 9, 1453–1457 CrossRef CAS.
- L. Chen, J. Li and M. Ge, Environ. Sci. Technol., 2010, 44, 9590–9596 CrossRef CAS.
- L. Chen, J. Li, M. Ge and R. Zhu, Catal. Today, 2010, 153, 77–83 CrossRef CAS.
- H. Kamata, K. Takahashi and C. U. I. Odenbrand, J. Mol. Catal. A: Chem., 1999, 139, 189–198 CrossRef CAS.
- M. Klimczak, P. Kern, T. Heinzelmann, M. Lucas and P. Claus, Appl. Catal., B, 2010, 95, 39–47 CrossRef CAS.
- J. Beck, J. Brandenstein, S. Unterberger and K. R. G. Hein, Appl. Catal., B, 2004, 49, 15–25 CrossRef CAS.
- J. R. Strege, C. J. Zygarlicke, B. C. Folkedahl and D. P. McCollor, Fuel, 2008, 87, 1341–1347 CrossRef CAS.
- P. Kern, M. Klimczak, T. Heinzelmann, M. Lucas and P. Claus, Appl. Catal., B, 2010, 95, 48–56 CrossRef CAS.
- T. J. Toops, K. Nguyen, A. L. Foster, B. G. Bunting, N. A. Ottinger, J. A. Pihl, E. W. Hagaman and J. A. Jiao, Catal. Today, 2010, 151, 257–265 CrossRef CAS.
- A. L. Kustov, S. B. Rasmussen, R. Fehrmann and P. Simonsen, Appl. Catal., B, 2007, 76, 9–14 CrossRef CAS.
- H. Wang, X. Chen, X. Weng, Y. Liu, S. Gao and Z. Wu, Catal. Commun., 2011, 12, 1042–1045 CrossRef CAS.
- J. P. Chen and R. T. Yang, J. Catal., 1990, 125, 411–420 CrossRef CAS.
- P. Dutta, S. Pal, M. S. Seehra, Y. Shi, E. M. Eyring and R. D. Ernst, Chem. Mater., 2006, 18, 5144–5146 CrossRef CAS.
- F. Esch, S. Fabris, L. Zhou, T. Montini, C. Africh, P. Fornasiero, G. Comelli and R. Rosei, Science, 2005, 309, 752–755 CrossRef CAS.
- L. Wu, H. J. Wiesmann, A. R. Moodenbaugh, R. F. Klie, Y. Zhu, D. O. Welch and M. Suenaga, Phys. Rev. B: Condens. Matter Mater. Phys., 2004, 69, 125415 CrossRef.
- T. Ohsaka, F. Izumi and Y. Fujiki, J. Raman Spectrosc., 1978, 7, 321–324 CrossRef.
- W. F. Zhang, Y. L. He, M. S. Zhang, Z. Yin and Q. Chen, J. Phys. D: Appl. Phys., 2000, 33, 912 CrossRef CAS.
- V. G. Keramidas and W. B. White, J. Chem. Phys., 1973, 59, 1561–1562 CrossRef.
- W. H. Weber, K. C. Hass and J. R. McBride, Phys. Rev. B: Condens. Matter, 1993, 48, 178 CrossRef CAS.
- B. C. Viana, O. P. Ferreira, A. G. Souza Filho, C. M. Rodrigues, S. G. Moraes, J. Mendes Filho and O. L. Alves, J. Phys. Chem. C, 2009, 113, 20234–20239 CAS.
- B. Reddy and A. Khan, Catal. Surv. Asia, 2005, 9, 155–171 CrossRef CAS.
- H. He, H. X. Dai and C. T. Au, Catal. Today, 2004, 90, 245–254 CrossRef CAS.
- F. B. Noronha, E. C. Fendley, R. R. Soares, W. E. Alvarez and D. E. Resasco, Chem. Eng. J., 2001, 82, 21–31 CrossRef CAS.
- C. T. Campbell and C. H. F. Peden, Science, 2005, 309, 713–714 CrossRef CAS.
- F. Larachi, J. Pierre, A. Adnot and A. Bernis, Appl. Surf. Sci., 2002, 195, 236–250 CrossRef CAS.
- S. Yang, Y. Feng, J. Wan, W. Zhu and Z. Jiang, Appl. Surf. Sci., 2005, 246, 222–228 CrossRef CAS.
- S. Yang, W. Zhu, Z. Jiang, Z. Chen and J. Wang, Appl. Surf. Sci., 2006, 252, 8499–8505 CrossRef CAS.
- Y. Shen, D. Zheng, B. Yang, S. Ni and S. Zhu, J. Rare Earths, 2012, 30, 431–436 CrossRef CAS.
- A. Trovarelli, Catal. Rev. Sci. Eng., 1996, 38, 439–520 CAS.
- L. Xue, C. Zhang, H. He and Y. Teraoka, Appl. Catal., B, 2007, 75, 167–174 CrossRef CAS.
- S. Damyanova, C. A. Perez, M. Schmal and J. M. C. Bueno, Appl. Catal., A, 2002, 234, 271–282 CrossRef CAS.
- L. Z. Linganiso, G. Jacobs, K. G. Azzam, U. M. Graham, B. H. Davis, D. C. Cronauer, A. J. Kropf and C. L. Marshall, Appl. Catal., A, 2011, 394, 105–116 CrossRef CAS.
- X. Liu, K. Zhou, L. Wang, B. Wang and Y. Li, J. Am. Chem. Soc., 2009, 131, 3140–3141 CrossRef CAS.
- P. Afanasiev, ChemInform, 2002, 33, 25 Search PubMed.
- F. Bondioli, A. Bonamartini Corradi, C. Leonelli and T. Manfredini, Mater. Res. Bull., 1999, 34, 2159–2166 CrossRef CAS.
- F. Bondioli, A. B. Corradi, T. Manfredini, C. Leonelli and R. Bertoncello, Chem. Mater., 1999, 12, 324–330 CrossRef.
- Y. Shen, S. Zhu, T. Qiu and S. Shen, Catal. Commun., 2009, 11, 20–23 CrossRef CAS.
| This journal is © The Royal Society of Chemistry 2013 |