A rational interpretation of improved catalytic performances of additive-impregnated dried CoMo hydrotreating catalysts: a combined theoretical and experimental study
V.
Costa
a,
B.
Guichard
*a,
M.
Digne
a,
C.
Legens
a,
P.
Lecour
a,
K.
Marchand
a,
P.
Raybaud
a,
E.
Krebs
a and
C.
Geantet
b
aIFP Energies nouvelles, Rond point de l'échangeur de Solaize, BP 3, 69360 Solaize, France. E-mail: victor.costa@ifpen.fr; bertrand.guichard@ifpen.fr; mathieu.digne@ifpen.fr; philippe.lecour@ifpen.fr; pascal.raybaud@ifpen.fr; christophe.geantet@ircelyon.univ-lyon1.fr
bIRCELYON, UMR 5256 CNRS Université Lyon 1, 2 avenue Albert Einstein, 69626 Villeurbanne Cedex, France
First published on 11th October 2012
Abstract
CoMo additive-impregnated dried catalysts are studied, exploring the “CoMoS” active phase features by combining X-ray Photoelectron Spectroscopy (XPS), Transmission Electron Microscopy (TEM) and catalytic tests. Starting from different polyoxomolybdate precursors, additive-impregnated dried, additive-free dried and calcined catalyst performances are compared. TEM reveals that the mean particle sizes are about 3.1 nm and do not depend on the catalytic precursors except for the additive-free dried catalysts exhibiting higher lengths: 3.7 nm. XPS quantification of the Mo species shows that 75 mol% of the Mo species are present in the MoS2 phase whatever the preparation route. This value is slightly enhanced (ca. 85%) with additive impregnation. The molybdenum to aluminium surface coverage ratio (Mo/Al) ranking is found to be as follows: additive-free dried < additive-impregnated dried < calcined. However, this ranking is not significantly modified by the impregnating solution used, and the behaviour is similar for the cobalt to aluminium ratio (Co/Al). A geometrical model combining XPS quantification of the crystallite's Co/Mo ratio and DFT calculations is used to establish a correlation with the catalytic results obtained in toluene hydrogenation. It is shown that the catalytic performances of additive-free dried, additive-impregnated dried and calcined catalysts directly correlate the number of mixed Co–Mo sites present at the MoS2 edges. DFT calculations highlight that the adsorption step of toluene is thermodynamically favored on the mixed Co–Mo site located at the M-edge. As a consequence, this study suggests that the various routes of preparation leading to different catalytic performances would not lead to new types of active sites or morphology but rather to a different number of mixed sites present at the edges.
Introduction
The production of ever cleaner fuels with ultra low sulfur content requires a continuous improvement of the catalysts used by the refining industry. Sulfide catalysts such as γ-alumina supported Co(Ni)MoS have been widely used in hydrotreatment processes for the last six decades. However, until the early 1980s, very little information was available about the structures of the active phase of industrial HDT catalysts under working conditions. Physicochemical characterizations such as Mössbauer1,2 and XAS3–5 allowed to describe the active phase “Ni(Co)MoS” consisting of the decoration of MoS2 nano-crystallite edges by Co or Ni promoters. Promotions/decorations and sulfidations of those catalysts may also be characterized by X-ray Photoelectron Spectroscopy (XPS). This technique was also appropriate to identify the electronic state of Co species6–9 and Ni species10–13 in the active phase and to quantify them.14,15 STM experiments on gold-supported “CoMoS” particles16 were also relevant to give an atomic scale representation of the CoMoS crystallites. At the same time, Density Functional Theory (DFT) appeared also as a very efficient method for bringing new insights into the local structure, electronic properties17–20 and stability of the active phase of HDT catalysts.21 It also improved the geometrical model earlier proposed by Kasztelan et al.22 Complementary DFT calculations have also shown the possible existence of mixed sites at the edges of the crystallites,23 recently imaged by HRTEM.24 A mixed site (Co–Mo or Ni–Mo pair) is defined as a promoter atom nearby a Mo atom, both being located at the edges.23 It was also experimentally demonstrated that the optimal promoter-to-molybdenum atomic ratio in the nanocrystallite (also called decoration ratio) corresponded to (Co/Mo)CoMoS = 0.3.15 This ratio corresponds to a complete decoration of the S-edge whereas the substitution of the Mo atoms at the M-edge corresponds to only 50%, which reveals that the mixed Co–Mo mixed sites play a key catalytic role.During the last decade, HDT catalyst performances have been highly improved by increasing the amount of the active phase. Many improvements were introduced. Among them, the use of additive-impregnated catalysts led to a new generation of industrial catalysts. At first chelating and complexing agents have been proposed and later organic additives such as polyols.25–30 One simple and efficient method to boost the catalytic activity is the impregnation of catalysts with these organic molecules. For instance, glycol molecules, such as diethyleneglycol monobutyl ether (DEGbe) or triethyleneglycol (TEG), have been proposed as suitable compounds, leading to significant gains in hydrodesulfurization activities.31,32 These gains were observed whenever the additive impregnation was performed: on the support prior to active phase precursor impregnation, simultaneous impregnation of the cobalt and molybdenum precursors and the additive, post-impregnation of dried or calcined catalysts. Catalytic improvement is well established in the literature.33,34 Nevertheless, the origins of the activity enhancement remain controversial. On the one hand, authors have concluded that glycol-type additives act as low temperature sulfidation inhibitors (T < 473 K).33,35,36 On the other hand, glycol promotes sulfidation.34 But in both cases, the presence of the organic compounds hinders the interaction between the active phase precursors (Co, Mo) and alumina and enhances the dispersion of metallic species.32,37 As a consequence, more cobalt atoms are available to promote MoS2 crystallites formed upon sulfidation.
One possible origin of these discrepancies may come from the nature of the oxide precursors used. Preparation of molybdenum heteropolyanions (HPA) only emerged a few years ago as a new path to obtain improved catalysts: for instance, phosphomolybdate anions, such as PMo12O403− or P2Mo5O236−,38,39 and more recently cobaltohexamolybdate Anderson HPA CoMo6O24H73− and its dimeric form, Co2Mo10O38H46−,40,41 have been proposed as efficient precursors. The impact of additives on the dispersion or re-dissolution phenomena might differ with respect to the nature of the precursors as illustrated by Costa et al.42
In the present work, we extended the structural study of the CoMoS phase for additive-impregnated dried catalysts, exploring the “CoMoS” active phase features by combining X-ray Photoelectron Spectroscopy (XPS), Transmission Electron Microscopy (TEM), and catalytic tests. Our goals were to obtain a better understanding of the promoter decoration at the edges of the MoS2 crystallites, taking into account the role of nano-crystallites morphology and to highlight the different features arising from the use of additive-impregnated dried catalysts or calcined catalysts. Starting from three relevant polyoxomolybdate precursors, catalysts were prepared and the additive impregnation stage was conducted on dried catalysts. All catalysts were sulfided using the same procedure in order to point out the role of the impregnation solution on the active phase genesis. In addition, we discuss the experimental results with the help of previously published works carried out on the CoMo additive-impregnated dried precursors.42 DFT calculations on toluene adsorption on the CoMoS models determined by Krebs et al.23,43 allow for the rationalization of the influence of the additive on the catalytic performances with respect to the precursor solutions.
Methods
Catalysts preparation
For all prepared CoMo(P) catalysts, γ-alumina extrudates (specific surface area of 300 m2 g−1) were used as a support. The molybdenum loading was fixed at 18 wt% MoO3. The impregnation was performed using the incipient wetness impregnation method. After 12 hours of aging (room temperature, water-saturated atmosphere), the catalysts were dried at 393 K for 2 hours. A fraction of the dried catalysts was calcined at 773 K for 2 hours under air flow. Dried and calcined catalysts are, respectively, denoted (D) and (C).Our first objective was to determine the influence of the deposited precursors nature on the additive impregnation efficiency and on the active phase structure and amount. For this purpose, catalysts were prepared using three different impregnation solutions:
(i) The first impregnation solution was obtained by dissolution of ammonium heptamolybdate (AHM) and cobalt nitrate in water, with a Co/Mo molar ratio of 0.39. Due to the limited solubility of these salts, the impregnation was performed in two steps to reach the 18% MoO3 loading, with an intermediate drying step. The corresponding catalyst is denoted CoMo_AHM(D).
(ii) The second impregnation solution contained the Co2Mo10O38H46− heteropolyanion (HPA). This preparation was performed according to the procedure described in ref. 28. In this solution, cobalt ions in the HPA species exhibit a +III oxidation state, whereas the cobalt counter-ions exhibit a +II oxidation state. The Co/Mo molar ratio is thus 0.5 and the catalysts are denoted CoMo_HPA(D).
(iii) The third impregnation type contained the lacunary Keggin PMo9O34H45− HPA, or the P2Mo5O236− HPA. The solutions were prepared by dissolution of molybdenum trioxide and cobalt hydroxide and addition of H3PO4. The Co/Mo molar ratio was fixed to 0.4 and three P/Mo molar ratios were investigated: 0.11 (leading to PMo9O34H45−), 0.40 and 0.57 (leading to P2Mo5O236−). These catalysts are denoted CoMoP(xD), where x stands for the phosphorous content, expressed as P2O5 wt% on the catalyst.
Accordingly, the corresponding calcined catalysts are denoted CoMo_AHM(C), CoMo_HPA(C) and CoMoP(xC).
The additive impregnation step was performed on dried catalysts by incipient wetness impregnation with an aqueous solution of triethyleneglycol (TEG). The TEG concentration was fixed in order to obtain a TEG/Mo molar ratio close to 0.75. After impregnation, the catalysts were aged for 12 h at ambient temperature and dried for 6 h at 363 K and 5 kPa. No calcination was applied on additive-containing catalysts and the corresponding catalysts are labeled “(D)+TEG”.
The different types of catalysts are listed in Table 1. The molybdenum, cobalt, phosphorus and aluminium contents were determined by X-ray fluorescence (XRF, Philips PW2404 spectrometer) and TEG loadings were determined using the carbon content, obtained with a CE Instruments EA1110 elemental analyser.
| Catalysts | P/Mo mol ratio | Co/Mo mol ratio | TEG/Mo mol ratio | r HYD (moltoluene_converted molMo−1 h−1) | r ISOM (molcyclohexane_converted molMo−1 h−1) | r HYD (moltoluene_converted molCoMoS−1 h−1) |
|---|---|---|---|---|---|---|
| D stands for dried catalyst; C for calcined catalyst; _AHM for standard preparation (ammonium heptamolybdate and cobalt nitrate); _HPA for cobaltomolybdate heteropolyanions. | ||||||
| CoMo_AHM(C) | 0 | 0.39 | 0 | 1.47 | 0.043 | 5.0 |
| CoMo_AHM(D) | 0 | 0.39 | 0 | 0.94 | 0.031 | 5.8 |
| CoMo_AHM(D)+TEG | 0 | 0.39 | 0.78 | 1.05 | 0.040 | 6.5 |
| CoMo_HPA(C) | 0 | 0.50 | 0 | 1.50 | 0.046 | 4.8 |
| CoMo_HPA(D) | 0 | 0.50 | 0 | 1.18 | 0.036 | 5.2 |
| CoMo_HPA(D)+TEG | 0 | 0.50 | 0.71 | 1.80 | 0.034 | 4.8 |
| CoMoP(1C) | 0.12 | 0.39 | 0 | 1.32 | 0.039 | 7.0 |
| CoMoP(1D) | 0.12 | 0.39 | 0 | 1.22 | 0.031 | 7.1 |
| CoMoP(1D)+TEG | 0.12 | 0.39 | 0.85 | 1.52 | 0.036 | 7.3 |
| CoMoP(3C) | 0.38 | 0.39 | 0 | 1.54 | 0.068 | 5.3 |
| CoMoP(3D) | 0.38 | 0.39 | 0 | 1.23 | 0.066 | 5.0 |
| CoMoP(3D)+TEG | 0.38 | 0.39 | 0.81 | 1.90 | 0.071 | 7.8 |
| CoMoP(5C) | 0.54 | 0.39 | 0 | 1.53 | 0.074 | 5.7 |
| CoMoP(5D) | 0.54 | 0.39 | 0 | 1.33 | 0.070 | 4.6 |
| CoMoP(5D)+TEG | 0.54 | 0.39 | 0.80 | 1.88 | 0.083 | 5.3 |
Sulfidation conditions
Prior to their analysis, the oxide precursors and catalysts were sulfided at atmospheric pressure under a H2S–H2 mixture with a p(H2S)/p(H2) ratio of about 0.17 and a gas flow of 2 L h−1 g−1 of catalyst. The samples were heated under the sulfiding mixture at a rate of 5 K min−1 up to 673 K and maintained at this temperature for 2 hours. They were then cooled down to room temperature at a rate of 20 K min−1 under the reactive mixture. The sulfided catalysts were transferred into glass vials under vacuum in order to avoid any contact with air.TEM analysis
The sulfided samples were analyzed by TEM to determine the average length and stacking of the MoS2 nanocrystallites by counting at least 350 particles. The extrudates were crushed into a fine powder, a small amount of which being ultra-sonically diluted in ethanol. Two drops of this solution were deposited on a carbon-coated copper grid and the solvent was evaporated under infrared light. TEM images were taken using a 200 kV JEOL-2010 transmission electron microscope equipped with a digital camera.XPS analysis
The XPS sampling of the sulfided catalysts was performed in a glove box under an argon atmosphere, with controlled oxygen and water levels (less than 20 ppm) in order to prevent their partial reoxidation. The samples were crushed and pressed onto an indium foil that was attached to the sample holder via a double side carbon tape. The sample holder was then moved directly to the introduction chamber of the XPS spectrometer, thanks to the special connection of the glove box to the XPS spectrometer. The XPS spectra were recorded on a Kratos Axis Ultra instrument with an aluminium monochromator source (1486.6 eV) and a hemi-spherical analyzer operating at a fixed pass energy of 40 eV. The measurements were made at 293 K in steps of 0.05 eV for cobalt, 0.1 eV for sulfur and 0.1 eV for molybdenum, and at a pressure lower than 10−9 Pa in the sample analysis chamber. Binding energies (BE) of the various elements have been referenced to the C 1s level of the contamination carbon at 284.6 eV (the Al 2p is found at 74.7 eV). The curves were integrated by applying a Shirley type baseline. The collected spectra were analyzed by using CasaXPS version 2.0.71 software. The decomposition of the S 2p, Mo 3d and Co 2p signals was performed using the appropriate oxide and sulfided references as supported monometallic catalysts and led us to use the protocol to quantify the CoMoS phase, already described in the literature13,14 and briefly explained here. For the cobalt atom, we found three different species on the catalysts: (i) Co(II) oxide as present on the oxide mono metallic catalyst with a main binding energy position at 781.5 ± 0.1 eV,8,12,14 (ii) CoSulf corresponding to cobalt sulfide (Co9S8), obtained from the sulfidation of the previous references with the main Co 2p3/2 position at 778.1 ± 0.1 eV, and (iii) a third contribution of the sulfided sample which has to be integrated to correctly fit the spectrum. This contribution, associated to the formation of the “CoMoS” phase, is mainly positioned at 778.6 ± 0.1 eV in agreement with other studies.8,12,14 The Mo 3d spectra of sulfided catalysts were also decomposed according to the methods described in ref. 8 and 13. Three different oxidation degrees of molybdenum were found: Mo+VI (232.1 eV), Mo+V (230.1 eV), and Mo+IV (228.7 eV). They were, respectively, attributed to the oxide, oxisulfide and sulfide phases.14 In a similar way, the decomposition of the S 2p reveals three components, corresponding to three local environments: SSulf (fully sulfided), SOx (oxysulfide species) and SSulfates (fully oxidized).The effective atomic concentration, expressed in %molar [i] of the element i, was obtained from the measurement of the corresponding total peak area Ai and the use of appropriate sensitivity factor “Si” given by the constructor, according to eqn (1). To approach the effective atomic surface concentrations, all atoms (except the contamination carbon) detected on the surface were taken into account (eqn (1)). The quantification is obtained with 10% relative accuracy.
 | (1) |
 | (2) |
We may then deduce the effective amount of the CoMoS phase denoted [CoMoS] by multiplying the relative value with the total cobalt content [Co] measured by XPS (eqn (3)). This amount is expressed in atomic concentration (or in %molar).
| [CoMoS] = %CoMoS × [Co] | (3) |
In the same way, the MoS2 quantity can be deduced from the area of Mo(IV) Mo(V), and Mo(VI). It leads to the so-called “decoration ratio” defined as follows (eqn (4)):
 | (4) |
To analyze the molybdenum and cobalt coverage fractions over the alumina surface we evaluated the following atomic ratios (eqn (5)).
 | (5) |
The surface ratio Co/Mo useful in this paper is also deduced as follows (eqn (6)):
 | (6) |
Two samples were analyzed for each catalyst and the data presented in this paper correspond to the average values of both analysis. In order to get a better understanding about the signal decomposition, the reader should refer to previous publications.8,12,14
Catalytic measurements
The hydrogenation activity of the sulfided catalysts has been evaluated using toluene hydrogenation under sulfo-reductive conditions. The catalytic tests performed in this study were carried out in a fixed-bed high pressure flow microreactor under the following conditions: 4 cm3 of length-selected extrudates (2–4 mm), a total pressure of 6 MPa corresponding to H2S partial pressure of 0.215 MPa, and hydrogen partial pressure of 3.69 MPa. The reaction temperature was 623 K and the liquid hourly space velocity (LHSV) was 2 h−1, with a hydrogen-to-feed ratio of 450 L/L. The feedstock consisted of a dimethyldisulfide (5.9 wt%) and toluene (20 wt%) mixture in cyclohexane. After the unit was pressure-tested at room temperature, the temperature was increased at 2 K min−1 to 623 K. Steady-state conversion was measured after 2 hours on stream. Reaction products were analyzed using on-line gas chromatography. The activity in toluene hydrogenation was expressed considering a first order reaction according to eqn (7). The activity measurements exhibit 5% relative accuracy. | (7) |
The reaction rate can also be expressed in mole of toluene converted per mole of molybdenum and per hour in order to describe an active site activity (eqn (8)). Considering both XRF and the catalytic performance evaluation, it leads us to estimate the reaction rate with 10% relative accuracy.
 | (8) |
Combining eqn (3) (6) and (8) it is then possible to deduct the reaction rate expressed in mole of toluene per mole of CoMoS phase.
The same calculations leading to equivalent expressions can be performed concerning the isomerization of cyclohexane which is followed to estimate the catalyst acidity and indirectly the influence of acidity modification on the hydrogenation activity. For instance, a higher P/Mo ratio could enhance the hydrogenation activity, thanks to the apparition of acid sites on the catalyst surface: such modifications can be detected by isomerization.
Density functional theory (DFT)
DFT calculations were carried out along the same lines as those reported for 2 methyl-thiophene, 2,3-dimethylbut-1-ene and toluene molecules.44,45 These calculations were based on the plane wave density functional theory within the generalized gradient approximation.46 We used the Vienna ab initio simulation package47,48 to solve the Kohn–Sham equations,49,50 within the projected augmented wave formalism51 and periodic boundary conditions. The cut-off energy governing the size of the plane wave basis set was fixed at 500.0 eV. The geometry optimization was completed when the convergence criteria on forces become smaller than 0.05 eV Å−1.We calculated the adsorption energy of toluene as follows:
| ΔEads = E(MoxCoySz–Toluene) – E(MoxCoySz) – E(Toluene) | (9) |
 | ||
| Fig. 1 Truncated supercells used for the M-edge (only the first two metallic rows are represented): (a) 100% Co and 0% S, (b) 50% Co (in alternated position Co–Mo–Co–Mo) and 25% S, (c) 50% Co (in pairing position Co–Co–Co–Mo) and 25% S. Color legend: yellow balls: sulfur, green balls: molybdenum, blue balls: cobalt. | ||
The stable adsorption modes of toluene adsorbed on both edges are suspected to depend on the number of Co atoms and S atoms present at the edges. As shown by previous studies,17,19,52 the sulfur coverage and promoter content at the edge depend on the sulfo-reductive conditions: temperature and p(H2S)/p(H2) ratio. By using periodic slabs, we calculated the adsorbed molecules edge energy using the following chemical equation:
 | (10) |
The corresponding edge energy (in eV per metallic atom at the edge) corresponding to the variation of the Gibbs free energy for the promoted M-edge with adsorbed toluene is written as follows:
 | (11) |
and G(Toluene) corresponds to the Gibbs free energy of the toluene molecule in the gas phase. This term will be assumed to be a constant value in what follows.
The values taken by ΔμS as a function of T and p(H2S)/p(H2) are given by the abacus reported elsewhere:53 the estimated value of ΔμS corresponding to our catalytic tests (T = 623 K and p(H2S)/p(H2) ∼ 0.05–0.06) is comprised between −1 and −0.8 eV. Note that these reaction conditions are similar to the sulfidation conditions, which implies no significant changes of the sulfur chemical potential.
Periodic supercells have been chosen consistently with our previous studies.23,44 In the z direction (Fig. 1), the slab contains four Mo sub-surface layers capped by one row of metallic atoms (Mo and/or Co). In the y direction, four edge sites are considered. The k-point mesh (3, 3, 1) was also optimized to ensure an accurate discrete sampling of the supercell's Brillouin zone. Moreover, according to these previous studies, it was shown that mixed Co–Mo sites or pure Co sites may exist on the M-edge depending on the sulfo-reductive conditions fixed by ΔμS. In our experiments of toluene hydrogenation (−1 < ΔμS < −0.8 eV), it is thus relevant to consider both mixed Co–Mo sites and pure Co sites. The three relevant M-edge configurations are represented in Fig. 1: M-edge fully covered by 100% Co and 0% S (a), M-edge covered by 50% Co either in an alternated configuration (b) or in a pairing configuration (c). In addition, for configurations (b) and (c), we also explored if the toluene adsorption may induce a loss of one S-atom (12.5% S) at the edge. We recall that for the S-edge, previous DFT calculations19,54 show that this edge is predominantly covered by 100% Co which are four fold coordinated with S. Due to sterical hindrance induced by S-atoms, all attempts to adsorb toluene on this Co site failed. So we focused on the M-edge in the present study.
Results and discussion
Quantification of the CoMoS and MoS2 phases using XPS and XRF
The distribution of each phase has been reported with respect to the preparation route shown in Table 2. The different amounts of phosphorous do not influence the extent of the sulfidation of molybdenum: on the dried catalysts, about 75% of the molybdenum is sulfided into MoS2. A similar trend was found on calcined catalysts or dried additive-impregnated catalysts. Nevertheless, the dried additive-impregnated catalysts always exhibit slightly higher levels of sulfidation (Table 2).| Catalyst | State |
|
Mo repartition (% rel.) | Co repartition (% rel.) | S repartition (% rel.) |
|
||||||
|---|---|---|---|---|---|---|---|---|---|---|---|---|
| MoS2 | Mo5+ | Mo6+ | CoSulf | Co2+ | CoMoS (PRb) | S-sulf | SOx | Sulfates | ||||
| a D stands for dried catalyst; C for calcined catalyst; _AHM for standard preparation (ammonium heptamolybdate and cobalt nitrate); _HPA for cobaltomolybdate heteropolyanions. Decoration ratio calculated from eqn (4). b Promotion ratio calculated from eqn (2). c Total Co/Mo atomic ratio calculated from eqn (6). | ||||||||||||
| CoMo_AHM | (D) | 0.19 | 87 | 8 | 5 | 47 | 23 | 30 | 89 | 11 | 0 | 0.54 |
| (C) | 0.44 | 66 | 26 | 8 | 11 | 38 | 51 | 75 | 25 | 0 | 0.58 | |
| (D)+TEG | 0.20 | 80 | 13 | 7 | 47 | 21 | 32 | 87 | 13 | 0 | 0.50 | |
| CoMo_HPA | (D) | 0.32 | 70 | 14 | 16 | 19 | 41 | 40 | 69 | 10 | 21 | 0.57 |
| (C) | 0.39 | 81 | 14 | 5 | 13 | 32 | 55 | 86 | 14 | 0 | 0.57 | |
| (D)+TEG | 0.44 | 85 | 9 | 6 | 11 | 31 | 58 | 86 | 14 | 0 | 0.65 | |
| CoMoP(1) | (D) | 0.22 | 78 | 15 | 7 | 37 | 28 | 35 | 87 | 13 | 0 | 0.49 |
| (C) | 0.26 | 77 | 16 | 7 | 35 | 30 | 35 | 85 | 15 | 0 | 0.54 | |
| (D)+TEG | 0.25 | 80 | 14 | 6 | 34 | 26 | 40 | 92 | 8 | 0 | 0.52 | |
| CoMoP(3) | (D) | 0.33 | 75 | 19 | 6 | 16 | 28 | 56 | 82 | 18 | 0 | 0.44 |
| (C) | 0.46 | 71 | 21 | 8 | 7 | 36 | 57 | 75 | 25 | 0 | 0.51 | |
| (D)+TEG | 0.31 | 78 | 16 | 7 | 20 | 28 | 52 | 85 | 15 | 0 | 0.47 | |
| CoMoP(5) | (D) | 0.38 | 75 | 21 | 4 | 14 | 33 | 53 | 82 | 18 | 0 | 0.54 |
| (C) | 0.36 | 77 | 17 | 6 | 13 | 32 | 55 | 87 | 13 | 0 | 0.49 | |
| (D)+TEG | 0.44 | 81 | 14 | 5 | 11 | 31 | 58 | 88 | 12 | 0 | 0.61 | |
Decompositions of Co 2p spectra of sulfided catalysts were carried out as described in the experimental section. The resulting cobalt speciation is summarized in Table 2. There is a strong influence of the phosphorous content on the cobalt species. In CoMoP catalysts, the higher phosphorous amount (P/Mo ≥ 0.4) led to the highest promotion ratios (50–60%) for the dried as well as for the calcined catalysts. Comparing the precursors after additive-impregnation, there is no such difference whatever the P/Mo ratio is. Thus, at a low P/Mo ratio (<0.4), the additive led to a weak increase of the promotion ratio (from 35% to 40%), but at a P/Mo ratio higher than 0.4, the promotion ratio is insensitive to the additive impregnation. Nevertheless, at a low P/Mo ratio, the additive-impregnation effect is not sufficient to reach the same promotion ratio as for the P/Mo higher than 0.4. With dimeric Anderson HPA (i.e. without phosphorous), the promotion ratio is similar to the CoMoP(5C) or CoMoP(5D) + TEG (55–58%), except for the dried catalyst which exhibits a lower promotion ratio (40%). This last value could actually come from the accidental re-oxidation on this sample (sulfates formation, Table 2). The high promotion ratio obtained by use of dimeric Anderson HPA is due to the high proportion of cobalt engaged in the “CoMoS” phase (Co/Mo = 0.5 against 0.39 on the other samples, see Table 1).
Fig. 2 depicts the evolution of the Co/Al ratio with respect to the P/Mo ratio. It reveals that the Co/Al ratio is overall higher on the dried catalyst comparatively to the calcined catalyst. The dried additive-impregnated catalysts exhibit an in-between ratio: lower than the dried one and higher than the calcined one. Only the highest P/Mo ratio (0.54) and the CoMo_HPA catalysts led to a Co/Al ratio increase after the additive impregnation comparatively to the dried catalyst.
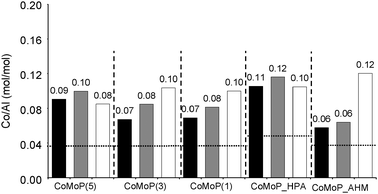 | ||
| Fig. 2 Evolution of the XPS Co/Al ratio according to the catalyst formulation (P/Mo ratio and used precursors). The white rows correspond to the additive-free dried catalysts (D), the black rows to the calcined catalysts (C) and the grey rows to the additive-impregnated dried catalysts (+TEG). The horizontal dotted line corresponds to XRF values. See Table 1 for elemental composition data. | ||
The Mo/Al ratios are plotted in Fig. 3. Like cobalt, the Mo/Al ratio is improved by the additive impregnation comparatively to the calcined catalyst. Nevertheless, as also observed for cobalt, the dried catalysts exhibit the highest Mo/Al ratio. Again, the behavior of the CoMo_HPA and CoMoP(5) samples are particular and similar: using the dimeric Anderson HPA or CoMoP(5) precursors, the Mo/Al ratio is neither sensitive to the catalyst state (dried or calcined) nor to the additive impregnation.
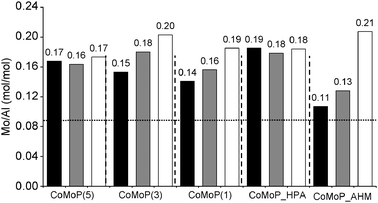 | ||
| Fig. 3 Evolution of the XPS Mo/Al ratio according to the catalyst formulation (P/Mo ratio and used precursors). The white rows correspond to the additive-free dried catalysts (D), the black rows to the calcined catalysts (C) and the grey rows to the additive-impregnated dried catalysts (+TEG). The horizontal dotted line corresponds to XRF values. See Table 1 for elemental composition data. | ||
The amount of the “CoMoS” phase, defined as the amount of cobalt in decoration of MoS2 nanocrystallites, is favored by all the parameters previously quantified:
(i) An increase in the molybdenum sulfidation (Table 2) leads to a larger amount of edge-sites available for the decoration by cobalt atoms.
(ii) An increase in the molybdenum dispersion (Mo/Al, Fig. 3) leads to an enhancement of the available MoS2.
(iii) An increase in the promotion ratio (Table 2) leads to an enhancement of the quantity of cobalt in decoration. This value could be linked to the cobalt availability i.e. its dispersion (Co/Al, Fig. 2).
The amount of the “CoMoS” phase can be expressed in mol of CoMoS per mol of MoS2 through the decoration ratio as defined in eqn (4) (Table 2). Fig. 4 presents the decoration ratios, i.e. (Co/Mo)Slabs, obtained for the various catalysts compared here. For the additive-free and additive-impregnated dried catalysts, there is an increase in the decoration ratio with P/Mo ratios. The additive-impregnated dried catalysts show higher decoration ratios than the ones without additive. However, the additive-impregnated dried catalysts do not exhibit the highest decoration ratios: this is obtained for the CoMoP(3C) catalyst. Again, the CoMo_HPA and CoMoP(5) catalysts are the only ones exhibiting the highest decoration ratios among the additive-impregnated dried catalysts.
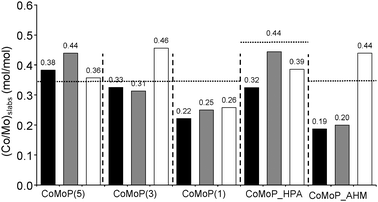 | ||
| Fig. 4 Evolution of the XPS decoration ratio according to catalyst formulation (P/Mo ratio and used precursors). The white rows correspond to the additive-free dried catalysts (D), the black rows to the calcined catalysts (C) and the grey rows to the dried additive-impregnated catalysts (+TEG). The horizontal dotted line corresponds to XRF values. See Table 1 for elemental composition data. | ||
The effective amount of the “CoMoS” phase (Fig. 5, atomic concentration obtained from eqn (3)) strongly depends on the preparation methods: precursors, additive impregnation and thermal treatment. After calcination, the amount of the “CoMoS” phase is improved except for the CoMoP(5C) catalyst. At low P/Mo ratios (<0.4), the additive impregnation does not significantly increase the amount of the “CoMoS” phase but at higher P/Mo ratios or for the CoMo_HPA synthesis, the dried additive-impregnated catalyst exhibits a higher amount of the “CoMoS” phase.
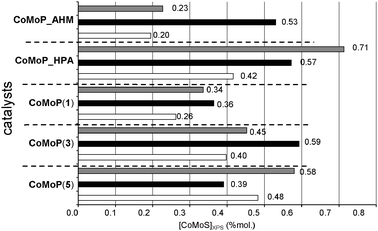 | ||
| Fig. 5 Effective amount of the XPS CoMoS phase (atomic concentration from eqn (3)). The white rows correspond to the additive-free dried catalysts (D), the black rows to the calcined catalysts (C) and the grey rows to the dried additive-impregnated catalysts (+TEG). | ||
TEM results
All sulfided catalysts were analyzed by TEM in order to determine the size of the sulfide phase. The results obtained (for example CoMo_AHM in Fig. 6) are very similar to those already published for calcined CoMo catalysts:9 whatever the precursors, the MoS2 nanocrystallites have approximately the same length, about 3.1 ± 0.3 nm and an average stacking of 2 slabs. After additive impregnation on the dried CoMo catalysts, the MoS2 nanocrystallites size remains unchanged.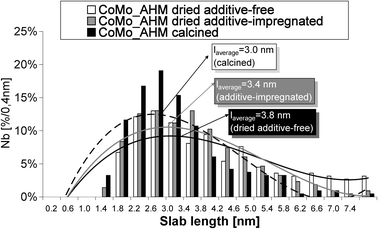 | ||
| Fig. 6 Comparison of MoS2 nanocrystallites length. The distribution in size was determined by TEM for the CoMo_AHM (D), CoMo_AHM (C) and CoMo_AHM (D) +TEG catalysts. The curved lines are guidelines for the eyes. | ||
The dried catalysts exhibit slightly higher MoS2 nanocrystallite sizes in agreement with their lower Mo/Al ratio (Fig. 3). The average length is about 3.7 nm.
Catalytic results
The catalysts were tested for toluene hydrogenation. In order to compare the various catalysts, it is necessary to take into account that they exhibit various P/Mo ratios. As explained before, higher P/Mo ratios could induce an over-estimation of the hydrogenation performances, due to the apparition of acid surface sites. The isomerization of the cyclohexane present in the feed with toluene allows us to assess the acid strength of the catalysts (Table 1). It appears that for a similar impregnation solution, dried, calcined and additive-impregnated catalysts exhibit the same isomerization level, but very different hydrogenation performances. This suggests that the post-treatment (dried, calcined or additive-impregnated) does not affect the acidic properties and that hydrogenation properties may be compared. Moreover, even the catalysts prepared with high P/Mo ratios of 0.40 or 0.57 do not exhibit a significant increase in isomerization properties (multiplied by two here). Acidic catalysts (not reported here) would have exhibited 5 or 6 times the isomerization rate, confirming that the isomerization level is not significant here. Thus, it has been considered that the hydrogenation performances only account for the active phase modifications.The hydrogenation results are shown in Fig. 7. The hydrogenation constant expressed in mole of toluene converted per mole of molybdenum and per hour was plotted as a function of the effective amount of the “CoMoS” phase (atomic concentration as obtained by XPS from eqn (3) and shown in Fig. 7). At low CoMoS content, the hydrogenation constant increases linearly with the amount of cobalt atoms in the CoMoS phase. Afterwards, it remains constant. These results confirm the trend previously reported9,10 for calcined CoMo catalysts.
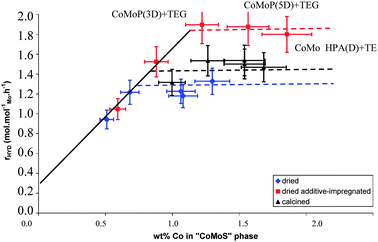 | ||
| Fig. 7 Toluene hydrogenation activity (per mole of Mo) as a function of the effective amount of the CoMoS phase (wt%) quantified by XPS for the dried, calcined and dried additive-impregnated catalysts. | ||
Nevertheless, compared to the additive-free catalysts, the additive-impregnated catalysts tend to reach their activity threshold at higher hydrogenation activity although they apparently exhibit the same amount of the “CoMoS” phase. In the case of additive free catalysts, there is also a difference observed between calcined and dried samples. The calcined ones exhibit slightly higher maximal activities.
DFT analysis on the effect of CoMo mixed sites on toluene adsorption
In order to further understand the role of mixed sites located on the M-edge of a CoMoS catalyst on toluene hydrogenation activity, we investigate the thermodynamic stability of toluene as a function of the M-edge sites present under reaction conditions of toluene hydrogenation (as used experimentally). The various toluene adsorption modes have been investigated for 5 types of M-edge sites as shown in Fig. 8. The energy values of the most stable adsorption modes on each type of M-edge are reported in Table 3. The exchange with one S-atom from the edge was also investigated by considering mixed sites with 12.5% S.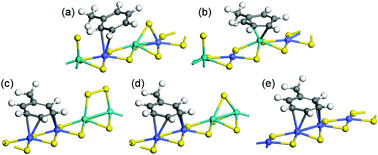 | ||
| Fig. 8 Toluene adsorption modes of the M-edge of a CoMoS catalyst: (a) η2-Co on 50% Co and 25% S with alternated Co–Mo–Co–Mo, (b) η6-Mo on 50% Co and 12.5% S with alternated Co–Mo–Co–Mo, (c) η4-CoCo on 50% Co and 25% S with Co–Co–Mo–Mo pairing, (d) η4-CoCo on 50% Co and 12.5% S with Co–Co–Mo–Mo pairing, (e) η4-CoCo on 100% Co, 0% S. Color legend: yellow balls: sulphur, green balls: molybdenum, blue balls: cobalt. | ||
The adsorption energy on the edges with the highest sulfur coverage (25% S) is isoenergetic, while it is exothermic for edges which are more depleted by sulfur atoms (0% S or 12.5% S). In addition, the sole adsorption configuration involving a Mo site and a high coordination mode for toluene (η6-CoCo) is the one involving a mixed site with an alternated Co–Mo–Co–Mo edge and 12.5% S (Fig. 8b). Indeed, in all other cases, the Mo-sites are saturated by S-atoms interacting more strongly with the Mo Lewis site than with the Co site as already found in previous DFT studies.23 This preferential affinity of S atoms for the Mo site implies that toluene is adsorbed in a low coordination mode (η2-Co) for the alternated Co–Mo–Co–Mo edge with 25% S (Fig. 8a). By contrast, on the paired Co–Co–Mo–Mo edge, the S-atoms preferentially located on the Mo sites do not hinder the toluene adsorption in a high coordination mode η4-CoCo, (Fig. 8c and d). A detailed electronic analysis reported in ref. 45 highlights the quantitative relationship between the interaction energies of the toluene molecule with the surface and the electronic contributions of the metallic edge sites to the molecules.
We now consider the thermodynamic diagram of the stable species present on the M-edge: it has been constructed in a similar way to that described in previous works.44,55 Under conditions close to reaction conditions used in toluene hydrogenation (−1 < ΔμS < −0.8 eV), it appears that the lowest energy curves (green ones) shown in Fig. 9 correspond to toluene adsorbed on the mixed sites with 12.5% S coverage: with Co–Co–Mo–Mo pairing or with an alternated Co–Mo–Co–Mo configuration. The 25% S coverage would stabilise toluene adsorption only under more sulphiding conditions. However, under more sulfiding conditions (ΔμS > −0.6 eV), we cannot exclude that the high coverage of sulfur species (50% S as found in ref. 23) may block the edge sites and prevent toluene adsorption. Note that the shaded region of high chemical potential of S was partially investigated because it goes beyond our reaction conditions.
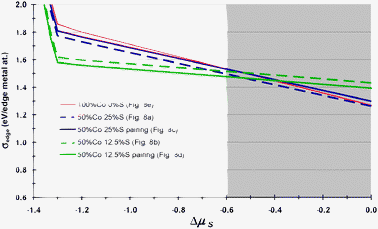 | ||
| Fig. 9 Edge energy of the toluene molecule adsorbed on the CoMoS M-edge with full or partial Co decoration as a function of ΔμS. Results reported in the shaded region are partial (not all S-coverages have been investigated) because they do not correspond to conditions explored in our experiments. | ||
By contrast, toluene adsorption on the fully promoted M-edge (red curves) appears to be less energetically favorable. Due to the sulfo-reductive conditions imposed in experiments, this result reveals the key role of mixed sites for toluene adsorption which may be beneficial for hydrogenation activity as well. This analysis will provide a clearer explanation as to why these mixed sites represent a driving force for the toluene hydrogenation activity of additive-impregnated catalysts (see discussion).
CoMo(P) catalysts: optimal morphologies and edge decorations
Keeping the formalism of the geometrical model earlier proposed by Kasztelan et al.22 and, as more recently revisited and quantified by Marchand et al.,12 on the basis of DFT modeling,23,43 we define the morphology of the CoMoS crystallite by two geometrical parameters for a given slab length: nM and nS, which, respectively, stand for the number of atoms on the M-edge and on the S-edge. According to DFT calculations,23,43 the CoMoS crystallites exhibit a hexagon-like two-dimensional morphology with a proportion of M-edge of about 0.5, which allows us to use the following equation (eqn (12)):| nM = nS | (12) |
From TEM results, it is known that the average slab length is about 3.1 nm for the calcined and additive-impregnated catalysts or 3.7 nm for the dried catalyst, leading to eqn (13) for calcined and additive-impregnated catalysts and eqn (14) for additive-free dried catalysts.
| d(Mo–Mo) × (nM + nS) = 3.1 nm | (13) |
| d(Mo–Mo) × (nM + nS) = 3.7 nm | (14) |
Combining eqn (12) and (13) or (12) and (14) leads to nM = nS = 6 for calcined and additive-impregnated dried catalysts and nM = nS = 7 on additive-free dried catalysts, as the best compromise between hexagonal crystallites predicted from DFT and particle sizes determined by TEM.
It may be relevant to combine these theoretical results with XPS and TEM results in order to provide new insights about atomistic decoration of the nanocrystallites, according to the CoMo precursors and the type of catalysts (dried additive-free, calcined, dried additive-impregnated).
The average promoter-to-molybdenum decoration ratio in the nanocrystallites determined by XPS and reported in Table 2 does not exceed the maximum decoration ratio (full cobalt decoration at the edges) determined from hexagonal morphology and TEM sizes:43 0.49 if nM = nS = 5 (3.2 nm) and 0.40 if nM = nS = 6 (3.8 nm). This means that a certain proportion of Mo edge atoms remains not substituted by cobalt.
The number and nature of promoted edge sites is determined from the general rules derived from previous results combining DFT and XPS analysis,12,23,43 which may be shortly summarized as follows:
(i) the S-edge is fully decorated by cobalt atoms whereas,
(ii) a mixed Co–Mo site corresponds to one cobalt atom close to one molybdenum atom located either at the M-edge or at the corner of the hexagonal crystallite depending on the Co/Mo values.
As explained in Methods, the mixed sites are present either in an alternated Co–Mo–Co–Mo configuration or in a pairing Co–Co–Mo–Mo configuration (see Fig. 1). As also shown in the previous DTF analysis, these sites play a key role during the toluene adsorption step. In what follows, we investigate whether a quantitative correlation between the number of mixed sites and the activity measured in toluene hydrogenation can be highlighted.
Combining the XPS results and the definition of CoMo mixed sites, we quantify the number of mixed sites for each catalyst (Table 4). The number of mixed sites obtained as a function of the promoter-to-molybdenum atomic ratio in the CoMoS phase is plotted for both experimental sizes and also for various other sizes as shown in Fig. 10.
| Catalysts | State | Effective amount of Mo (mol%) | MoS2 (%) | Effective amount of Mo in MoS2 (mol%) | Number of mixed sites per Mo in MoS2 crystallites | Effective amount of mixed sites (mol%) |
|---|---|---|---|---|---|---|
| D stands for dried catalyst; C for calcined catalyst; _AHM for standard preparation (ammonium heptamolybdate and cobalt nitrate); _HPA for cobaltomolybdate heteropolyanions. | ||||||
| CoMo_AHM | (D) | 1.20 | 87 | 1.04 | 0.084 | 0.09 |
| (C) | 1.83 | 66 | 1.21 | 0.036 | 0.04 | |
| (D)+TEG | 1.42 | 80 | 1.14 | 0.078 | 0.09 | |
| CoMo_HPA | (D) | 1.83 | 70 | 1.28 | 0.052 | 0.07 |
| (C) | 1.83 | 81 | 1.48 | 0.004 | 0.01 | |
| (D)+TEG | 1.89 | 85 | 1.61 | 0.033 | 0.05 | |
| CoMoP(1) | (D) | 1.52 | 78 | 1.19 | 0.108 | 0.13 |
| (C) | 1.83 | 77 | 1.41 | 0.124 | 0.17 | |
| (D)+TEG | 1.68 | 80 | 1.34 | 0.121 | 0.16 | |
| CoMoP(3) | (D) | 1.63 | 75 | 1.22 | 0.051 | 0.06 |
| (C) | 1.83 | 71 | 1.30 | 0.026 | 0.03 | |
| (D)+TEG | 1.85 | 78 | 1.44 | 0.121 | 0.17 | |
| CoMoP(5) | (D) | 1.68 | 75 | 1.26 | 0.011 | 0.01 |
| (C) | 1.42 | 77 | 1.09 | 0.096 | 0.10 | |
| (D)+TEG | 1.63 | 81 | 1.32 | 0.036 | 0.05 | |
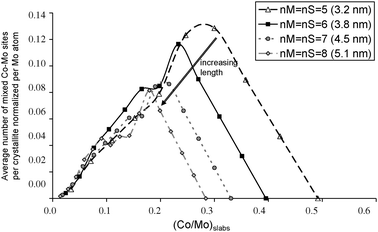 | ||
| Fig. 10 Average number of total mixed Co–Mo sites per crystallite normalized per molybdenum atom in the nanocrystallites as a function of the cobalt-to-molybdenum atomic ratio in the CoMoS nanocrystallites (nM = nS = 5 to 8). | ||
Impact of the promoter-to-molybdenum atomic ratio on toluene hydrogenation performances
It is now possible to normalize the activity in toluene hydrogenation by the effective amount of the “CoMoS” phase (atomic concentration as obtained by XPS from eqn (3)). These normalized activities have been plotted as a function of the decoration ratio (promoter-to-molybdenum atomic ratio in the crystallites obtained from eqn (4)) for additive-free dried, additive-impregnated dried and calcined catalysts (Fig. 11). It is striking to observe that for all catalysts two regions exist. At a low Co/Mo ratio in the crystallites, the activity normalized per cobalt introduced in the CoMoS phase is first quasi constant up to (Co/Mo)slabs < 0.25–0.30. Then, for higher Co/Mo ratio, i.e. for (Co/Mo)slabs > 0.30, the activity becomes lower and remains constant at this level. This trend has been rationalized by the appearance/disappearance of mixed Co–Mo sites on the edges of the crystallites.15 By using the hexagonal model and the average number of mixed Co–Mo sites per crystallite (Fig. 10), it is possible to deepen one's understanding of these results: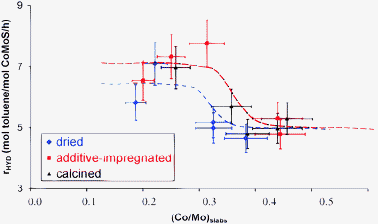 | ||
| Fig. 11 Toluene hydrogenation activity normalized per mol of cobalt atoms in the CoMoS phase as a function of the decoration ratio (Co/Mo atomic ratio in the CoMoS nanocrystallites as quantified by XPS (Tables 1 and 2), see eqn (4)). | ||
(i) When increasing the decoration ratio (Co/Mo)slabs from 0 to 0.25, Co atoms may only decorate S-edge sites.15 Crystallites with fully decorated S-edges may coexist with non-decorated MoS2 crystallites. Hence, the number of Co implied in the CoMoS phase increases more rapidly than the number of mixed Co–Mo sites. This is the reason why the activity does not increase with (Co/Mo)slabs. When reaching the total saturation of the S-edge, cobalt starts to decorate the M-edges as explained in ref. 13 and 15. The number of mixed sites continues to increase as a function of (Co/Mo)slabs which keeps the normalized activity at a high level.
(ii) The inflexion point at (Co/Mo)slabs = 0.25 or 0.30 corresponds to the maximum number of mixed sites per crystallite and per molybdenum atom for both particles sizes (Fig. 10).
(iii) For (Co/Mo)slabs > 0.30, Co also decorates M-edges. However, since the number of mixed Co-Mo sites decreases (Fig. 10) there is a small decrease in the activity normalized per Co atom in the CoMoS phase compared to smaller values of (Co/Mo)slabs.
The decrease in the hydrogenation activity starts at a higher value of (Co/Mo)slabs for additive-impregnated dried or calcined catalysts than for additive-free dried catalysts. This different catalytic behavior can be actually rationalized by the curves shown in Fig. 10 which are governed by the particle sizes.
This rationalization is summarized by plotting the normalized activities versus the amount of mixed sites, as shown in Fig. 12, which reveals an almost linear trend between activity and the amount of mixed Co–Mo sites. Hence the three different families of catalysts are unified by this rather universal trend driven by the amount of mixed sites. This trend thus reveals that the use of additives is beneficial to increase the number of mixed Co–Mo sites. Fig. 12 reveals that even without mixed sites, the hydrogenation activity is non-negligible. Indeed, it should be cautiously underlined that a molar percent of mixed sites close to 0 correspond to a CoMoS phase where the crystallite edges are fully covered by Co atoms (no Mo sites available at the edge). Such a situation at the M-edge is depicted in Fig. 8a. Hence, this result shows that it is not enough to maximize the number of promoter atoms at the edges and that the mixed sites enable the further increase of the hydrogenation performances beyond those of systems where mixed Co–Mo sites are not favored. In particular, fully promoted sites (see Fig. 8e) would be less optimal for toluene hydrogenation. Our DFT analysis explains the origin of the beneficial effect of Co–Mo mixed sites on toluene adsorption at the M-edge. Moreover, the situation depicted in Fig. 8d enables the presence of toluene adsorption with a neighboring edge sulfur atom. In the presence of hydrogen, this edge sulfur atom may lead to the formation of a sulfhydryl group involved in the hydrogenation step of toluene. A previous kinetic analysis of toluene hydrogenation has shown that the simultaneous presence of sulfhydryl in close vicinity of the toluene reactant is optimal for the hydrogenation activity.57,58 Such a situation is obtained only if Co (bearing toluene) and Mo (bearing sulfur) sites are simultaneously present at the edges. Last but not least, the value of the linear correlation slope shown in Fig. 12 furnishes an estimate of the intrinsic activity gain normalized by the number of mixed sites.
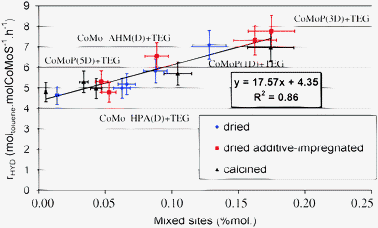 | ||
| Fig. 12 Toluene hydrogenation activity normalized per mol of cobalt atoms in the “CoMoS” phase as a function of the effective amount of mixed sites (calculated from the amount of mixed sites per sulfided molybdenum and the sulfided amount). | ||
As a consequence, we have demonstrated that, whatever the preparation routes, there would be no fundamental difference in terms of the nature of active sites. The main reason for the difference of activity appears to be the number of mixed Co–Mo sites tuned by the total amount of cobalt atoms in decoration (CoMoS phase). In such a way, the preparation route (nature of the oxide precursors, additive impregnation,…) determines the Mo and Co surface coverages, dispersions, and the vicinity between the Co and Mo atoms. This obtained structural “starting point” will be determining the amount of mixed sites generated at the end of the sulfidation step.
From catalytic precursors to the mixed sites
The role of the glycol-based additives in HDT catalyst activity enhancement may be discussed with respect to the species present on the catalyst surface as previously reported.42 Before the activation stage and during the impregnation of the CoMo catalyst precursors, it has been shown that a redissolution–redispersion phenomenon is produced after the additive impregnation step, leading to the formation of the Anderson heteropolyanion AlMo6O24H63−59 This redissolution phenomenon is however limited by the low solubility of this Anderson HPA. In the case of dried CoMoP catalysts (P/Mo molar ratio greater than 0.4), characterization of additive-containing catalysts evidenced additionally PCoMo11O407− species. Redissolution and redispersion due to the additive impregnation are thus enhanced because phosphomolybdic species have a much higher solubility than the AlMo6O24H63− HPA.The higher dispersion due to additive impregnation is maintained after sulfidation and accounts for a higher number of active sites, and particularly mixed sites, thus leading to higher catalytic performances. Indeed, three of the dried additive-impregnated catalysts are particularly active (Fig. 7): CoMoP (5D) + TEG, CoMoP(3D) + TEG, CoMo_HPA(D) + TEG.
The CoMoP(3D) + TEG catalyst exhibits a high amount of mixed sites (Table 4), which explains their high performances. Nevertheless, CoMoP(5D) + TEG and CoMo_HPA(D) + TEG catalysts do not exhibit the highest amount of mixed sites (Table 4). In fact, the reason why those catalysts are more active originates from their effective amount of the “CoMoS” phase (Fig. 5). Indeed, those catalysts exhibit the highest amounts (0.58 and 0.71 mol, Fig. 5, from Table 2).
Conclusions
This paper has investigated the properties of the CoMoS active phase for different preparation methods (additive-impregnated catalyst, additive-free catalyst calcined or dried) combining TEM and XPS results. TEM has shown that the mean particle sizes are about 3.1 nm and do not depend on the catalytic precursors except for the additive-free dried catalysts exhibiting higher sizes: 3.7 nm. XPS quantification of the Mo species has shown that 75% of the Mo species are present in the MoS2 phase whatever the preparation route. A slightly higher sulfidation (ca. 85%) rate seems to be obtained due to additive impregnation.The molybdenum to aluminum surface coverage ratio (Mo/Al) ranking is in the following order: additive-free dried < additive-impregnated dried < calcined, but is not significantly modified by the impregnating solution used. The same ranking is obtained for the cobalt to aluminum ratio (Co/Al).
The decomposition of the XPS spectrum has enabled the quantification of the “CoMoS” phase and the determination of the decoration ratios of the CoMoS nanocrystallites. Except at low P/Mo ratio, there is no significant effect with the additive impregnation. The promotion ratio remains close to 55%. The additive impregnation modifies the “CoMoS” amount.
With the help of DFT calculations, a model has been proposed to explain the catalytic results obtained in toluene hydrogenation. First, those results highlight that the formation of the “CoMoS” phase is required but not sufficient to maximize the performances and that the number of Co–Mo mixed edge sites determines the catalytic activity. These results thus emphasize the key role of Co–Mo mixed sites for aromatic hydrogenation reactions. Moreover, the catalytic performances of additive-free dried, additive-impregnated dried and calcined catalysts are coherently linked to the amount of Co–Mo mixed sites. As a consequence, the use of additives enables us to maximize the number of Co–Mo mixed sites which is responsible for the different catalyst activities, rather than to produce catalytic active sites of a different nature. To our knowledge, this study represents the first rational interpretation of the role of this class of additives on the CoMoS active phase. In the future, it may be interesting to explore how this analysis can be extended to other types of additives and promoters (such as Ni).
References
- M. Breysse, R. Frety, B. Benaïchouba and P. Bussière, Radiochem. Radioanal. Lett., 1983, 59, 265–271 CAS.
- M. Breysse, R. Frety, M. Vrinat, P. Grange and M. Genet, Appl. Catal., 1984, 12(2), 165–170 CrossRef CAS.
- S. M. Bowens, D. C. Koningsberger, V. H. J. De Beer, S. A. Louwers and R. Prins, Catal. Lett., 1990, 5, 273–283 CrossRef.
- B. R. G. Leliveld, J. A. J. Van Dillen, J. W. Geus and D. C. Koningsberger, J. Phys. Chem. B, 1997, 101, 11160–11171 CrossRef CAS.
- L. Medici and R. Prins, J. Catal., 1996, 163, 38–49 CrossRef CAS.
- M. Breysse, B. A. Bennet, D. Chadwick and M. Vrinat, Bull. Soc. Chim. Belg., 1981, 90, 1271–1278 CrossRef CAS.
- I. Alstrup, I. Chorkendorff, R. Candia, B. S. Clausen and H. Topsoe, J. Catal., 1982, 77, 397–409 CrossRef CAS.
- A. D. Gandubert, C. Legens, D. Guillaume, S. Rebours and E. Payen, Surf. Interface Anal., 2006, 28, 206–209 CrossRef.
- L. Coulier, V. H. J. de Beer, J. A. R. van Veen and J. W. Niemantsverdriet, Top. Catal., 2000, 13, 99–108 CrossRef CAS.
- F. B. Garreau, H. Toulhoat, S. Kasztelan and R. Paulus, Polyhedron, 1986, 5, 211–217 CrossRef CAS.
- S. Houssenbay, S. Kasztelan, H. Toulhoat, J. P. Bonnelle and J. Grimblot, J. Phys. Chem., 1989, 93, 7176–7180 CrossRef CAS.
- K. Marchand, C. Legens, D. Guillaume and P. Raybaud, Oil Gas Sci. Technol., 2009, 64(6), 719–730 CrossRef CAS.
- L. Coulier, V. H. J. de Beer, J. A. R. van Veen and J. W. Niemantsverdriet, J. Catal., 2001, 197, 26–33 CrossRef CAS.
- A. D. Gandubert, C. Legens, D. Guillaume, S. Rebours and E. Payen, Oil Gas Sci. Technol., 2007, 62, 79–89 CrossRef CAS.
- A. D. Gandubert, E. Krebs, C. Legens, D. Costa, D. Guillaume and P. Raybaud, Catal. Today, 2008, 130, 149–159 CrossRef CAS.
- J. V. Lauritsen, M. Nyberg, J. K. Nørskov, B. S. Clausen, H. Topsøe, E. Lægsgaard and F. Besenbacher, J. Catal., 2004, 224, 94–106 CrossRef CAS.
- P. Raybaud, Appl. Catal., A, 2007, 322, 76–91 CrossRef CAS.
- J. F. Paul, S. Cristol and E. Payen, Catal. Today, 2008, 130, 139–148 CrossRef CAS.
- H. Schweiger, P. Raybaud and H. Toulhoat, J. Catal., 2002, 212, 33–38 CrossRef CAS.
- L. S. Byskov, B. Hammer, J. K. Nørskov, B. S. Clausen and H. Topsøe, Catal. Lett., 1997, 47, 177–182 CrossRef CAS.
- H. Schweiger, P. Raybaud, G. Kresse and H. Toulhoat, J. Catal., 2002, 207, 76–87 CrossRef CAS.
- S. Kasztelan, H. Toulhoat, J. Grimblot and J. P. Bonnelle, Appl. Catal., A, 1984, 13, 127–159 CrossRef CAS.
- E. Krebs, B. Silvi and P. Raybaud, Catal. Today, 2008, 130, 160–169 CrossRef CAS.
- F. L. Deepak, R. Esparza, B. Borges, X. Lopez-Lozano and M. Jose-Yacaman, ACS Catal., 2011, 1, 537–543 CrossRef CAS.
- A. V. Pashigreva, G. A. Bukhtiyarova, O. V. Klimov, Y. A. Chesalov, G. S. Litvak and A. S. Noskov, Catal. Today, 2010, 149, 19–27 CrossRef CAS.
- H. L. Yin, T. N. Zhou, Y. Q. Liu, Y. M. Chai and C. G. Liu, J. Fuel Chem. Technol., 2011, 39(2), 109–115 CrossRef CAS.
- K. Al-Dalama and A. Stanislaus, Thermochim. Acta, 2011, 520, 67–74 CrossRef CAS.
- E. Payen, D. Guillaume, C. Lamonier and K. Marchand, Method of preparing at least one cobalt and/or nickel salt of at least one Anderson's heteropolyanion combining molybdenum and cobalt or nickel in its structure, European Patent 1892038 A1, February 27, 2008.
- J. Escobar, J. A. Toledo, A. W. Gutiérrez, M. C. Barrera, M. A. Cortés, C. Angeles and L. Díaz, Stud. Surf. Sci. Catal., 2010, 175, 767–770 CrossRef CAS.
- M. A. Lélias, P. J. Kooyman, L. Mariey, L. Oliviero, A. Travert, J. van Gestel, J. A. R. van Veen and F. Maugé, J. Catal., 2009, 267(1), 14–23 CrossRef.
- S. Takao, U. Kikoo, U. Kisao, U. Yuji, Y. Eiji, Y. Hideharu, A. Satoshi and K. Tetsuo, EP0601722A1, 1994.
- R. Iwamoto, N. Kagami and A. Iino, J. Jap. Pet. Inst., 2005, 48(4), 237–242 CrossRef CAS.
- P. Mazoyer-Galliou, C. Geantet, F. Diehl, C. Pichon, T. S. Nguyen and M. Lacroix, Oil Gas Sci. Technol., 2005, 60(5), 791–799 Search PubMed.
- D. Nicosia and R. Prins, J. Catal., 2005, 229, 424–438 CrossRef CAS.
- T. S. Nguyen, S. Loridant, C. Lorentz, T. Cholley and C. Geantet, Appl. Catal., B, 2011, 107(1–2), 59–67 CrossRef CAS.
- M. S. Rana, J. Ramirez, A. Guttierez-Alejandre, J. Ancheyta, L. Cedeno and S. K. Maity, J. Catal., 2007, 246, 100–108 CrossRef CAS.
- J. Escobar, M. C. Barrera, J. A. Toledo, M. A. Cortés-Jacome, C. A. Chavez, A. Nunez, V. Santes, E. Gomez, L. Diaz, E. Romero and J. G. Pacheco, Appl. Catal., B, 2009, 88, 564–575 CrossRef CAS.
- W. C. Cheng and N. P. Luthra, J. Catal., 1988, 109, 163–169 CrossRef CAS.
- A. Griboval, P. Blanchard, E. Payen, M. Fournier and J. L. Dubois, Catal. Today, 1998, 45, 277–283 CrossRef CAS.
- C. Martin, C. Lamonier, M. Fournier, O. Mentré, V. Harlé, D. Guillaume and E. Payen, Chem. Mater., 2005, 17, 4438–4448 CrossRef CAS.
- C. Lamonier, C. Martin, J. Mazurelle, V. Harlé, D. Guillaume and E. Payen, Appl. Catal., B, 2007, 70, 548–556 CrossRef CAS.
- V. Costa, K. Marchand, M. Digne and C. Geantet, Catal. Today, 2008, 130(1), 69–74 CrossRef CAS.
- E. Krebs, A. Daudin and P. Raybaud, Oil Gas Sci. Technol., 2009, 64(6), 707–718 CrossRef CAS.
- E. Krebs, B. Silvi, A. Daudin and P. Raybaud, J. Catal., 2008, 260, 276–287 CrossRef CAS.
- E. Krebs, B. Silvi and P. Raybaud, J. Comput. Theor. Chem., 2009, 5, 580–593 CrossRef CAS.
- J. P. Perdew and Y. Wang, Phys. Rev. B: Condens. Matter, 1992, 45, 13244–13249 CrossRef.
- G. Kresse and J. Furthmüller, Comput. Mater. Sci., 1996, 6, 15–50 CrossRef CAS.
- G. Kresse and J. Furthmüller, Phys. Rev. B: Condens. Matter, 1996, 54, 11169–11186 CrossRef CAS.
- P. Hohenberg and W. Kohn, Phys. Rev. B, 1964, 136, 864–871 CrossRef.
- W. Kohn and L. J. Sham, Phys. Rev. A, 1965, 140, 1133–1138 Search PubMed.
- G. Kresse and D. Joubert, Phys. Rev. B: Condens. Matter, 1999, 59, 1758–1775 CrossRef CAS.
- P. Raybaud, J. Hafner, G. Kresse, S. Kasztelan and H. Toulhoat, J. Catal., 2000, 189, 129–146 CrossRef CAS.
- C. Arrouvel, M. Breysse, H. Toulhoat and P. Raybaud, J. Catal., 2005, 232, 161–178 CrossRef CAS.
- L. S. Byskov, J. K. Norskov, B. S. Clausen and H. Topsoe, Catal. Lett., 2000, 64, 95–99 CrossRef CAS.
- F. Pelardy, C. Dupont, C. Fontaine, E. Devers, A. Daudin, F. Bertoncini, P. Raybaud and S. Brunet, Appl. Catal., B, 2010, 97, 323–332 CrossRef CAS.
- J. V. Lauritsen, J. Kibsgaard, G. H. Olesen, P. G. Moses, B. Hinnemann, S. Helveg, J. K. Norskøv, B. S. Clausen, H. Topsøe, E. Lægsgaard and F. Besenbacher, J. Catal., 2007, 249, 220–233 CrossRef CAS.
- N. Guernalec, C. Geantet, T. Cseri, M. Vrinat, H. Toulhoat and P. Raybaud, Dalton Trans., 2010, 39, 8420–8422 RSC.
- N. Guernalec, C. Geantet, P. Raybaud, T. Cseri, M. Aouine and M. Vrinat, Oil Gas Sci. Technol., 2006, 61, 515–525 CAS.
- X. Carrier, J. F. Lambert and M. Che, J. Am. Chem. Soc., 1997, 119, 10137–10146 CrossRef CAS.
| This journal is © The Royal Society of Chemistry 2013 |


