An experimental investigation of catalytic oxidation of propane using temperature controlled Pt, Pd, SnO2, and 90% SnO2–10% Pt catalysts
J. T.
Wiswall†
a,
M. S.
Wooldridge
*ab and
H. G.
Im
a
aDepartment of Mechanical Engineering, University of Michigan, 2350 Hayward Street, Ann Arbor, MI, 48109-2125, USA. E-mail: jwiswall@umich.edu; mswool@umich.edu; hgim@umich.edu; Tel: +1 734-936-0349
bDepartment of Aerospace Engineering, University of Michigan, Ann Arbor, MI, 48109, USA
First published on 25th October 2012
Abstract
A stagnation-point flow reactor was used to study the catalytic activity of platinum (Pt), palladium (Pd), tin dioxide (SnO2), and 90% SnO2–10% Pt (by mass) to premixed propane and air reactants at atmospheric pressure. The Pt and Pd catalysts served as the baseline by which to compare catalyst performance. The stagnation surface temperature was controlled to maintain constant temperatures using an electric heater in order to eliminate heat transfer effects on catalyst performance. The activity of each catalyst was evaluated for catalyst stagnation surface temperatures ranging from 300 °C to 800 °C. Three fuel–air equivalence-ratio conditions were studied (ϕ = 0.67, 1.0 and 1.5). The CO2, CO, O2, and C3H8 in the exhaust gases were measured to quantify the activity of each catalyst. The effect of heat released by surface reaction was quantified by the heater power required to stabilize the stagnation plane at the prescribed temperature. The catalysts, excluding 100% SnO2, exhibited comparable trends with respect to propane oxidation as a function of stagnation-plane temperature. While 100% SnO2 showed no catalytic activity at any conditions, the 90% SnO2–10% Pt catalyst showed significant activity to propane oxidation. The lowest catalyst activation temperature of the experiments (Tsurface = 250 °C) was observed for the 90% SnO2–10% Pt catalyst for ϕ = 1.5. The results demonstrate potential of Pt/SnO2 as a fuel oxidation catalyst.
1. Introduction
Catalysts are well known as critical components in conventional exhaust gas after-treatment systems, like automotive three-way catalysts. Another important future for catalysts is in direct integration into combustion systems. Catalysts provide the means to achieve stable low temperature combustion with high fuel conversion rates and low NOx emissions.1 At the macro-scale, catalysts are being revisited for integration directly into the internal combustion (I.C.) engine combustion chamber.2 At the small scale, catalyst applications are expanding to microcombustors to improve stability, control and conversion efficiency at low temperatures.3,4This work focuses on improving the quantitative understanding of the effects of different catalysts on propane oxidation as a function of well-defined catalyst temperatures. In addition to catalytic combustion of propane for power generation, total oxidation of propane is an important process for removal of volatile organic compound emissions,5 and catalytic dehydrogenation of propane is important for propane synthesis.6,7 Platinum and other noble metals are recognized as active catalysts for propane oxidation and combustion at low temperatures, whereas transition metal oxides are not.1 This work compares the performance of platinum, palladium, tin dioxide, and platinum supported tin dioxide as propane oxidation catalysts over a range of fixed catalysts temperatures. The platinum and palladium catalysts served as a baseline by which to compare catalyst performance. It is well known that the noble metal support affects catalyst performance,1,8 and tin has been demonstrated to increase the catalytic activity of Pt in CO oxidation.9 Tin is also an important co-catalyst in propane dehydrogenation.10–12 This work presents the first demonstration of tin dioxide as a platinum support for catalytic oxidation of propane in direct comparison with undoped tin dioxide.
The catalysts were evaluated using a stagnation-point flow reactor (SFR) to facilitate comparison between the catalysts and to control the chemical reaction and flow residence times. In previous experiments by Wiswall et al.,13 the catalytic activity of platinum for oxidation and combustion of methane and propane was evaluated in terms of lean extinction limits (combustion) and heat release at the catalyst surface (oxidation). In this work, a range of controlled surface temperatures and exhaust gas measurements were used to quantify the activity for each catalyst to oxidation of propane–air mixtures.
2. Experimental
Fig. 1 is a photograph of the stagnation flow reactor. A detailed description of the reactor, including dimensioned schematics, can be found in Wiswall et al.14 A propane–air mixture is impinged on the stagnation surface where the catalyst material is mounted. The flow direction in the image is from bottom to top. A transparent borosilicate glass cylinder isolates the test gases from the ambient air. The stagnation plane is located 2.62 nozzle diameters from the nozzle exit, and the exhaust gases are sampled after the gases pass over the catalyst. A pyrolytic graphite heater (Momentive Ceramics Inc.) mounted in a stainless steel enclosure, purged with nitrogen, is used to heat the stagnation surface and the catalyst. The temperature at the stagnation plane, Ts, is measured using a k-type thermocouple probe (Omega Inc.) placed in a groove machined into the stainless steel mounting surface with an uncertainty of ±18 °C. The temperature of the surface is controlled using a PID temperature controller. All experiments were conducted at atmospheric pressure.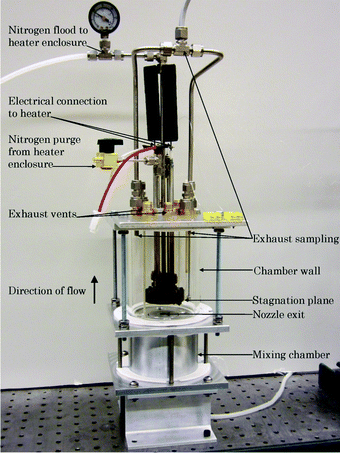 | ||
| Fig. 1 The stagnation flow reactor. | ||
The flow is conditioned to create a uniform 1-dimensional velocity profile at the exit of the nozzle. Premixed propane and air are directed into the mixing chamber of the SFR which is filled with glass beads. An alumina monolith with 600 cells per square inch (Corning Inc.) is placed within the mixing chamber immediately downstream of the glass beads. After the monolith, the mixture flows through a nozzle with an 18.26![[thin space (1/6-em)]](https://www.rsc.org/images/entities/char_2009.gif) :
:![[thin space (1/6-em)]](https://www.rsc.org/images/entities/char_2009.gif) 1 area contraction ratio (exit diameter = 10 mm) and impinges on the heated stagnation plane. The nozzle exit plane is located 26.2 mm from the stagnation surface, yielding a separation distance to nozzle diameter ratio of 2.62.
1 area contraction ratio (exit diameter = 10 mm) and impinges on the heated stagnation plane. The nozzle exit plane is located 26.2 mm from the stagnation surface, yielding a separation distance to nozzle diameter ratio of 2.62.
High purity propane (99.9%) and synthetic dry air (oxygen 20.995%–21.005% balance nitrogen) are used for the reactant gases. The volumetric flow rates of the propane and air are measured using rotameters. The rotameter uncertainty is two standard deviations of five repeated calibrations, giving a 95% confidence level. The equivalence ratio based on the molar fuel-to-air ratio, ϕ, and average nozzle-exit velocity, are calculated from the volumetric flow rates of propane and air. The uncertainties in the equivalence ratio (±8%) and average nozzle exit velocity (±4%) are determined by the flow meter uncertainties.
Three equivalence ratios, ϕ = 0.67, 1, and 1.50, were studied in this work, each with an average nozzle exit velocity of v = 1.2 ± 0.05 m s−1. A constant velocity at the exit of the nozzle sets the flow residence time at a constant value for all conditions. The catalyst surface temperature was set at 14 prescribed temperature increments in the range from 100 °C to 800 °C. Using this approach, the ratio of characteristic time for heterogeneous reaction to characteristic flow residence time decreases with increasing surface temperature. This can also isolate the effects of catalyst morphology from heat transfer physics of the catalyst.
Five materials were investigated for catalytic activity: platinum (99.99% purity), palladium (99.9% purity), SnO2 (99.9% purity), 90% SnO2–10% Pt (by mass), and quartz. Alfa Aesar was the vendor for all catalyst materials and the quartz substrate. Although metal foils and metal films do not represent typical forms for catalysts applications, foil data are available for comparison in the literature, and the Pt and Pd data provide data for comparison with the doped and undoped tin dioxides. For each material, the catalyst and substrate were mounted on the heated stainless steel surface using clips. The platinum catalyst used in this study was deposited by physical vapor deposition (PVD) onto a square quartz wafer (25.4 × 25.4 × 1 mm). In order to form a stable bond of the platinum to the quartz, a layer of titanium (10 nm thickness) was first deposited on the quartz wafer. A 100 nm thick layer of platinum was then coated on the titanium layer. The PVD process is expected to produce a dense catalyst layer. Foil (25 μm thick, 99.9% purity) was used for the palladium catalyst. The SnO2 catalyst was prepared by drop evaporation of a 15% SnO2 (10–15 nm) colloidal dispersion in H2O solution. The solution was evenly dispersed over a quartz wafer (25.4 × 25.4 × 1 mm) and dried at 110 °C for 0.5 h. The deposition and drying processes were performed three times to ensure good coverage (50 μm approximate thickness of the films). The 90% SnO2–10% Pt catalyst was prepared by mixing SnO2 powder (99% purity, <10 μm) with Pt powder (99.9% purity, 0.2–1.6 μm). The powder mixture was dispersed in methanol using a 60% powder −40% methanol (by mass) mixing ratio to form a paste. The paste was spread on a quartz wafer (25.4 × 25.4 × 1 mm) and dried at 110 °C for 0.5 hours. The 90% SnO2–10% Pt powder did not yield a strong bond to the quartz surface; however, the film was mechanically stable for the duration of the experiments. Only fresh (newly prepared) catalysts were used in the study. Catalyst aging effects were not considered.
The product gases were sampled from the exhaust manifold at the top of the catalyst chamber. An exhaust gas analyzer based on non-dispersive-infrared (NDIR) sensors (Horiba, MEXA-584L) was used to measure the volume fractions of O2, CO, CO2, NO and unburned hydrocarbons (nominally C3H8) in the exhaust. The uncertainties are ±0.025% for CO, ±2.5% for C3H8, ±0.15% for CO2, and ±1.5% for O2. The minimum detection limit for NO is 25 ppm. The C3H8 in the exhaust gases interferes with the CO2 measurements, and the results were corrected for the interference. The species measurements do not include corrections for enrichment or dilution due to the location of the gas sampling in the SFR or due to non-isokinetic sampling. The unburned hydrocarbons are reported as propane without further analysis. The exhaust gases were cooled to room temperature before entering the gas sensing unit by flow through coiled aluminum tubing. A separator was used to remove any condensed water as the exhaust gases are cooled; however, the dew point of the exhaust gas was below room temperature for all the experiments discussed in this work.
3. Results
Results for the exhaust gas measurements as a function of the stagnation surface temperature are presented in Fig. 2 for the different catalyst materials and the fuel rich condition, ϕ = 1.50. The data for the quartz surface show no catalytic activity at any temperature. Similar behavior was observed for quartz at the other equivalence ratios. The results demonstrate that the quartz substrate and the supporting infrastructure of the SFR do not interfere with the catalyst measurements, and the quartz data provide a non-catalytic reference for the other materials.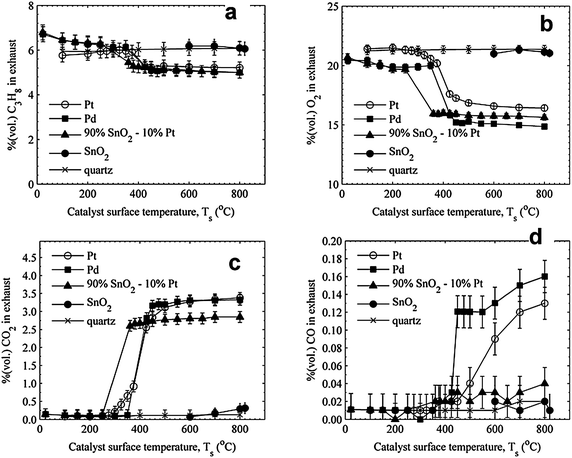 | ||
| Fig. 2 Comparison of (a) C3H8, (b) O2, (c) CO2, and (d) CO measurements for ϕ = 1.50 propane–air mixtures for catalyst and baseline (quartz) stagnation surfaces. | ||
The platinum, palladium and 90% SnO2–10% Pt show the same general trends for all fuel–air mixtures studied. The chemical species measured in the exhaust as a function of catalyst surface temperature define a curve showing the increase in heterogeneous reactivity as a function of temperature. At low surface temperatures, the CO2 mole fraction remains below the detectible limit of the gas analyzer. As the stagnation surface temperature increases, a threshold is observed where the CO2 mole fraction increases abruptly. Further increase in the stagnation temperature has minimal effect on the measured CO2 for ϕ = 1.50. The increase in CO2 mole fraction occurs simultaneously to a decrease in the O2 and C3H8 measurements. The data for the 90% SnO2–10% Pt catalyst is shifted approximately 60 °C lower than that of pure Pt and Pd. The maximum level of CO2 is comparable for the three catalysts. However, at the stagnation temperatures at which CO2 reaches its stable value (Ts > 420 °C), CO is observed at different levels depending on the choice of catalyst: in larger amounts for the Pt and Pd catalysts, and in a significantly reduced amount for the 90% SnO2–10% Pt catalyst. As seen in Fig. 2, the SnO2 catalyst performance at ϕ = 1.50 was indistinguishable from the baseline non-reactive quartz. Coking was not observed on any of the catalyst materials at any of the equivalence ratios considered.
Note that complete oxidation of the propane does not occur even for the most reactive catalyst materials, and propane is observed in the exhaust gases at all conditions. This is attributed to flow short-circuiting, where a portion of the flow bypasses the stagnation plane without opportunity to react. As seen in Fig. 2, the proportion of propane consumed is approximately equal to one-third the amount of CO2 produced, indicating high conversion efficiencies for the propane that does interact with the stagnation surface. However, measurements of the conversion efficiencies cannot be assigned without quantitative knowledge of the dilution of the exhaust gases by flow short-circuiting. The data can be compared quantitatively for relative performance between the catalysts. For the ϕ = 1.5 condition, Pd and Pt yield the same amount of CO2 after the initial increase in catalytic activity. The 90% SnO2–10% Pt yields CO2 values approximately 15% lower than Pd and Pt.
Fig. 3 presents the electric power required by the heater to maintain the stagnation surface temperature for each of the catalysts at the ϕ = 1.5 condition. The SnO2 and quartz surfaces exhibit monotonic behavior. The Pt, Pd and 90% SnO2–10% Pt surfaces each reach conditions where the stagnation surface temperatures are self-sustaining and no power is required by the heater. A local maximum in power coincides with catalyst temperatures where the abrupt increase in CO2 occurs.
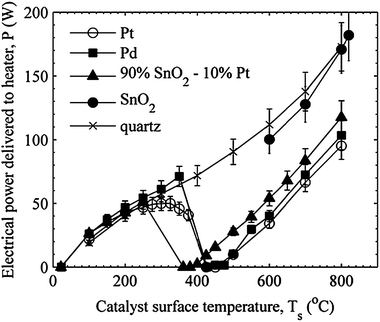 | ||
| Fig. 3 Power required to maintain the stagnation surface temperature for ϕ = 1.50 for the catalyst and baseline (quartz) materials tested. | ||
The exhaust gas measurements for the stoichiometric ϕ = 1.0 condition are presented in Fig. 4. The quartz data are omitted for clarity. The SnO2 remains inactive at these conditions. The heterogeneous reactivity curve for Pd shifted to a higher temperature than for the fuel rich case, whereas for Pt, the curve shifted to a lower temperature. The heterogeneous reactivity curve for the 90% SnO2–10% Pt catalyst was approximately the same at ϕ = 1.0 as it was for ϕ = 1.50. The CO2 data further indicate the Pt is the most effective catalyst, while Pd produces similar levels of CO2, but only at surface temperatures >600 °C. The 90% SnO2–10% Pt produces approximately half the CO2 as Pt even at the highest stagnation temperatures. The heater power data for ϕ = 1.0 presented in Fig. 5 show that none of the catalysts reach conditions of self-sustaining surface temperatures. Further, at high surface temperatures (>550 °C) the 90% SnO2–10% Pt requires higher heater power than the Pt and Pd catalysts for equivalent surface temperatures.
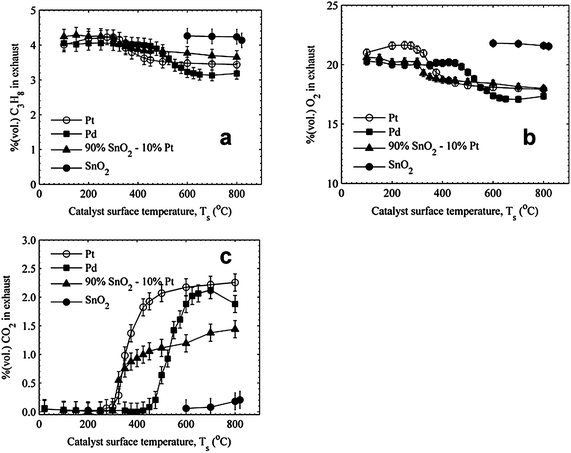 | ||
| Fig. 4 Comparison of (a) C3H8, (b) O2, and (c) CO2 measurements for ϕ = 1.00 propane–air mixtures. | ||
 | ||
| Fig. 5 Power required to maintain the stagnation surface temperature for ϕ = 1.00. | ||
The exhaust gas measurements for the ϕ = 0.67 condition are presented in Fig. 6. The trends are similar to the ϕ = 1.0 results, with similar heterogeneous reactivity curves: reactivity data for Pt and 90% SnO2–10% Pt starting at approximately the same temperature and Pd starting at a higher temperature. The relative amounts of CO2 produced are similar to the ϕ = 1.0 data as well, with Pt and Pd producing the same mole fraction of CO2 for Ts > 600 °C and 90% SnO2–10% Pt producing approximately half the CO2 as Pt for temperatures above where the CO2 stabilizes. The heater power data for ϕ = 0.67 are presented in Fig. 7 and, as with ϕ = 1.0, none of the catalysts reach conditions of self-sustaining surface temperatures; however, at high surface temperatures (>550 °C) the catalysts all require approximately the same heater power for equivalent surface temperatures.
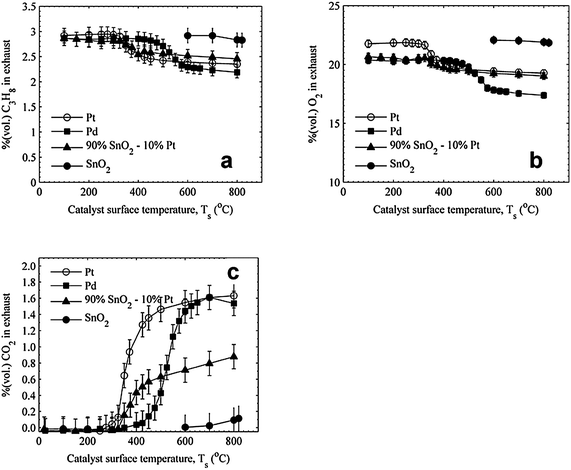 | ||
| Fig. 6 Comparison of (a) C3H8, (b) O2, and (c) CO2 measurements for ϕ = 0.67 propane–air mixtures. | ||
 | ||
| Fig. 7 Power required to maintain the stagnation surface temperature for ϕ = 0.67. | ||
4. Discussion
Platinum catalysts
While there have been numerous studies of propane/air combustion and oxidation using platinum in packed bed reactors, there are few studies which used stagnation flow reactors (SFR), and there are no other studies of SnO2 or Pt/SnO2 SFR catalysts for comparison. In SFR studies, the catalytic activity is often characterized by ignition temperatures. Veser and Schmidt15 determined homogenous and heterogeneous ignition temperatures for propane and air mixtures using a platinum foil catalyst mounted as the stagnation plane of a SFR. Dupont et al.16 sampled the exhaust gases exiting the reactor to determine the efficiency of platinum for CH4 conversion and CO selectivity, and defined homogeneous ignition as the advent of CO in the exhaust gases. Williams et al.17 and Veser and Schmidt15 defined the heterogeneous ignition temperature as the catalyst temperature at which a large increase in heat release occurred. They also defined the autothermal temperature as the catalyst temperature at which the foil could sustain high temperatures without electric heating, and the extinction temperature as the catalyst temperature at which a large decrease in heat release occurred. Ikeda et al.18 defined the heterogeneous ignition temperature as the catalyst temperature at which there is a temperature increase without electric heating of the catalyst and the extinction temperature as the catalyst temperature at which there is a temperature decrease without cooling of the catalyst.The threshold catalyst temperature at which large heat release occurs can be used to define heterogeneous reaction ignition and extinction points. However, when comparing results from different experimental set-ups, it is important to recognize that such temperatures are strongly connected with the heat transfer of the experimental apparatus. In addition, hysteresis has been observed in heterogeneous ignition and extinction points in stagnation point flow reactors,15,17,18 which may also be influenced by the properties of the experimental set-up. The results of the current work for the platinum stagnation plane can be compared to heterogeneous ignition and extinction temperatures reported in the study by Veser and Schmidt.15 In their experiments, heating power was controlled and the steady state catalyst temperature was measured as the dependent parameter. Fig. 8 shows the results of the current work with the heater power plotted on the horizontal axis. For an experiment where heater power is the independent parameter, as the power increases, the stagnation plane temperature shows an abrupt increase as the reaction shifts from surface reaction rate limited to diffusion rate limited. In the current work, similar to the study by Veser and Schmidt,15 the temperature where the first maximum in power occurs is defined as the heterogeneous ignition temperature. An incremental increase in power delivered to the catalyst at this point would cause an abrupt shift to a higher catalyst temperature. Likewise, at the temperature where there is a local minimum in power delivered to maintain the catalyst temperature, an incremental decrease in power will cause an abrupt shift to a lower temperature. The temperature where the local minimum occurs corresponds to the extinction temperature reported in Veser and Schmidt.15
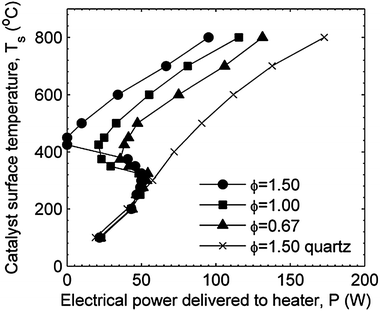 | ||
| Fig. 8 Platinum catalyst and baseline (quartz) surface temperatures presented as a function of electric power to the heater. The local maximum and minimum in power correspond to the heterogeneous ignition and extinction temperatures similar to the definitions used in Veser and Schmidt.15 | ||
Fig. 9 presents the ignition and extinction temperatures for platinum from the current work with the data reported by Veser and Schmidt.15 The ignition temperature reported by Veser and Schmidt is slightly lower than that measured in the current work, and the extinction temperature measured by Veser and Schmidt15 is at a significantly higher temperature than the current work. The differences between the ignition and extinction temperatures are attributed to a lower heat loss from the catalyst for the Veser and Schmidt study. In the current work, the quartz data show the heater power required to maintain the stagnation plane temperature with no surface reaction. Lower heat loss is expected to cause the slope of the power curves in Fig. 8 to increase; in other words, the stagnation plane would achieve a higher temperature for a given heater power if heat loss were lower. This shift in the curve causes the difference between the local maximum power and local minimum power temperatures to increase. The differences in heat transfer between the Veser and Schmidt study and the current work are attributed to differences in the experimental conditions; in particular, the convective heat transfer losses are higher in the current work due to a factor of 5 higher flow velocities.
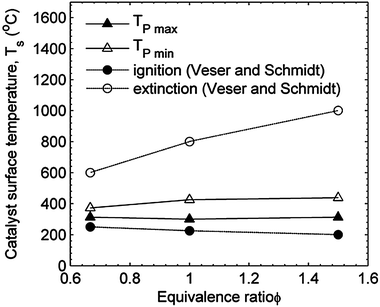 | ||
| Fig. 9 Comparison of platinum data for heterogeneous ignition and extinction temperatures with results of Veser and Schmidt.15 | ||
Comparing catalyst materials
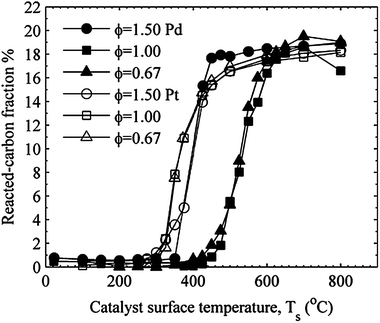
The platinum, palladium, and 90% SnO2–10% Pt catalysts were most active at the fuel-rich condition. The palladium and 90% SnO2–10% Pt also exhibited the lowest ignition temperatures at the fuel-rich condition. The difference between the local-maximum and local-minimum power is greatest for the fuel-rich case, which shows the heat release due to propane oxidation increases for increasing fuel–air mixtures for all three catalysts well into the fuel rich regime.The relative effectiveness of the catalysts can be compared using the fraction of carbon atoms in the exhaust in the form of CO2 and CO. The reacted carbon fraction is defined as
| (χCO2 + 3χC3H8 + χCO)products = (3χC3H8)reactants |
Fig. 10 compares the reacted carbon fraction for the platinum and palladium catalysts, and Fig. 11 compares the reacted carbon fraction for the platinum and the 90% SnO2–10% Pt catalysts. The high temperature values for χc are approximately equal for all three fuel–air mixtures and for both the palladium and platinum catalysts. Since the inlet carbon is entirely supplied by propane, the mass of the propane oxidized must be greatest for the fuel-rich case for an equal reacted carbon fraction for the three fuel air mixtures. The 90% SnO2–10% Pt catalyst shows an even greater increase in the catalytic activity for increasing equivalence ratio as the high temperature reacted carbon fraction increases with increasing equivalence ratio. This shows an even stronger sensitivity to fuel-rich mixtures for the 90% SnO2–10% Pt catalyst.
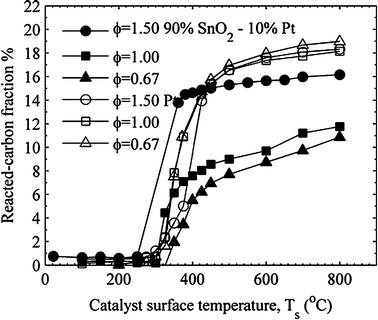 | ||
| Fig. 11 Comparison of reacted carbon for the platinum and 90% SnO2–10% Pt catalysts. | ||
The fact that the measured CO2 volume fractions stabilize at high temperatures indicate that the propane oxidation process is limited by the diffusion of gas species to and from the surface, and the step increase in CO2 in the exhaust gases as a function of the stagnation surface temperature marks the transition from surface kinetic reaction-limited to diffusion-limited oxidation. The rapid increase in propane oxidation is consistent with the highly temperature sensitive nature of the heterogeneous kinetic rates. As the temperature increases further, the oxidation rate is limited by the rate of convective and diffusive transport, which is fixed by the given inlet flow conditions.
5. Conclusions
The platinum, palladium, and 90% SnO2–10% Pt catalysts transitioned from surface reaction limited operation to diffusion limited operation over the range of experimental conditions studied. The catalysts exhibited comparable trends with respect to propane oxidation as a function of stagnation-plane temperature. The results show in the diffusion limited regime (i.e. high temperatures) the different catalyst materials can yield comparable fuel conversion performance, notably at fuel rich conditions (Pd, Pt and 90% SnO2–10% Pt). While 100% SnO2 showed no catalytic activity, 10% Pt by mass activated SnO2 significantly to propane oxidation.While varying equivalence ratio, the reaction heat release increases well into the fuel-rich regime. The platinum, palladium and 90% SnO2–10% Pt catalysts show the highest catalytic activity in the fuel rich case, which is quantified by the reduced heater power required and the increased mass of propane converted to CO2. Palladium and 90% SnO2–10% Pt show increasing catalyst activation temperature required for decreasing ϕ, and platinum shows an approximately constant catalyst-activation temperature for decreasing ϕ (Tsa = 310 °C). The 90% SnO2–10% Pt catalyst shows the lowest catalyst activation temperature of the experiments which occurs for the ϕ = 1.5 mixture (Tsa = 250 °C). The heterogeneous ignition temperature for the 90% SnO2–10% Pt catalyst was approximately 60 K lower than for Pt for fuel rich conditions. The heterogeneous ignition temperature for the 90% SnO2–10% Pt catalyst was lower than Pd for all equivalence ratios.
As demonstrated in the study, the platinum additive was critical to activate the tin dioxide at equivalent thermal conditions to the 100% SnO2. The 90% SnO2–10% Pt catalyst was not optimized for performance in terms of morphology, particle, size, Pt loading, etc. Consequently, the Pt/SnO2 data should be considered introductory performance results under well controlled thermal conditions; not the best performance the SnO2–Pt system can achieve. Further work is needed to assess detailed quantitative performance metrics of the SnO2–Pt system. Nevertheless, the results of the present study indicate Pt/SnO2 has considerable promise as an effective fuel oxidation catalyst.
References
- M.-Y. Kim, S. M. Park, G. Seo and K.-S. Song, Catal. Lett., 2010, 138, 205 CrossRef CAS.
- W. Zeng and M. Xie, Chem.–Eng. J., 2008, 139, 380 CrossRef CAS.
- T. Okamasa, L. Gwang-Goo, Y. Suzuki, N. Kasagi and S. Matsuda, J. Micromech. Microeng., 2006, 16, S198 CrossRef CAS.
- Y. Men, G. Kolb, R. Zapf, H. Pennemann and V. Hessel, Chem. Eng. Res. Des., 2009, 87, 91 CrossRef CAS.
- M. N. Taylor, W. Zhou, T. Garcia, B. Solsona, A. F. Carley, C. J. Kiely and S. H. Taylor, J. Catal., 2012, 285, 103 CrossRef CAS.
- B. K. Vu, M. B. Song, I. Y. Ahn, Y.-W. Suh, D. J. Suh, J. S. Kim and E. W. Shin, J. Ind. Eng. Chem., 2011, 17, 71 CrossRef CAS.
- Y. Zhang, Y. Zhou, L. Huang, M. Xue and S. Zhang, Ind. Eng. Chem. Res., 2011, 50, 7896 CrossRef CAS.
- J. E. Park, K. B. Kim, K. W. Seo, K. S. Song and E. D. Park, Res. Chem. Intermed., 2011, 37, 1135 CrossRef CAS.
- D. Teschner, A. Wootsch and Z. Paál, Appl. Catal., A, 2112, 411–412, 31 Search PubMed.
- B. K. Vu, E. W. Shin, I. Y. Ahn, J.-M. Ha, D. J. Suh, W.-I. Kim, H.-L. Koh, Y. G. Choi and S.-B. Lee, Catal. Lett., 2012, 142, 838 CrossRef CAS.
- Y. Zhang, Y. Zhou, A. Qiu, Y. Wang, Y. Xu and P. Wu, Catal. Commun., 2006, 7, 860 CrossRef CAS.
- Y. Wang, Y. Wang, S. Wang, X. Guo, S.-M. Zhang, W.-P. Huang and S. Wu, Catal. Lett., 2009, 132, 472 CrossRef CAS.
- J. T. Wiswall, M. S. Wooldridge and H. G. Im, J. Heat Transfer, 2009, 131, 111201 CrossRef.
- J. T. Wiswall, M. S. Wooldridge and H. G. Im, Combust. Sci. Technol., 2011, 183, 540 CrossRef CAS.
- G. Veser and L. D. Schmidt, AIChE J., 1996, 42, 1077 CrossRef CAS.
- V. Dupont, S. H. Zhang and A. Williams, Chem. Eng. Sci., 2001, 56, 2659 CrossRef CAS.
- W. R. Williams, M. T. Stenzel, X. Song and L. D. Schmidt, Combust. Flame, 1991, 84, 277 CrossRef CAS.
- H. Ikeda, J. Sato and F. A. Williams, Surf. Sci., 1995, 326, 11 CrossRef CAS.
Footnote |
| † Present address: Alcoa Inc., 100 Technical Drive, Alcoa Center, PA, 15069, USA. |
| This journal is © The Royal Society of Chemistry 2013 |


