Resolving kinetics and dynamics of a catalytic reaction inside a fixed bed reactor by combined kinetic and spectroscopic profiling
Michael
Geske
,
Oliver
Korup
and
Raimund
Horn
*
Fritz Haber Institute of the Max Planck Society, Faradayweg 4-6, 14195 Berlin, Germany. E-mail: horn_r@fhi-berlin.mpg.de; Tel: +49 30 84134585
First published on 17th August 2012
Abstract
The oxidative dehydrogenation of ethane to ethylene was studied using a MoO3 based catalyst supported on γ-alumina spheres. The measurement of species and temperature profiles through a fixed bed reactor shows for the first time the reaction pathways inside the catalyst bed directly. Oxidative dehydrogenation of ethane to ethylene and water occurs on the redox sites of MoO3 only in the presence of gas phase oxygen. Further oxidation of the product ethylene to carbon dioxide occurs as a subsequent reaction step by lattice oxygen of MoO3. Deep oxidation of ethylene to CO2 is the only existing reaction in the absence of gas phase oxygen reducing MoO3 to MoO2. Oxidation of CO and C2H6 by lattice oxygen does not occur. The reduction of the catalyst can be followed by in situ fiber Raman spectroscopy as a function of the oxygen partial pressure. The in situ Raman measurements are complemented by ex situ micro-Raman spectroscopy and X-ray diffraction. The combined measurement of kinetic and spectroscopic reactor profiles presents a novel approach in in situ catalysis research to establish catalyst structure–function relationships under technically relevant conditions of temperature and pressure.
1 Introduction
During the last decades the spectroscopic characterization of working catalysts has received more and more attention because it was observed that many catalysts adapt dynamically to the reaction conditions e.g. by changing their particle structure1 or bulk and surface composition.2 Due to physical constraints of many spectroscopic methods, the usage of one and the same reactor for kinetic measurements and spectroscopic characterization of the working catalyst is rather the exception than the rule. As reviewed by Meunier,3 most spectroscopic cells are designed for optimal spectroscopic performance but are kinetically often ill defined. Only a few methods such as UV/Vis,4,5 Raman,5 EPR6 and X-ray absorption spectroscopy5,7 have been successfully used to measure kinetic and spectroscopic data simultaneously in kinetically well defined fixed bed tubular reactors. In the field of IR spectroscopy deficiencies of standard cells, e.g. temperature gradients, are partly solved by optimizing the cell and flow geometry.8All in situ spectroscopic methods listed above employ electromagnetic radiation of different frequency which can either be guided into the reactor by means of optical fibers,4 interact with the catalyst through the reactor wall in a backscattering geometry9 or shine through the entire reactor in transmission geometry.7,8 Some of these methods even provide spatially resolved spectroscopic data illustrating how the catalyst adapts dynamically to the varying chemical potential along the flow direction of the reactor.7,9
Resolving spatial gradients in heterogeneous catalytic reactors becomes in fact more and more important as reviewed by Urakawa and Baiker.10 However, whereas spectroscopic profiling has been demonstrated for fixed bed reactors,7,9 simultaneous kinetic data have never been measured. On the other hand, whenever spatially resolved kinetic data were reported, e.g. in honeycomb catalysts11 or powdered catalysts12 corresponding spectroscopic data were missing. In the present work we combine both information for the first time by conducting spatially resolved kinetic and spectroscopic measurements in a fixed bed tubular reactor simultaneously.
To demonstrate the feasibility of this new method, the oxidative dehydrogenation (ODH) of ethane to ethylene (eqn (1)) on γ-Al2O3 supported MoO3 was chosen as test reaction.
| C2H6 + ½ O2 → C2H4 + H2O | (1) |
| ΔrH° (298.15 K) = −104.88 kJ mol−1 |
Ethane ODH lends itself as a test reaction because of the well known redox properties of this relatively simple catalyst13 and the superior Raman activity of MoO3.14 Beyond that, ethane ODH is interesting from a practical point of view for producing valuable ethylene from cheap and abundant ethane.15
The advantage of resolving spatial profiles in a fixed bed reactor is that transient processes are translated into spatial gradients which can be conveniently measured at steady state. In contrast to most in situ studies, the spectroscopic technique is here adapted to a kinetically well defined reactor instead of using a cell optimized for spectroscopy at the expense of an ill defined flow and mixing pattern. Spectroscopic profiling reveals how the catalyst adapts to the changing chemical potential along the flow coordinate. Quantifying temperature and spectroscopic profiles along the central symmetry line of the reactor has the advantage that no heat losses occur, which is a severe problem if windows are used for optical access.8 As such, spatial reactor profiles are a powerful add-on to classic kinetic studies,16 pulse experiments17 or isotope transients18,19 which have all been applied to study ODH reactions on transition metal oxide catalysts.
In summary, measuring spatially resolved kinetic and spectroscopic profiles along the centerline of a fixed bed tubular reactor is a novel approach to resolve the dynamics of a catalyst under working conditions.
2 Materials and methods
γ-Alumina spheres from Sasol (1 mm diameter, BET surface area: 157 m2 g−1) were used as support and ammonium heptamolybdate tetrahydrate (AHM, (NH4)6Mo7O24·4H2O, 99.0%) from Merck as molybdenum precursor. Gases were supplied by Westfalen: argon (99.999%), ethane (99.95%) and oxygen (99.999%).2.1 Catalyst preparation
A 50 wt% γ-alumina supported molybdenum oxide catalyst was prepared by incipient wetness impregnation. The required mass of AHM was dissolved in deionized water at a pH of 5.2. In total 20 impregnation steps were conducted and the solvent was evaporated between each step at 120 °C for 2 h. After the impregnation the catalyst was dried at 120 °C overnight and then calcined at 540 °C in static air for 6 h. Catalyst coating reduced the available surface area from 157 m2 g−1 of the pure support to 56 m2 g−1. Prior to the reactor measurements the catalyst was activated in a flow of oxygen (100 ml min−1) at 540 °C for 1 h.2.2 Experimental setup
A detailed description of the reactor setup capable of measuring species, temperatures and spectroscopic profiles through a fixed bed tubular reactor can be found in an earlier publication by the authors.20 In short the reactor consists of a fused silica tube with an inner diameter of 18 mm and a wall thickness of 10 mm in which a 3 cm high bed of catalyst spheres is positioned. A picture and a drawing of the experimental setup are presented in Fig. 1.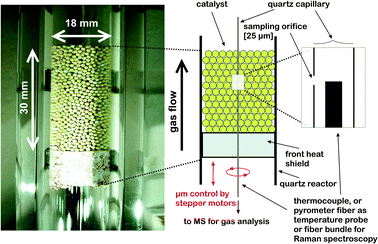 | ||
| Fig. 1 Experimental setup for simultaneous measurement of kinetic and spectroscopic profiles through a fixed bed tubular reactor. (Left) Picture of the catalyst bed of γ-alumina spheres loaded with nominal 50 wt% MoO3. (Right) Schematic and zoom of the probe geometry. | ||
The catalyst bed was positioned on top of a cylindrical piece of ceramics, termed front heat shield in Fig. 1, which was gas tightly fitted in the reactor tube by wrapping it with a ceramic mate (Interam 3 M). The front heat shield also served as a flow distributor and as a guide for the fused silica sampling capillary (OD 700 μm, ID 520 μm) running through the catalyst bed. A small fraction of the reacting gas mixture was sampled through an orifice (25 μm) in the wall of the sampling capillary and transferred to a mass spectrometer (QME 200, Balzers) for analysis. A thermocouple (OD 350 μm) for measuring the gas phase temperature was inserted into the capillary with its tip aligned with the sampling orifice. The capillary-thermocouple assembly could be translated up and down through the catalyst bed with μm resolution by means of a stepper motor to measure spatial profiles of all major species and the gas temperature. The overall spatial resolution of the sampling probe is mainly governed by the intake region of the sampling orifice and the scan velocity. For the present work it amounts to about 100 μm. For spatially resolved Raman spectroscopy the thermocouple was exchanged with the optical fiber sensor and also aligned with the sampling orifice.
The optical setup comprising the sensor and the coupling optics for the incoming laser and the emitted Raman/Rayleigh light is shown in Fig. 2. The optical sensor consists of a beveled fiber with an outer diameter of 140 μm positioned inside a light guiding capillary with an inner and outer diameter of 150 μm and 363 μm respectively (both Polymicro Technologies). The laser light was coupled to the central fiber using a 10× objective and was emitted at the beveled end of the fiber as a sharp ring illuminating the catalyst. Raman and Rayleigh scattered light from the catalyst was then collected by the likewise beveled end of the light guiding capillary. At the plane exit of the light guiding capillary the emitted light was collimated by a concave mirror, passed through a long range edge filter (RazorEdge 647.1 nm, SEMROCK) to remove Rayleigh scattered light and was focussed onto a fiber bundle transferring the light into a spectrometer for analysis. Each Raman spectrum was accumulated for 300 s at two wavelength ranges, 180–650 cm−1 and 650–1050 cm−1 respectively. A high resolution grating (1800 lines cm−1) was used to obtain high quality Raman spectra from the catalyst.
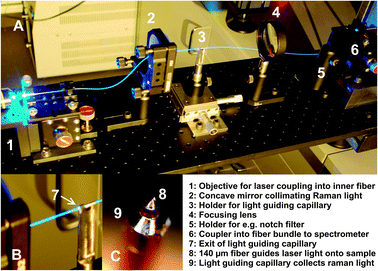 | ||
| Fig. 2 (A) Coupling scheme for fiber Raman spectroscopy. The sensor tip (C) is inserted in the sampling capillary of the spatial profile reactor20 and aligned with the sampling orifice. (B) Magnified view showing the end of the light guiding capillary bringing back Rayleigh and Raman light scattered by the catalyst. (C) Beveled fiber tip inside a light guiding capillary for irradiation and collection of scattered light perpendicular to the fiber axis. | ||
2.3 Catalyst characterization
The surface area of the catalyst was determined by nitrogen BET measurements at 77 K with an Autosorb-6B (Quantachrome). Phase composition was analyzed by X-ray diffraction (STOE STADI-P and Autosampler) over a 2θ range from 10° to 110° using the Kα line of copper. Raman measurements were conducted using the 647.1 nm line of an Ar–Kr laser (Series 2018, Spectra Physics) and the first stage of a triple spectrometer (TriVista TR 557, S&I GmbH) equipped with a CCD camera (Spec10: 100BR, Princton Instruments). The CCD camera was operated at −120 °C to minimize thermal noise. With the 1800 cm−1 grating in the spectrometer a resolution of about 0.4 cm−1 was reached. For ex situ analysis the spheres were analyzed under a Raman microscope (Olympus, BX51WI) equipped with a 10× objective. The laser power under the microscope was restricted to about 1 mW, avoiding beam damage to the sample as found by Tinnemans et al.21 For comparison, about 25 mW laser power was used at the exit of the fiber Raman sensor inside the profile reactor without damaging the sample because the laser light leaves the beveled fiber tip unfocused. The illuminated area is estimated to be 30 times larger than that below the microscope (Afiber ≈ 1 mm2vs. Amicroscope ≈ 0.03 mm2).3 Results and discussion
3.1 Kinetic measurement
Fig. 3 shows the gas species and catalyst temperature profiles measured through the MoOx/γ-Al2O3 catalyst bed under ethane ODH conditions on the left side and a photograph of the catalyst bed on the right side. In the following, the catalyst composition is loosely denoted MoOx, taking into account that the MoO3 present before reaction is partly reduced under reaction conditions. Oxygen is consumed within the first 19 mm of the bed, marked as point β in Fig. 3. The main reaction products in the oxidation zone are H2O, C2H4, CO and CO2. H2 formation is observed when gas phase oxygen is largely consumed.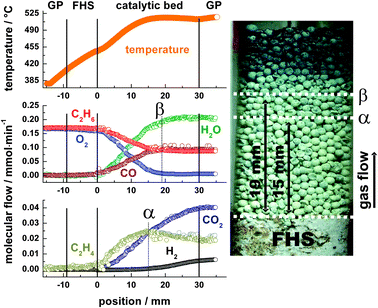 | ||
| Fig. 3 Species and temperature profiles for ethane ODH measured through a MoOx/γ-Al2O3 sphere bed at p = 1 bar. Point α marks the maximum C2H4 concentration, Point β marks the position of complete O2 conversion. GP denotes the gas phase before and after the catalyst bed and FHS the ceramic front heat shield. | ||
According to Heracleous et al.,22 CO2 is the major product (S > 70%) of ethane direct oxidation on strongly acidic OH-groups of the alumina support. Adsorbed ethane is totally oxidized on these OH groups without the possibility of desorption of intermediate products. If acidic OH groups of the alumina support were exposed, CO2 would appear readily at the beginning of the catalyst bed. As shown in Fig. 4 this is not the case because the high nominal MoO3 loading corresponds to about four times a monolayer covering the alumina sites completely (one monolayer coverage equals about 5 Mo units nm−2).23 Ethylene in contrast is formed on the redox sites of the catalyst.24 The same authors claim that further oxidation of ethylene occurs also on molybdenum redox sites. This reaction sequence is directly shown here for the first time on a catalyst under reaction conditions. Fig. 4 presents a close-up view of the C2H4 and CO2 profiles in the catalyst bed.
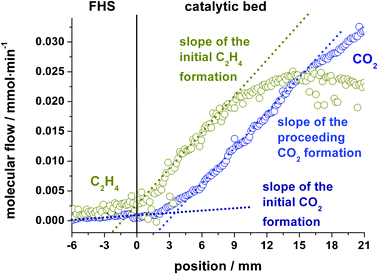 | ||
| Fig. 4 Initial slopes of C2H4 and CO2 profiles characteristic for a primary (>0) and secondary (∼0) oxidation product respectively. | ||
A linear regression of the initial slopes from the first two mm of the catalyst bed reveals that the primary product ethylene is formed with a non-zero slope, whereas the initial formation rate of CO2 from deep oxidation of ethane is close to zero (<20% of the ethylene value), marking CO2 as secondary product. Both maximum slopes of ethylene and CO2 in contrast are nearly 10 times larger than the initial CO2 formation rate showing a much faster production of CO2 from C2H4 than from direct ethane oxidation. However, ethane is readily oxidized to CO as indicated in Fig. 3 by the high initial CO formation at the entrance of the catalyst bed. Ethylene formation is clearly a catalytic process because nearly no C2H4 is formed in the catalytically inactive front heat shield (FHS). The formation of ethylene by oxidative dehydrogenation of ethane with gas phase oxygen and the combustion of ethylene by lattice phase oxygen leads to a maximum in the ethylene profile at about 15 mm, marked as α in Fig. 3. At point α the oxygen partial pressure in the gas stream has declined from initially 63 mbar to about 7 mbar. CO2 production continues even beyond the point of complete oxygen conversion β, indicating the participation of lattice oxygen as oxidizing agent. Interestingly the only carbon containing species with a finite consumption rate after point β is ethylene. This can be taken as evidence that lattice oxygen is responsible for deep oxidation of C2H4 to CO2, whereas the oxidation of CO and C2H6 by lattice oxygen is not detectable.
A calculation shows that when the experiment was interrupted, reduction of the last 10 mm of the catalyst bed from MoO3 to MoO2, the only reduced molybdenum phase detected by XRD and Raman spectroscopy, would have offered additional 6.5 mmol lattice oxygen taken as O2. Dividing this value by the CO2 formation rate after full O2 consumption (∼0.01 mmol min−1) and including also H2O formation (∼0.005 mmol min−1) shows that complete reduction of the bed would have required about seven more hours time on stream. Therefore, the catalyst downstream point B was not yet in steady state. Indeed it was visually observed that the spheres at the exit became darker with longer time on stream (MoO3 is colorless, MoO2 dark violet). H2 formation increases with increasing degree of reduction in the absence of gas phase O2.
3.2 In situ Raman profile measurements
The visually observed zoning of the catalyst bed was analyzed by spatially resolved in situ Raman spectroscopy using the novel fiber optic sensor shown in Fig. 2. Unfortunately the sensitivity of the Raman fiber sensor is not yet high enough to evaluate and follow the signals of all relevant vibrations such as that of Mo–O–Al, which was reported to be the catalytic active site.25Nevertheless it was possible to follow the reduction of crystalline MoO3, which exhibits a much higher Raman scattering cross section than all the other species present.26 Even though the trioxide might not be the active site for the catalytic conversion, it can be deduced from the species profiles that its lattice oxygen is responsible for ethylene oxidation to CO2. The high mobility of lattice oxygen at the local temperatures in the reactor is in good agreement with the findings by Ressler et al.27
At the entrance of the bed the catalyst spheres are yellow/grey and turn violet/black after about 19 mm, where the gas phase O2 partial pressure approaches zero (cf. Fig. 3). Fig. 5 shows exemplarily one Raman spectrum measured at the entrance region of the catalyst bed at 56 mbar O2 partial pressure (position 2.4 mm) together with a fused silica background which results from the fiber optic Raman sensor itself.
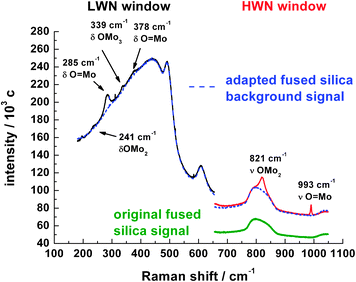 | ||
| Fig. 5 Combination of high and low wave number scans of a Raman spectrum from the entrance region at 2.4 mm. The dotted line represents the normalized background of the fused silica fiber Raman sensor used. | ||
For further analysis only the High Wave Number (HWN) part of the spectrum is used because the ν O![[double bond, length as m-dash]](https://www.rsc.org/images/entities/char_e001.gif) Mo (993 cm−1) and the ν Mo–O–Mo (821 cm−1) vibrations are the most intense and characteristic vibrations for MoO3. The Raman shifts and assignments are taken from Seguin et al.28
Mo (993 cm−1) and the ν Mo–O–Mo (821 cm−1) vibrations are the most intense and characteristic vibrations for MoO3. The Raman shifts and assignments are taken from Seguin et al.28
Fig. 6 shows the corrected Raman spectra in dependence of the sampling position. The procedure of how the Raman spectra of the species were extracted from the raw data and how the spectra were corrected for the local brightness of the catalyst bed is explained in Section 3.3. Without a quantitative analysis, which is beyond the scope of this paper, there is a clear correlation between the oxygen partial pressure indicated in blue in Fig. 6 and the oxidation state of the catalyst. With decreasing oxygen partial pressure the MoO3 crystallites become partly reduced and more defect rich.
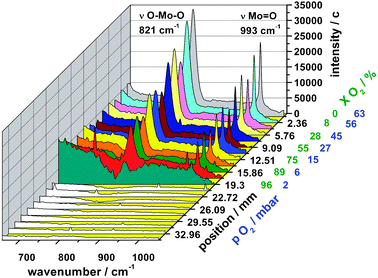 | ||
| Fig. 6 In situ HWN Raman spectra along the catalyst bed. MoO3 Raman signals vanish at the position where gas phase oxygen is almost fully consumed. | ||
As already discussed by Ressler et al.27 the transformation from MoO3 to MoO2 proceeds through a collapse of individual MoO3 layers. The reducing domain size of the trioxide goes along with a decrease of the Raman signal of MoO3 until all MoO3 signals disappear at around 19 mm where the catalyst is completely reduced to MoO2. This decline can be resolved by our fiber optic Raman probe, which has a spatial resolution of about 1 mm as shown in a previous work by the authors.29
3.3 Raman signal deconvolution
The collected Raman spectra are a superposition of three contributions: (i) the Raman spectrum of the catalyst, (ii) a constant fused silica Raman background generated inside the fiber and transmitted to the capillary by cross talk without leaving the fiber tip and (iii) a variable fused silica Raman background resulting from Raman scattered light generated inside the excitation fiber, emitted at the beveled fiber tip and recollected by the light guiding capillary.The constant fraction of the fused silica Raman background was measured by placing the Raman sensor outside the reactor in air. The fused silica Raman background measured at a certain position inside the catalyst bed was generally higher than the fused silica Raman background measured outside the reactor due to the additional variable portion of the background signal which is a measure of the darkness and self-absorption of the catalyst bed. To correct the catalyst Raman spectra for the latter, the fused silica Raman background measured outside the reactor was multiplied with a factor F to match the fused silica Raman background measured inside the catalyst bed (cf. Fig. 5 green spectrum vs. blue spectrum). The obtained background spectrum was subtracted from the local Raman spectrum inside the catalyst bed and the resulting difference spectrum was divided by (F − 1) to correct for the self-absorption of the catalyst bed (eqn (2)).
| Ssample,brightness corrected = Ssample/(F − 1) | (2) |
All changes in the brightness corrected Raman spectra, such as those shown in Fig. 6, are real and due to changes in the catalyst structure and composition.
3.4 Ex situ sphere bed analysis
The advantages of ex situ analysis are the often higher sensitivity and lower setup complexity. Especially for materials maintaining their bulk structure after reaction, ex situ investigations are still important. This was shown by the work of Ledoux et al. concerning carbon modified MoO3 in the n-butane dehydrogenation using XRD analysis for the determination of the phase composition.30Also in the present work, ex situ catalyst characterization was performed to cross check the results from the in situ measurements. The reaction was interrupted after 5 h time on stream. Catalyst spheres from three different regions of the catalyst bed were extracted; bright yellow/grey spheres from the inlet region (region A), grey spheres from about 19 mm downstream (region B) and dark spheres from the end of the catalyst bed (region C). Ex situ Raman spectra of these spheres measured under a Raman microscope are presented in Fig. 7.
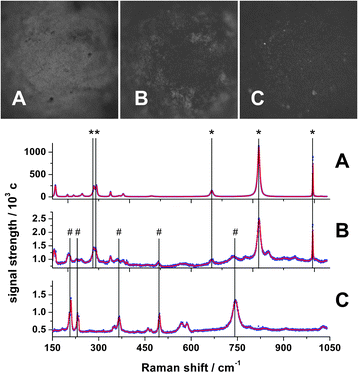 | ||
| Fig. 7 Photographs (top) and Raman spectra (bottom) of MoOx/γ-Al2O3 catalyst spheres corresponding to different positions in the catalyst bed. (A) Entrance region at the inlet O2 partial pressure of 63 mbar, (B) from about 19 mm where gas phase O2 is nearly fully consumed and (C) from the exit region. * denotes characteristic Raman bands of MoO3 and # Raman bands of MoO2. Unlabeled bands are listed in the text. | ||
A transformation of MoO3 to MoO2 is clearly visible in the oxygen depleted outlet. Characteristic Raman shifts for MoO3 are:28ν O![[double bond, length as m-dash]](https://www.rsc.org/images/entities/char_e001.gif) Mo: 993 cm−1, ν OMo2: 821 cm−1, ν OMo3: 666 cm−1 + 472 cm−1, δ O
Mo: 993 cm−1, ν OMo2: 821 cm−1, ν OMo3: 666 cm−1 + 472 cm−1, δ O![[double bond, length as m-dash]](https://www.rsc.org/images/entities/char_e001.gif) Mo: 378 cm−1, δ OMo3: 339 cm−1, δ O
Mo: 378 cm−1, δ OMo3: 339 cm−1, δ O![[double bond, length as m-dash]](https://www.rsc.org/images/entities/char_e001.gif) Mo: 292 cm−1 + 285 cm−1, δ O
Mo: 292 cm−1 + 285 cm−1, δ O![[double bond, length as m-dash]](https://www.rsc.org/images/entities/char_e001.gif) Mo2: 246 cm−1 + 218 cm−1 + 199 cm−1 and a deformation mode at 159 cm−1. Raman shifts for MoO2 (744 cm−1, 586 cm−1, 571 cm−1, 497 cm−1, 469 cm−1, 460 cm−1, 366 cm−1, 351 cm−1, 230 cm−1, 209 cm−1 and 203 cm−1) are not assigned to specific vibration modes, but are representative for this phase and described by Camacho et al.31 The dominant presence of the signals from the trioxide phase results from the much lower Raman cross section of the dioxide and strong self-absorption.32 Nevertheless, the coexistence of the trioxide and the dioxide phase at the position of full oxygen conversion is clearly visible in Fig. 7B.
Mo2: 246 cm−1 + 218 cm−1 + 199 cm−1 and a deformation mode at 159 cm−1. Raman shifts for MoO2 (744 cm−1, 586 cm−1, 571 cm−1, 497 cm−1, 469 cm−1, 460 cm−1, 366 cm−1, 351 cm−1, 230 cm−1, 209 cm−1 and 203 cm−1) are not assigned to specific vibration modes, but are representative for this phase and described by Camacho et al.31 The dominant presence of the signals from the trioxide phase results from the much lower Raman cross section of the dioxide and strong self-absorption.32 Nevertheless, the coexistence of the trioxide and the dioxide phase at the position of full oxygen conversion is clearly visible in Fig. 7B.
To confirm the Raman assignments, XRD diffractograms were measured on spheres from regions A, B and C. The results are shown in Fig. 8 together with a diffractogram of the ‘as prepared’ spheres. The main reflexes were assigned according to Regalbuto et al.33 and Kumari et al.34
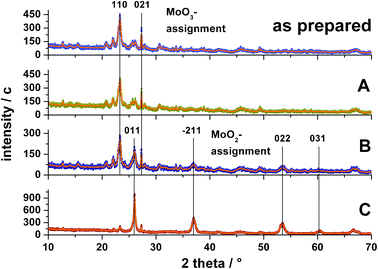 | ||
| Fig. 8 XRD diffractograms of ‘as prepared’ spheres and spheres after reaction taken from different positions inside the catalyst bed (symbols measured data, solid orange line 10 point FFT fit). (A) Spheres from inlet region showing only MoO3 reflexes. (B) Spheres from the oxygen depleted zone at about 19 mm showing a phase mixture of MoO2 and MoO3. (C) Spheres from the end of the catalyst bed showing predominantly MoO2 reflexes. | ||
4 Conclusion
The present work demonstrates for the first time combined kinetic and spectroscopic reactor profiles measured with high resolution through a fixed bed tubular reactor under in situ conditions. Oxidative dehydrogenation of ethane to ethylene on a nominally MoO3/γ-Al2O3 catalyst was chosen as a test reaction. Already a qualitative analysis of the obtained kinetic and spectroscopic data provides detailed insight into the kinetics of the reaction and the dynamics of the catalyst which are closely coupled. Ex situ catalyst characterization by micro-Raman spectroscopy and X-ray diffraction complements the in situ data. Fig. 9 summarizes the mechanistic picture that was derived schematically. In the entrance section of the catalyst bed where the gas phase oxygen partial pressure is still high (region A), MoOx is present as MoO3 which functions as a catalyst for oxidative dehydrogenation of ethane to ethylene and water. Also by reaction with gas phase oxygen, CO is formed in a rapid consecutive reaction. With decreasing gas phase oxygen partial pressure, MoO3 becomes gradually reduced to MoO2 such that the catalyst presents actually a phase mixture of MoO3 and MoO2 and possible suboxide phases that were not detected by methods used in this work. Interestingly, the lattice oxygen does hardly attack ethane or carbon monoxide but rather oxidizes selectively the desired product ethylene to carbon dioxide and water. At very low oxygen partial pressures in the gas phase, hydrogen appears as another product. The reduction of MoO3 goes to completion and basically phase pure MoO2 is formed upon full conversion of gas phase oxygen. From a methodical point of view it was shown that spatially resolved Raman spectroscopy could be coupled with the spatial kinetic data, revealing the intimate interplay between reaction kinetics and catalyst dynamics. The combination of kinetic and spectroscopic reactor profiles takes in situ catalysis research to a new level and motivates further improvements and the extension to other spectroscopic methods.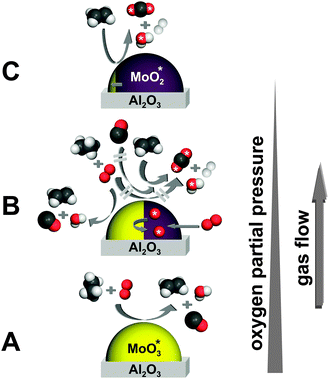 | ||
| Fig. 9 Mechanistic picture of the ODH of ethane over a MoO3 catalyst: The conversion to ethylene occurs exclusively in the presence of gas phase oxygen (A and B). Further oxidation of only ethylene, and not ethane or CO, using lattice oxygen (labeled with *) to CO2 is associated with the reduction of the catalyst to MoO2 (B and C). | ||
Acknowledgements
First and foremost the authors thank Prof. Dr. Robert Schlögl for supporting this work with scientific input and funds. Additionally we thank Achim Klein–Hoffmann for shaping the tips of the Raman sensor, Frank Girgsdies for XRD analysis and Giesela Lorenz for the BET service. We are also very grateful to the German Research Foundation for funding the Emmy Noether Junior Research Group ‘High Temperature Catalysis’. Finally we acknowledge funding by the Federal Ministry of Education and Research (BMBF) within the framework of the Cluster of Excellence ‘Unifying Concepts in Catalysis’.References
- P. L. Hansen, J. B. Wagner, S. Helveg, J. R. Rostrup-Nielsen, B. S. Clausen and H. Topsoe, Sience, 2002, 295, 2053–2055 CrossRef CAS.
- A. C. Sanfiz, T. W. Hansen, D. Teschner, P. Schnörch, F. Girgsdies, A. Trunschke, R. Schlögl, M. H. Looi and S. B. A. Hamid, J. Phys. Chem. C, 2010, 114, 1912–1921 CAS.
- F. C. Meunier, Chem. Soc. Rev., 2010, 39, 4602–4614 RSC.
- R. L. Puurunen, B. G. Beheydt and B. M. Weckhuysen, J. Catal., 2001, 204, 253–257 CrossRef CAS.
- U. Bentrup, Chem. Soc. Rev., 2010, 39, 4718–4730 RSC.
- A. Brueckner, Chem. Soc. Rev., 2010, 39, 4673–4684 RSC.
- J.-D. Grunwaldt, S. Hannemann, C. G. Schroer and A. Baiker, J. Phys. Chem. B, 2006, 110, 8674–8680 CrossRef CAS.
- Y. Yang, R. S. Disselkamp, J. Szanyi, C. H. F. Peden, C. T. Campbell and J. G. Goodwin, Rev. Sci. Instrum., 2006, 77, 094104 CrossRef.
- M. G. O'Brien, A. M. Beale, S. D. M. Jacques, M. D. Michiel and B. M. Weckhuysen, ChemCatChem, 2009, 1, 99–102 CrossRef CAS.
- A. Urakawa and A. Baiker, Top. Catal., 2009, 52, 1312–1322 CrossRef CAS.
- J. Sa, D. L. A. Fernandes, F. Aiouache, A. Goguet, C. Hardacre, D. Lundie, W. Naeem, W. P. Partridge and C. Stere, Analyst, 2010, 135, 2260–2272 RSC.
- J. Touitou, K. Morgan, R. Burch, C. Hardacre and A. Goguet, Catal. Sci. Technol., 2012, 2, 1811–1813 CAS.
- T. Ressler, R. E. Jentoft, J. Wienold, M. M. Günter and O. Timpe, J. Phys. Chem. B, 2000, 104, 6360–6370 CrossRef CAS.
- P. A. Spevack and N. S. McIntyre, J. Phys. Chem., 1992, 96, 9029–9035 CrossRef CAS.
- F. Cavani and F. Trifiro, Catal. Today, 1995, 24, 307–313 CrossRef CAS.
- F. Klose, M. Joshi, C. Hamel and A. Seidel-Morgenstern, Appl. Catal., A, 2004, 260, 101–110 CrossRef CAS.
- J. Haber and E. Lalik, Catal. Today, 1997, 33, 119–137 CrossRef CAS.
- K. Chen, E. Iglesia and A. T. Bell, J. Phys. Chem. B, 2001, 105, 646–653 CrossRef CAS.
- K. Chen, A. Khodakov, J. Yang, A. T. Bell and E. Iglesia, J. Catal., 1999, 186, 325–333 CrossRef CAS.
- R. Horn, O. Korup, M. Geske, U. Zavyalova, I. Oprea and R. Schlögl, Rev. Sci. Instrum., 2010, 81, 064102 CrossRef CAS.
- S. J. Tinnemans, M. H. F. Kox, M. W. Sletering, T. A. Nijhuis, T. Visser and B. M. Weckhuysen, Phys. Chem. Chem. Phys., 2006, 8, 2413–2420 RSC.
- E. Heracleous and A. A. Lemonidou, Catal. Today, 2006, 112, 23–27 CrossRef CAS.
- E. Heracleous, A. F. Le, I. A. Vasalos and A. A. Lemonidou, Catal. Lett., 2003, 88, 47–53 CrossRef CAS.
- E. Heracleous, A. A. Lemonidou and J. A. Lercher, Appl. Catal., A, 2004, 264, 73–80 CrossRef CAS.
- A. Christodoulakis, E. Heracleous, A. A. Lemonidou and S. Boghosian, J. Catal., 2006, 242, 16–25 CrossRef CAS.
- D. S. Zingg, L. E. Makovsky, R. E. Tischer, F. R. Brown and D. M. Hercules, J. Phys. Chem., 1980, 84, 2898–2906 CrossRef CAS.
- T. Ressler, J. Wienold, R. E. Jentoft and T. Neisius, J. Catal., 2002, 210, 67–83 CrossRef CAS.
- L. Seguin, M. Figlarz, R. Cavagnat and J.-C. Lassègues, Spectrochim. Acta, Part A, 1995, 51, 1323–1344 CrossRef.
- O. Korup, S. Mavlyankariev, M. Geske, C. F. Goldsmith and R. Horn, Chem. Eng. Process., 2011, 50, 998–1009 CrossRef CAS.
- M. J. Ledoux, F. Meunier, B. Heinrich, C. Pham-Huu, M. E. Harlin and A. O. I. Krause, Appl. Catal., A, 1999, 181, 157–170 CrossRef CAS.
- M. A. Camacho-López, L. Escobar-Alarcón, M. Picquart, R. Arroyo, G. Córdoba and E. Haro-Poniatowski, Opt. Mater., 2011, 33, 480–484 CrossRef.
- M. Dieterle and G. Mestl, Phys. Chem. Chem. Phys., 2002, 4, 822–826 RSC.
- J. R. Regalbuto and J. W. Ha, Catal. Lett., 1994, 29, 189–207 CrossRef CAS.
- L. Kumari, Y.-R. Ma, C.-C. Tsai, Y.-W. Lin, S. Y. Wu, K.-W. Cheng and Y. Lios, Nanotechnology, 2007, 18, 115717 CrossRef.
| This journal is © The Royal Society of Chemistry 2013 |
