Substitution of WO3 in V2O5/WO3–TiO2 by Fe2O3 for selective catalytic reduction of NO with NH3
Shijian
Yang
abc,
Chizhong
Wang
b,
Lei
Ma
b,
Yue
Peng
b,
Zan
Qu
c,
Naiqiang
Yan
c,
Jinghuan
Chen
b,
Huazhen
Chang
b and
Junhua
Li
*b
aSchool of Environmental and Biological Engineering, Nanjing University of Science and Technology, Nanjing, 210094, P. R. China
bState Key Joint Laboratory of Environment Simulation and Pollution Control (SKLESPC), School of Environment, Tsinghua University, Beijing, 100084, P. R. China. E-mail: lijunhua@tsinghua.edu.cn; Fax: +86-10-62771093; Tel: +86-10-62771093
cSchool of Environmental Science and Engineering, Shanghai Jiao Tong University, Shanghai, 200240, P. R. China
First published on 31st August 2012
Abstract
To improve N2 selectivity and lower the cost, WO3 in V2O5/WO3–TiO2 was substituted by a low cost composition Fe2O3 for selective catalytic reduction (SCR) of NO with NH3. The SCR reaction over V2O5/Fe2O3–TiO2 mainly followed the Eley–Rideal mechanism (i.e. the reaction between activated ammonia species and gaseous NO). There were two active components on V2O5/WO3–TiO2 for the activation of adsorbed NH3 (i.e. V5+ and Fe3+). The acid sites on V2O5/Fe2O3–TiO2 mainly resulted from the support Fe2O3–TiO2, so the adsorbed NH3 preferred to be activated by Fe3+ rather than by V5+. V5+ on V2O5/Fe2O3–TiO2 could accelerate the regeneration of Fe3+ on Fe2O3–TiO2 due to the rapid electron transfer between V5+ and Fe2+ on the surface, so the activation of adsorbed NH3 by Fe3+ was promoted. As some NH3 adsorbed on V2O5/Fe2O3–TiO2 was not activated by Fe3+, the inactivated NH3 could then be activated by V5+ on the surface. As a result, 2% V2O5/Fe2O3–TiO2 showed excellent SCR activity, N2 selectivity and H2O/SO2 durability at 300–450 °C. Furthermore, the emission of 2% V2O5/Fe2O3–TiO2 to the fly ash can be prevented by an external magnetic field due to its inherent magnetization. Therefore, 2% V2O5/Fe2O3–TiO2 could be a promising low-cost catalyst in NO emission control.
1. Introduction
Nitrogen oxides (NO and NO2), which result from automobile exhaust gas and industrial combustion of fossil fuels, have been a major contribution to air pollution.1 They contribute to photochemical smog, acid rain, ozone depletion and the greenhouse effect. So far, the most efficient technology for the removal of nitrogen oxides from coal-fired power plants has been selective catalytic reduction (SCR) of NO with NH3.2 The standard SCR process is based on the following reaction between NH3 and NO: | (1) |
In this study, WO3 in V2O5/WO3–TiO2 was substituted by a low cost composition Fe2O3 to improve its N2 selectivity and lower its cost for SCR of NO with NH3. The support Fe2O3–TiO2 was prepared using a co-precipitation method at room temperature, and V2O5 was supported on Fe2O3–TiO2 by the conventional impregnation method. Then, V2O5/Fe2O3–TiO2 was characterized using nitrogen physisorption, X-ray diffraction (XRD), X-ray photoelectron spectroscopy (XPS), magnetization and H2 temperature-programmed reduction (TPR). Subsequently, the SCR performance of V2O5/Fe2O3–TiO2 was estimated using a packed-bed microreactor. At last, the mechanism of the SCR reaction over V2O5/Fe2O3–TiO2 was studied using in situ DRIFTS.
2. Experimental
2.1 Catalyst preparation
The support Fe2O3–TiO2 was prepared using a co-precipitation method at room temperature.8 Suitable amounts of ferrous sulfate, ferric trichloride, and titanium tetrachloride (Fe2+![[thin space (1/6-em)]](https://www.rsc.org/images/entities/char_2009.gif) :
:![[thin space (1/6-em)]](https://www.rsc.org/images/entities/char_2009.gif) Fe3+
Fe3+![[thin space (1/6-em)]](https://www.rsc.org/images/entities/char_2009.gif) :
:![[thin space (1/6-em)]](https://www.rsc.org/images/entities/char_2009.gif) Ti4+ = 3
Ti4+ = 3![[thin space (1/6-em)]](https://www.rsc.org/images/entities/char_2009.gif) :
:![[thin space (1/6-em)]](https://www.rsc.org/images/entities/char_2009.gif) 2
2![[thin space (1/6-em)]](https://www.rsc.org/images/entities/char_2009.gif) :
:![[thin space (1/6-em)]](https://www.rsc.org/images/entities/char_2009.gif) 1) were dissolved in a HCl solution. This mixture was added to an ammonia solution leading to an instantaneous precipitation. During the reaction, the system was continuously stirred at 800 rpm. The particles were then separated by centrifugation at 4500 rpm for 5 min and washed with distilled water followed by a new centrifugation. After 4 washings, the particles were collected and dried at 105 °C for 12 h.
1) were dissolved in a HCl solution. This mixture was added to an ammonia solution leading to an instantaneous precipitation. During the reaction, the system was continuously stirred at 800 rpm. The particles were then separated by centrifugation at 4500 rpm for 5 min and washed with distilled water followed by a new centrifugation. After 4 washings, the particles were collected and dried at 105 °C for 12 h.
V2O5/Fe2O3–TiO2 catalysts with 1 wt% and 2 wt% V2O5 were prepared by the conventional impregnation method using NH4VO3 and H2C2O4·2H2O as precursors, and Fe2O3–TiO2 as a support. After the impregnation, excess water was removed in a rotary evaporator at 80 °C. The sample was dried at 105 °C overnight and then calcined at 500 °C for 3 h under air. Meanwhile, Fe2O3–TiO2 was calcined at 500 °C for 3 h under air as a comparison. Furthermore, conventional vanadium-based catalysts (V2O5/WO3–TiO2) with 1 wt% V2O5 and 10 wt% WO3, and 2 wt% V2O5 and 10 wt% WO3 were prepared by the conventional impregnation method using NH4VO3, (NH4)10W12O41 and H2C2O4·2H2O as precursors, and anatase TiO2 as a support.
2.2 Catalyst characterization
Crystal structure was determined using an X-ray diffractionmeter (Rigaku, D/max-2200/PC) between 10° and 80° at a step of 7° min−1 operating at 30 kV and 30 mA using Cu Kα radiation. BET surface area was determined using a nitrogen adsorption apparatus (Quantachrome, Autosorb-1). The catalyst was outgassed at 200 °C before BET measurement. H2-TPR was recorded on a chemisorption analyzer (Micromeritics, ChemiSorb 2720 TPx) under a 10% hydrogen–90% nitrogen gas flow (50 cm3 min−1) at a rate of 10 °C min−1. Saturation magnetization was determined using a vibrating sample magnetometer (VSM, Model JDM-13) at room temperature. X-ray photoelectron spectroscopy (Thermo, ESCALAB 250) was used to determine the Fe 2p, V 2p, Ti 2p and O 1s binding energies with Al Kα (hv = 1486.6 eV) as the excitation source. The C 1s line at 284.6 eV was taken as a reference for the binding energy calibration.2.3 Catalytic test
SCR reaction was performed on a fixed-bed quartz tube reactor (6 mm of internal diameter) containing 100–200 mg of the catalyst (40–60 mesh). The typical reactant gas composition was as follows: 500 ppm of NO, 500 ppm of NH3, 2% of O2, 10% of H2O (when used), 200 ppm of SO2 (when used), and the balance of N2. The total flow rate was 200 mL min−1, and the gas hourly space velocity (GHSV) varied from about 60![[thin space (1/6-em)]](https://www.rsc.org/images/entities/char_2009.gif) 000 to 120
000 to 120![[thin space (1/6-em)]](https://www.rsc.org/images/entities/char_2009.gif) 000 cm3 g−1 h−1. The concentrations of NO, NO2, NH3 and N2O were continually monitored by an FTIR spectrometer (Gasmet FTIR DX4000).
000 cm3 g−1 h−1. The concentrations of NO, NO2, NH3 and N2O were continually monitored by an FTIR spectrometer (Gasmet FTIR DX4000).
As the SCR reaction reached the steady state, the ratios of NO conversion and N2 selectivity were calculated according to the following equations:
 | (2) |
 | (3) |
2.4 In situ DRIFTS study
In situ DRIFT spectra were recorded on a Fourier transform infrared spectrometer (FTIR, Nicolet NEXUS 870) equipped with a smart collector and an MCT detector cooled by liquid N2. The diffuse reflectance measurement was carried out in situ in a high temperature cell with a ZnSe window. The FTIR spectra were recorded by accumulating 100 scans with a resolution of 4 cm−1.3. Results
3.1 Characterization
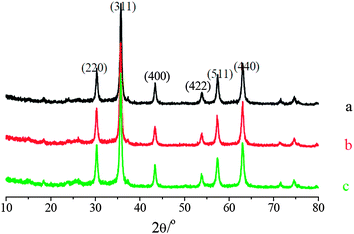 | ||
| Fig. 1 XRD patterns of: (a) Fe2O3–TiO2; (b) 1% V2O5/Fe2O3–TiO2; (c) 2% V2O5/Fe2O3–TiO2. | ||
After the loading of V2O5, the characteristic peaks of V2O5/Fe2O3–TiO2 still corresponded very well to Fe–Ti spinel, and additional reflections that would indicate the presence of other crystalline vanadium oxides, such as V2O5, VO2, V2O4, V2O3 or FeVO4, were not present in the diffraction scan. It indicates that V cations could mainly present as an amorphous phase of VOx, which was well dispersed on Fe2O3–TiO2.
The BET surface areas of Fe2O3–TiO2, 1% V2O5/Fe2O3–TiO2 and 2% V2O5/Fe2O3–TiO2 were 81.4, 73.9 and 70.0 m2 g−1, respectively.
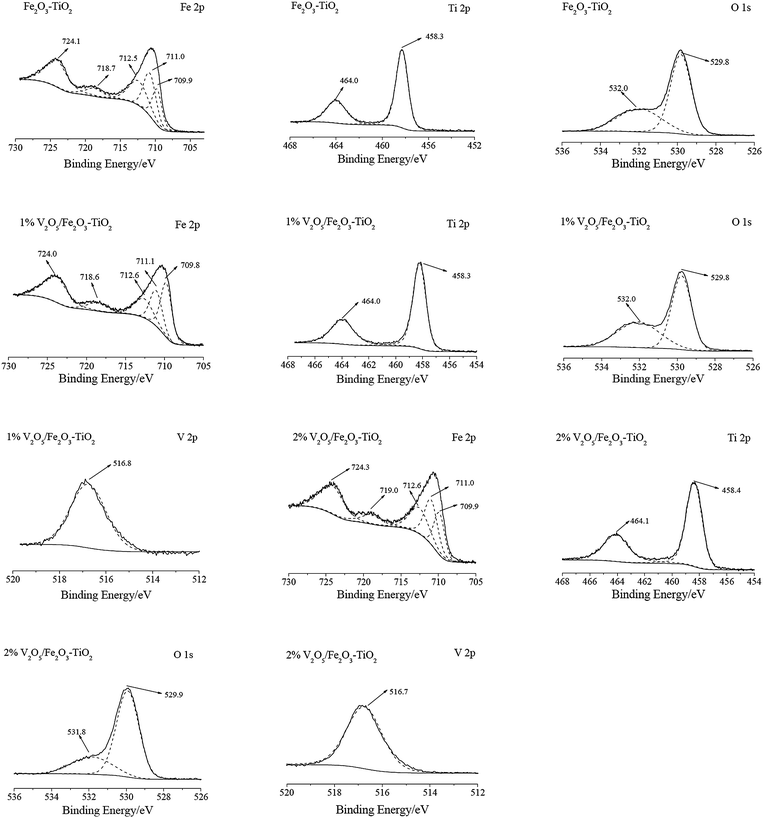 | ||
| Fig. 2 XPS spectra of V2O5/Fe2O3–TiO2 over the spectral regions of Fe 2p, Ti 2p, O 1s and V 2p. | ||
The Fe peaks of Fe2O3–TiO2 were assigned to oxidized Fe species, more likely Fe3+ type species. The binding energies centered at about 709.9 eV and 711.0 eV could be assigned to Fe3+ in the spinel structure, and the binding energy centered at about 712.5 eV could be ascribed to Fe3+ bonded with hydroxyl groups.11,12 The Ti peaks of Fe2O3–TiO2 were assigned to Ti 2p 1/2 (464.0 eV) and Ti 2p 3/2 (458.3 eV) of Ti4+.13 The O 1s peaks of Fe2O3–TiO2 mainly centered at about 529.8 eV, as expected for the transition metal oxides. Another oxygen species centered at about 532.0 eV was also observed, which was assigned to −OH.8
After the loading of V2O5 on Fe2O3–TiO2, no obvious changes happened to XPS spectra of V2O5/Fe2O3–TiO2 over the spectral regions of Fe 2p, Ti 2p and O 1s (shown in Fig. 2). The V 2p peak mainly centered at about 516.8 eV, which was assigned to V5+.14
The ratios of Fe3+, Ti4+, O2− and V5+ on Fe2O3–TiO2, 1% V2O5/Fe2O3–TiO2 and 2% V2O5/Fe2O3–TiO2 collected from XPS spectra are shown in Table 1. The percentage of V5+ on the surfaces of 1% V2O5/Fe2O3–TiO2 and 2% V2O5/Fe2O3–TiO2 was much more than the content of V5+ in 1% V2O5/Fe2O3–TiO2 and 2% V2O5/Fe2O3–TiO2, respectively. It indicates that V5+ could mainly present as an amorphous phase of V2O5 on Fe2O3–TiO2. As V2O5 was loaded on Fe2O3–TiO2, the percent of Fe3+ on V2O5/Fe2O3–TiO2 obviously decreased (shown in Table 1). It suggests that the loaded V5+ could mainly cover Fe3+ on Fe2O3–TiO2.
| Fe3+ | Ti4+ | O2− | V5+ | |
|---|---|---|---|---|
| Fe2O3–TiO2 | 28.5 | 9.5 | 62.0 | — |
| 1% V2O5/Fe2O3–TiO2 | 26.0 | 9.7 | 62.6 | 1.7 |
| 2% V2O5/Fe2O3–TiO2 | 22.0 | 7.9 | 64.1 | 6.0 |
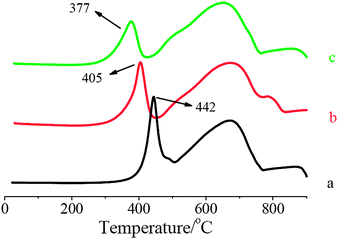 | ||
| Fig. 3 H2-TPR profiles of: (a) Fe2O3–TiO2; (b) 1% V2O5/Fe2O3–TiO2; (c) 2% V2O5/Fe2O3–TiO2. | ||
After the loading of V2O5, a strong displacement of the first reduction peak to low temperature happened in the TPR profiles (shown in Fig. 3). It suggests that the oxidization ability of Fe2O3–TiO2 was gradually enhanced with the increase of V2O5 loading.
Because V2O5 was loaded on Fe2O3–TiO2, the first step of V2O5/Fe2O3–TiO2 reduction was the reduction of V5+ on the surface (reaction (4)), and the next step could be the reduction of V4+ on the surface (reaction (5)).
| 2≡VSurf5+ + H2 → 2≡VSurf4+ + 2H+ | (4) |
| 2≡VSurf4+ + H2 → 2≡VSurf3+ + 2H+ | (5) |
The electrical property of Fe–Ti spinel is similar to that of magnetite, and its band gap is very small.15 Hence, it has the lower resistivity and its conductivity is almost metallic. As a result, the electron can migrate easily from the bulk to the surface. The redox potential of the reduction of Fe3+ by V3+ is 0.41 V, so reaction (6) is thermodynamically favorable.16 Therefore, the formed V3+ on the surface could be reoxidized to V4+ by the reducible Fe3+ in the bulk. Then, the formed V4+ on the surface was reduced by gaseous H2 again. Through the recycle, the reduction of Fe3+ in the octahedral site of Fe2O3–TiO2 was promoted. As a result, the first reduction peak of V2O5/Fe2O3–TiO2 obviously shifted to low temperature although the amount of V2O5 loaded was very small.
| Febulk3+ + ≡VSurf3+ → Febulk2+ + ≡VSurf4+ E0 = 0.41 V | (6) |
As is well known, the support Fe2O3–TiO2 is a magnetic material.19 2% V2O5/Fe2O3–TiO2 had the super-paramagnetism with a minimized coercivity and a negligible magnetization hysteresis, and its saturation magnetization was about 43 emu g−1 (shown in Fig. 4). The magnetization characteristics ensure that the emission of 2% V2O5/Fe2O3–TiO2 to the fly ash during the SCR reaction can be effectively prevented by exposure to an external magnetic field.
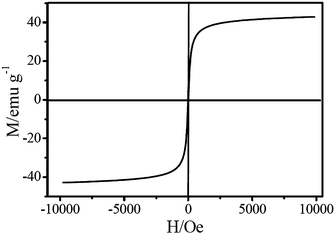 | ||
| Fig. 4 Magnetization characteristics of 2% V2O5/Fe2O3–TiO2. | ||
3.2 SCR performance
![SCR performance of synthesized catalysts: (a) NO conversion; (b) N2 selectivity. Reaction conditions: [NO] = [NH3] = 500 ppm, [O2] = 2 vol%, catalyst mass = 100 mg, total flow rate = 200 mL min−1, GHSV=120 000 cm3 g−1 h−1.](/image/article/2013/CY/c2cy20383a/c2cy20383a-f5.gif) | ||
Fig. 5 SCR performance of synthesized catalysts: (a) NO conversion; (b) N2 selectivity. Reaction conditions: [NO] = [NH3] = 500 ppm, [O2] = 2 vol%, catalyst mass = 100 mg, total flow rate = 200 mL min−1, GHSV=120![[thin space (1/6-em)]](https://www.rsc.org/images/entities/char_2009.gif) 000 cm3 g−1 h−1. 000 cm3 g−1 h−1. | ||
Fe2O3–TiO2 showed a moderate SCR activity at 200–300 °C, and an excellent SCR activity at 350–450 °C (shown in Fig. 5a). Meanwhile, little N2O can be observed during the SCR reaction over Fe2O3–TiO2 (shown in Fig. 5b). The SCR activity of Fe2O3–TiO2 was obviously promoted due to the loading of V2O5, and NO conversion over V2O5/Fe2O3–TiO2 increased obviously with the increase of V2O5 loading (shown in Fig. 5a). Although there was a large amount of V5+ on V2O5/Fe2O3–TiO2 (shown in Table 1), V2O5/Fe2O3–TiO2 showed an excellent N2 selectivity. N2 selectivity of 2% V2O5/Fe2O3–TiO2 only slightly decreased to about 90% as the reaction temperature increased to 500 °C, which was much better than those of 1% V2O5/WO3–TiO2 and 2% V2O5/WO3–TiO2 (shown in Fig. 5b).
3.3 In situ DRIFTS study
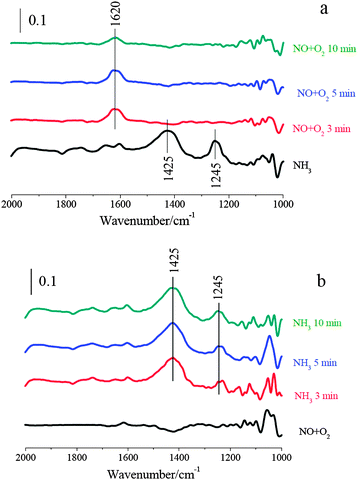 | ||
| Fig. 7 (a) In situ DRIFT spectra taken at 250 °C upon passing NO + O2 over NH3 presorbed 2% V2O5/WO3–TiO2; (b) in situ DRIFT spectra taken at 250 °C upon passing NH3 over NO + O2 presorbed 2% V2O5/WO3–TiO2. | ||
After 2% V2O5/WO3–TiO2 was treated with NO + O2/N2 at 250 °C, the bands corresponding to adsorbed NOx species were hardly observed (shown in Fig. 7b). It suggests that gaseous NO can hardly adsorb on 2% V2O5/WO3–TiO2 to form adsorbed NOx. After NH3/N2 passed over NO + O2 pretreated 2% V2O5/WO3–TiO2, its surface was mainly covered by ionic NH4+ bound to the Brønsted acid sites and coordinated NH3 bound to the Lewis acid sites. Furthermore, adsorbed H2O, which is a product of the SCR reaction, can hardly be detected at about 1620 cm−1. It suggests that the reaction between ammonia and adsorbed nitrogen oxide species cannot happen on 2% V2O5/WO3–TiO2. Therefore, the SCR reaction over V2O5/WO3–TiO2 mainly followed the Eley–Rideal mechanism.
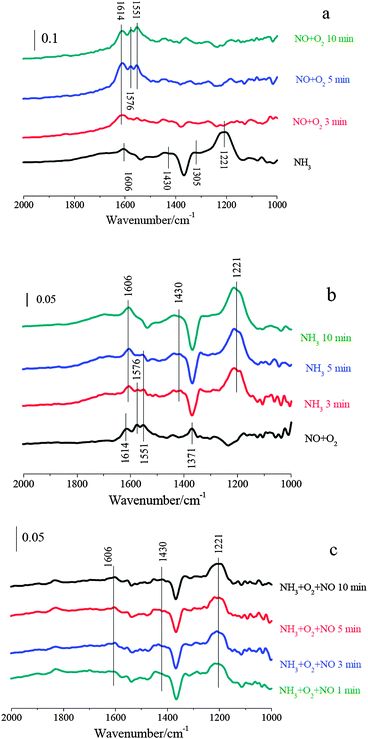 | ||
| Fig. 8 (a) In situ DRIFT spectra taken at 250 °C upon passing NO + O2 over NH3 presorbed 2% Fe2O3–TiO2; (b) in situ DRIFT spectra taken at 250 °C upon passing NH3 over NO + O2 presorbed Fe2O3–TiO2; (c) in situ DRIFT spectra taken at 250 °C upon passing NO + O2 + NH3 over 2% Fe2O3–TiO2. | ||
After the adsorption of NO + O2 at 250 °C, Fe2O3–TiO2 was mainly covered by monodentate nitrite and monodentate nitrate (1614, 1576, 1551 and 1371 cm−1). After NH3/N2 passed over NO + O2 pretreated Fe2O3–TiO2 at 250 °C, the bands corresponding to adsorbed NOx species disappeared. Meanwhile, the bands at 1606, 1430 and 1221 cm−1 corresponding to adsorbed ammonia species appeared. It suggests that adsorbed NOx could take part in the SCR reaction over Fe2O3–TiO2.
At last, the IR spectra during the SCR reaction (i.e. NH3 and NO + O2 were simultaneously introduced) over Fe2O3–TiO2 at 250 °C were recorded. As shown in Fig. 8c, Fe2O3–TiO2 was mainly covered by ionic NH4+ bound to the Brønsted acid sites (1430 cm−1) and coordinated NH3 bound to the Lewis acid sites (1221 and 1606 cm−1), and the characteristic vibrations corresponding to adsorbed NOx species were hardly observed. It suggests that the adsorption of NO + O2 on Fe2O3–TiO2 could not happen in the presence of NH3. There is general agreement that the SCR reaction starts with the adsorption of NH3, which is very strong compared to the adsorption of NO + O2 and the reaction products.23 Therefore, The SCR reaction over Fe2O3–TiO2 mainly followed the Eley–Rideal mechanism.
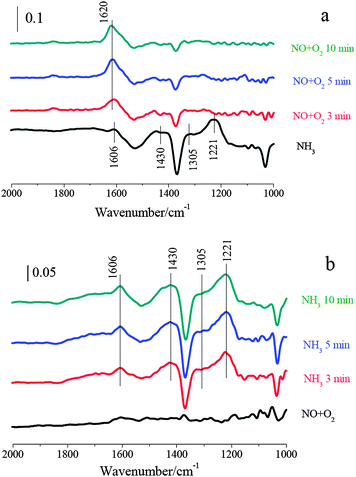 | ||
| Fig. 9 (a) in situ DRIFT spectra taken at 250 °C upon passing NO + O2 over NH3 presorbed 2% V2O5/Fe2O3–TiO2; (b) in situ DRIFT spectra taken at 250 °C upon passing NH3 over NO + O2 presorbed 2% V2O5/Fe2O3–TiO2. | ||
After 2% V2O5/Fe2O3–TiO2 was treated with NO + O2/N2 at 250 °C, the bands corresponding to adsorbed nitrite and nitrate cannot be observed (shown in Fig. 9b). It indicates that the active sites on Fe2O3–TiO2 for the adsorption of gaseous NO were covered by the loaded V2O5. Hence, the adsorption of gaseous NO on Fe2O3–TiO2 was restrained due to the loading of V2O5. After NH3/N2 passed over NO + O2 pretreated 2% V2O5/Fe2O3–TiO2, its surface was mainly covered by ionic NH4+ bound to the Brønsted acid sites and coordinated NH3 bound to the Lewis acid sites. Furthermore, adsorbed H2O, which is a product of the SCR reaction, can hardly be detected at about 1620 cm−1. It suggests that the reaction between adsorbed nitrogen oxide species and ammonia cannot happen on 2% V2O5/Fe2O3–TiO2. Therefore, the SCR reaction over V2O5/Fe2O3–TiO2 mainly followed the Eley–Rideal mechanism.
4. Discussion
The SCR reaction over Fe2O3–TiO2 can be approximately described as follows:6| NH3(g) ⇌ NH3(ad) | (7) |
| NH3(ad) + ≡FeSurf3+ → −NH2 + ≡FeSurf2+ + H+ | (8) |
| −NH2 + NO(g)→N2 + H2O | (9) |
| ≡FeSurf2+ + ¼O2 → ≡FeSurf3+ + ½≡O | (10) |
Meanwhile, the SCR reaction over V2O5/WO3–TiO2 can be approximately described as follows:24
| NH3(g) ⇌ NH3(ad) | (7) |
| NH3(ad) + ≡VSurf5+ → −NH2 + ≡VSurf4+ + H+ | (11) |
| −NH2 + NO(g) → N2 + H2O | (9) |
| ≡VSurf4+ + ¼O2 → ≡VSurf5+ + ½≡O | (12) |
Reaction (7) was the adsorption of gaseous ammonia on the acid sites (i.e. Brønsted acid sites and Lewis acid sites) to form adsorbed ammonia species including ionic NH4+ and coordinated NH3. Reactions (8) and (11) were the activation of adsorbed ammonia species by Fe3+ and V5+ on the surface to form amide species (−NH2), respectively. Then, gaseous NO was reduced by –NH2 on the surface to form N2 and H2O (reaction (9)). Reactions (10) and (12) were the reoxidization of formed Fe2+ and V4+, respectively. Therefore, the SCR reaction over V2O5/Fe2O3–TiO2 can be approximately described using reactions (7–12) and both V5+ and Fe3+ could be the active components for the activation of adsorbed NH3.
In situ DRIFTS study demonstrated that the acid sites on V2O5/Fe2O3–TiO2 mainly resulted from Fe2O3–TiO2, and gaseous NH3 mainly adsorbed onto Fe2O3–TiO2. Therefore, the adsorbed NH3 on V2O5/Fe2O3–TiO2 preferred to be activated by Fe3+ rather than V5+ on V2O5/Fe2O3–TiO2. Moreover, the oxidization of Fe2+ by V5+ is thermodynamically favorable because the redox potential of reaction (13) is 0.23 V. Therefore, the regeneration of Fe3+ on Fe2O3–TiO2 could be accelerated due to the rapid electron transfer between V5+ and Fe2+ on V2O5/Fe2O3–TiO2.16
| ≡FeSurf2+ + ≡VSurf5+ → ≡FeSurf3+ + ≡VSurf4+ E0 = 0.23 V | (13) |
At 150–300 °C, a large amount of NO cannot be reduced over Fe2O3–TiO2 (shown in Fig. 5a). It indicates that adsorbed NH3 cannot be completely activated by Fe3+ on Fe2O3–TiO2 at 150–300 °C. The loading of V2O5 accelerated the regeneration of Fe3+ on Fe2O3–TiO2 through reaction (13), which promoted the activation of adsorbed NH3 by Fe3+ on Fe2O3–TiO2. Furthermore, NH3 adsorbed on V2O5/Fe2O3–TiO2, which was not activated by Fe3+, could then be activated by V5+ on the surface. As a result, the SCR activity of Fe2O3–TiO2 improved due to the loading of V2O5. However, the oxidization ability of Fe3+ is much less than that of V5+, so the activation of NH3 by Fe3+ was much slower than that by V5+. As a result, the SCR activity of 2% V2O5/Fe2O3–TiO2 was much less than that of 2% V2O5/WO3–TiO2 at 150–300 °C.
Some adsorbed NH3 could be over-oxidized by V5+ cations on the surface to form −NH or −N above 300 °C. Then, −NH or −N reacted with gaseous NO to form N2O.25 Therefore, N2 selectivity of V2O5/WO3–TiO2 obviously decreased above 300 °C (shown in Fig. 5b). If a large amount of NH3 adsorbed on V2O5/Fe2O3–TiO2 was activated by V5+ above 300 °C, some N2O should form. However, little N2O formed over V2O5/Fe2O3–TiO2 (shown in Fig. 5b). It suggests that NH3 adsorbed on V2O5/Fe2O3–TiO2 was mainly activated by Fe3+ above 300 °C.
NO conversion over Fe2O3–TiO2 obviously increased as the reaction temperature increased from 200 to 400 °C (shown in Fig. 5a). It suggests that the activation of adsorbed NH3 by Fe3+ on Fe2O3–TiO2 (reaction (8)) was obviously promoted with the increase in reaction temperature. As shown in Fig. 5a, more than 80% of gaseous NO can be reduced over Fe2O3–TiO2 at 350–450 °C. It suggests that most of the adsorbed NH3 could be activated by Fe3+ on V2O5/Fe2O3–TiO2 even if V5+ did not take part in the activation of adsorbed NH3. Because gaseous NH3 mainly adsorbed on Fe2O3–TiO2, the adsorbed NH3 preferred to be activated by Fe3+ rather than by V5+ on V2O5/Fe2O3–TiO2. Meanwhile, the ratios of Fe3+ to V5+ on 1% and 2% V2O5/Fe2O3–TiO2 were 15.3 and 3.7, respectively. Therefore, reaction (8) predominated over the activation of adsorbed NH3 during the SCR reaction over V2O5/Fe2O3–TiO2 at 350–500 °C. As a result, V2O5/Fe2O3–TiO2 showed an excellent N2 selectivity at 350–500 °C. Because the regeneration of Fe3+ on Fe2O3–TiO2 was accelerated due to the loading of V2O5, the SCR activity of V2O5/Fe2O3–TiO2 was generally better than that of Fe2O3–TiO2 at 350–450 °C.
5. Conclusion
2% V2O5/Fe2O3–TiO2 showed excellent SCR activity, N2 selectivity and H2O/SO2 durability at 300–450 °C. Meanwhile, the emission of 2% V2O5/Fe2O3–TiO2 to the fly ash can be prevented by an external magnetic field due to its inherent magnetization. Therefore, 2% V2O5/Fe2O3–TiO2 could be a promising low-cost SCR catalyst to control of the emission of NO.Acknowledgements
This study was financially supported by the National Natural Science Fund of China (Grant Nos. 51078203 and 21207067), the National High-Tech Research and Development (863) Program of China (Grant Nos. 2010AA065002 and 2012AA062506).Notes and references
- G. S. Qi, R. T. Yang and R. Chang, Appl. Catal., B, 2004, 51, 93–106 CrossRef CAS.
- Z. Wu, B. Q. Jiang and Y. Liu, Appl. Catal., B, 2008, 79, 347–355 CrossRef CAS.
- N. Y. Topsoe, Science, 1994, 265, 1217–1219 CAS.
- L. Chen, J. H. Li and M. F. Ge, Environ. Sci. Technol., 2010, 44, 9590–9596 CrossRef CAS.
- F. D. Liu, H. He, C. B. Zhang, Z. C. Feng, L. R. Zheng, Y. N. Xie and T. D. Hu, Appl. Catal., B, 2010, 96, 408–420 CrossRef CAS.
- S. J. Yang, J. H. Li, C. Z. Wang, J. H. Chen, L. Ma, H. Z. Chang, L. Chen, Y. Peng and N. Q. Yan, Appl. Catal., B, 2012, 117, 73–80 CrossRef.
- L. Chen, J. H. Li and M. F. Ge, J. Phys. Chem. C, 2009, 113, 21177–21184 CAS.
- S. Yang, Y. Guo, N. Yan, D. Wu, H. He, Z. Qu, C. Yang, Q. Zhou and J. Jia, ACS Appl. Mater. Interfaces, 2011, 3, 209–217 CAS.
- S. Yang, H. He, D. Wu, D. Chen, X. Liang, Z. Qin, M. Fan, J. Zhu and P. Yuan, Appl. Catal., B, 2009, 89, 527–535 CrossRef CAS.
- P. Perriat, E. Fries, N. Millot and B. Domenichini, Solid State Ionics, 1999, 117, 175–184 CrossRef CAS.
- S. Yang, Y. Guo, N. Yan, Z. Qu, J. Xie, C. Yang and J. Jia, J. Hazard. Mater., 2011, 186, 508–515 CrossRef CAS.
- S. J. Yang, Y. F. Guo, N. Q. Yan, D. Q. Wu, H. P. He, Z. Qu and J. P. Jia, Ind. Eng. Chem. Res., 2011, 50, 9650–9656 CrossRef CAS.
- S. Yang, Y. Guo, N. Yan, D. Wu, H. He, J. Xie, Z. Qu and J. Jia, Appl. Catal., B, 2011, 101, 698–708 CrossRef CAS.
- S. Yang, Y. Guo, N. Yan, D. Wu, H. He, J. Xie, Z. Qu, C. Yang and J. Jia, Chem. Commun., 2010, 46, 8377–8379 RSC.
- N. Guigue-Millot, Y. Champion, M. J. Hytch, F. Bernard, S. Begin-Colin and P. Perriat, J. Phys. Chem. B, 2001, 105, 7125–7132 CrossRef CAS.
- X. L. Liang, S. Y. Zhu, Y. H. Zhong, J. X. Zhu, P. Yuan, H. P. He and J. Zhang, Appl. Catal., B, 2010, 97, 151–159 CrossRef CAS.
- M. M. Shafer, B. M. Toner, J. T. Oyerdier, J. J. Schauer, S. C. Fakra, S. H. Hu, J. D. Herner and A. Ayala, Environ. Sci. Technol., 2012, 46, 189–195 CrossRef CAS.
- S. Yang, C. Wang, J. Chen, Y. Peng, L. Ma, H. Chang, H. Chang, C. Liu, J. Li and N. Yan, Catal. Sci. Technol., 2012, 2, 915–917 CAS.
- S. J. Yang, H. P. He, D. Q. Wu, D. Chen, Y. H. Ma, X. L. Li, J. X. Zhu and P. Yuan, Ind. Eng. Chem. Res., 2009, 48, 9915–9921 CrossRef CAS.
- F. D. Liu, K. Asakura, H. He, W. P. Shan, X. Y. Shi and C. B. Zhang, Appl. Catal., B, 2010, 103, 369–377 CrossRef.
- G. S. Qi and R. T. Yang, J. Phys. Chem. B, 2004, 108, 15738–15747 CrossRef CAS.
- S. Yang, C. Wang, J. Li, N. Yan, L. Ma and H. Chang, Appl. Catal., B, 2011, 110, 71–80 CrossRef CAS.
- W. S. Kijlstra, D. S. Brands, H. I. Smit, E. K. Poels and A. Bliek, J. Catal., 1997, 171, 219–230 CrossRef CAS.
- G. Busca, L. Lietti, G. Ramis and F. Berti, Appl. Catal., B, 1998, 18, 1–36 CrossRef CAS.
- X. F. Tang, J. H. Li, L. A. Sun and J. M. Hao, Appl. Catal., B, 2010, 99, 156–162 CrossRef CAS.
| This journal is © The Royal Society of Chemistry 2013 |

![Effect of 10% of H2O and 200 ppm of SO2 on the SCR reaction over: (a) 2% V2O5/Fe2O3–TiO2; (b) 1% V2O5/WO3–TiO2. Reaction condition: [NO] = [NH3] = 500 ppm, [O2] = 2 vol%, catalyst mass = 200 mg, total flow rate = 200 mL min−1, GHSV=60 000 cm3 g−1 h−1.](/image/article/2013/CY/c2cy20383a/c2cy20383a-f6.gif)