Enhanced catalytic performance of V2O5–WO3/Fe2O3/TiO2 microspheres for selective catalytic reduction of NO by NH3†
Ruihua
Gao
a,
Dengsong
Zhang
*ab,
Xingang
Liu
c,
Liyi
Shi
ab,
Phornphimon
Maitarad
a,
Hongrui
Li
a,
Jianping
Zhang
b and
Weiguo
Cao
b
aResearch Center of Nano Science and Technology, Shanghai University, Shanghai, 200444, China. E-mail: dszhang@shu.edu.cn; Fax: +86-21-66136038; Tel: +86-21-66134852
bDepartment of Chemistry, Shanghai University, Shanghai, 200444, China
cCenter of Analysis and Measurement, Fudan University, Shanghai, 200433, China
First published on 28th August 2012
Abstract
The V2O5–WO3/Fe2O3/TiO2 microsphere catalysts were prepared by an impregnation method. The catalytic test results showed that the Fe2O3 additives in V2O5–WO3/Fe2O3/TiO2 improved the NO decomposition in the temperature range of 200–400 °C. The characterization results indicated that the iron oxides mainly existed in the form of Fe2O3, which was beneficial for the oxidation of NO to NO2. Meanwhile, the superior catalytic performance of V2O5–WO3/Fe2O3/TiO2 for the selective catalytic reduction of NO has been attributed to its highly dispersed active species, and lots of surface adsorbed oxygen. Prominently, the activity of V2O5–WO3/Fe2O3/TiO2 microspheres can be recovered after cutting off SO2, and thus these combination metal oxide catalysts show not only high catalytic activities but also good resistance to SO2.
1. Introduction
As we know, nitrogen oxides (NOx) emitted from stationary sources and automobiles are major causes for acid rain, smog, and ozone depletion. The selective catalytic reduction (SCR) of NOx to N2 using NH3 as a reductant is now considered to be the most effective process for the treatment of nitrogen oxides from stationary sources.1–3 V2O5–WO3 (MoO3)/TiO2 has been widely used as an industrial catalyst. This kind of catalyst shows high NOx reduction efficiencies and the high resistance to SO2 poisoning. However, the reaction should be operated at relatively high temperatures (350–450 °C) and the SCR reactor is located upstream before the dust removal or desulfurizer device to avoid reheating of the flue gas. Therefore, the catalysts are easily poisoned by the high concentration of dust and SO2. Thus, the design of the highly active catalysts for low-temperature SCR that is located downstream of the dust removal or desulfurizer device becomes important.Recently, it has been reported that Fe2O3,4,5 Fe containing mixed oxides6–9 and Fe-exchanged materials10–13 exhibit remarkable activity in SCR of NO by NH3. Liu and He 14 reported that iron titanate catalysts exhibit high activity at 250–350 °C in the SCR of NOx with NH3. This indicated that the iron oxides show better activity at lower temperature than V2O5–WO3/TiO2. It is commonly accepted that the catalytic behavior of the supported vanadium oxides is sensitive to the intrinsic nature of the vanadium species, including oxidation state, coordination circumstance, dispersion, and stability.15–18 The chemical and structural features of the promoters affect catalytic performance indirectly, by influencing vanadium dispersion and stabilization of the vanadium oxide species. Herein, iron oxides were incorporated into V2O5–WO3/TiO2 catalysts to improve the SCR activity at low temperature. Much attention has been given to the synthesis of nano-structured inorganic materials with hierarchical morphologies in the field of catalysis. For example, Yang et al.19 have reported that the novel WO3/TiO2 microspheres show good catalytic performance for the selective oxidation of cyclopentene to glutaraldehyde. The high dispersion of the tungsten species can be achieved on the titania spheres. Here we used TiO2 microspheres as support. The titania microspheres have a mesoporous structure with a narrow pore size distribution in the nanometer range, and are also thermally stable and have much more surface area. These novel characteristics suggest that the TiO2 microspheres can be applied as good candidates of catalyst supports. In addition, the promotional effect of iron oxides on the V2O5–WO3/TiO2 catalysts for the SCR remains unreported.
Therefore, the aim of the present study was to study the promotional effect of iron oxides on the V2O5–WO3/TiO2 catalysts for the SCR to attain a catalyst with enhanced activity at relatively low temperatures. Fe2O3 was firstly employed to coat TiO2 microspheres (Fe2O3/TiO2 microspheres, denoted FeTMS), and then, we added V, W oxides as additives to get V2O5–WO3/Fe2O3/TiO2 microspheres (denoted VWFeTMS) with improved resistance to SO2 poisoning for NH3-SCR. To gain insight into the key role of iron species in the VWFeTMS catalysts in the SCR of NO with NH3, VWFeTMS catalysts with different iron loadings were prepared by an impregnation method and compared in the SCR of NO with NH3 at different reaction temperatures in the range of 200–500 °C.
2. Experimental section
2.1 Catalyst preparation
The FeTMS supports were synthesized as follows. The required amount of iron nitrate was dissolved in water. The TiO2 microsphere materials, prepared following a procedure reported by Guo et al.,20 were added into the stirred solution at 60 °C. Then the excessive water was completely evaporated at 80 °C, and the FeTMS was obtained after calcination at 500 °C in air for 3 h. If the Fe loading was 3 wt%, the support was denoted 3FeTMS. The catalyst was prepared by a conventional incipient wetness impregnation method. The required amount of ammonium vanadate and ammonium tungstate was dissolved in water acidified by oxalic acid. To this solution, the synthesized FeTMS was added and then completely evaporated, and followed by drying and calcination at 550 °C for 6 h under an air atmosphere. Typically, 1V10W3FeTMS represents the loading of V2O5 (1 wt%), WO3 (10 wt%), and Fe (3 wt%), respectively. The catalysts maintained the spherical shape as shown in Fig. S1 (ESI†).2.2 Characterizations
Nitrogen adsorption–desorption isotherms of the samples were measured at −196 °C using an ASAP 2010Micromeritics, and the corresponding pore size distribution curves are calculated from desorption branches by the BJH method. The specific surface area of the samples was calculated by the Brunauer–Emmett–Teller (BET) method. The SEM micrographs were obtained using a JEOLJSM-6700F scanning electron microscope. The samples were deposited on a sample holder with a piece of adhesive carbon tape and were then sputtered with a thin film of gold. Powder X-ray diffraction (XRD) was performed with a 222 Rigaku D/MAX-RB X-ray diffractometer by using Cu Kα (40 kV, 40 mA) radiation and a secondary beam graphite monochromator. Ammonia temperature programmed desorption (NH3-TPD), NOx temperature programmed desorption (NOx-TPD), and temperature programmed reduction by hydrogen (H2-TPR) were conducted on TianjinXQ TP-5080 auto-adsorption apparatus, and the NH3, NOx and H2 were monitored by a TCD. Before TPD or TPR, each sample was pre-treated with high-purity (99.999%) N2 (30 mL min−1) at 300 °C for 2 h. For NH3-TPD, each sample was saturated with high-purity anhydrous ammonia at 120 °C for 1 h and subsequently flushed at the same temperature for 1 h to remove physisorbed ammonium. The NH3-TPD analysis was carried out at 120–850 °C at a heating rate of 10 °C min−1. For NOx-TPD, each sample was saturated with high-purity NO and O2 at 100 °C for 1 h and subsequently flushed at the same temperature for 1 h to remove physisorbed NOx. The NOx-TPD analysis was carried out at 100–850 °C at a heating rate of 10 °C min−1. For H2-TPR, the flowing gas was switched to 5% H2/N2, and the sample was heated to 950 °C at a ramping rate of 10 °C min−1. The laser Raman experiment was performed using an inVia-reflex Renishaw spectrometer equipped with a holographic notch filter, a CCD detector and a laser radiating at 532 nm. The X-ray photoelectron spectroscopy (XPS) was recorded on a Perkin–Elmer PHI 5000C ESCA system equipped with a dual X-ray source, using the MgKα (1253.6 eV) anode and a hemispherical energy analyzer. The background pressure during data acquisition was kept below 10−6 Pa. All binding energies were calibrated using contaminant carbon (C1s = 284.6 eV) as a reference. The IR spectra were recorded on a Nicolet Nexus 470 Fourier transform infrared spectrometer. The surface characterisation has been performed using pressed disks of pure powders (15 mg for 2 cm diameter), activated by outgassing (10−5 Torr) at 300 °C into the IR cell. A conventional manipulation/outgassing ramp connected to the IR cell was used. The adsorption procedure involves contact of the activated samples disk with ammonia or NO and O2 mixed gas at RT at a pressure of 15 Torr and outgassing at 25 °C.2.3 Catalytic reaction
The SCR activity measurement was carried out in a fixed-bed quartz micro-reactor operating in a steady state flow mode. The reactant gas composition was typically: 550 ppm NO, 550 ppm NH3, 3% O2, and balance N2. The total flow rate was 500 mL min−1 and thus a gas hourly space velocity (GHSV) of 30![[thin space (1/6-em)]](https://www.rsc.org/images/entities/char_2009.gif) 000 h−1 was obtained. The temperature was increased from 200 to 500 °C. At each temperature step the data were recorded when the SCR reaction reached steady state after 15 min. The concentration of NO in the inlet and outlet gas was measured by a KM9106 flue gas analyzer. The concentrations of N2O and NH3 were measured by a Transmitter IR N2O analyzer and an IQ350 ammonia analyzer.
000 h−1 was obtained. The temperature was increased from 200 to 500 °C. At each temperature step the data were recorded when the SCR reaction reached steady state after 15 min. The concentration of NO in the inlet and outlet gas was measured by a KM9106 flue gas analyzer. The concentrations of N2O and NH3 were measured by a Transmitter IR N2O analyzer and an IQ350 ammonia analyzer.
3. Results and discussion
3.1 Characteristics of catalysts
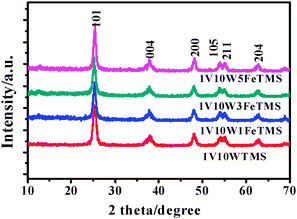 | ||
| Fig. 1 X-ray diffraction patterns of various catalysts. | ||
Fig. 2(a) shows the nitrogen adsorption–desorption isotherms of the TMS and other different catalysts. All of them imply the type IV isotherm with an inflection of nitrogen-adsorbed volume at P/P0 = 0.45 (type H2 hysteresis loop), indicating the presence of well-developed mesopores in the samples. The pore size distribution measurement was evaluated by the BJH model, as shown in Fig. 2(b); it can be seen that the TMS and different catalysts afford the relatively narrow pore-size distribution with their pore diameters centered at approximately 6.0 nm. The BET model was applied to the desorption branch, resulting in both specific surface areas and pore volumes for these samples. As listed in Table 1, due to the introduction of V2O5, nanoparticles within the TMS support are mostly located on the outer surface or presumably infiltrated in mesopores. The BJH desorption average pore diameter is opposite to the surface area. This conclusion can be easily interpreted according to the pores in TMS with different sizes. When the metal oxides are deposited on the surface of TMS or in the small pores, there is the possibility of blocking the Fe2O3 and WO3; the surface areas and pore volumes correspondingly decrease. It is most likely that the embedded entrance of small pores would also block the access to a portion of the smaller pores. Therefore, the more the blocked small-pores, the higher the desorption average pore diameter and the lower the BET surface area.
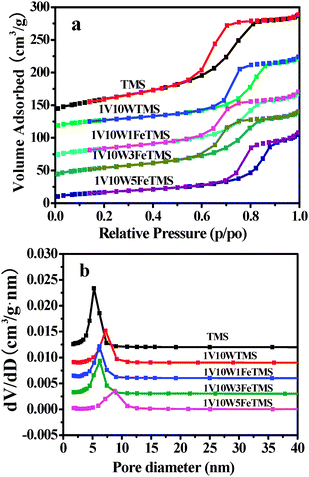 | ||
| Fig. 2 (a) Nitrogen adsorption–desorption isotherms and (b) the corresponding pore size distribution for the samples. | ||
| Samples | S BET a (m2 g−1) | V BJH b (cm3 g−1) | D BJH c (nm) | T d d (°C) | Acidic amountsd (mmol g−1) |
|---|---|---|---|---|---|
| a BET surface area of the samples. b BJH desorption cumulative volume of pores. c BJH desorption average pore diameter (4V/A). d NH3-TPD. | |||||
| TMS | 144 | 0.266 | 5.2 | — | — |
| 1V10WTMS | 80 | 0.186 | 7.3 | 187 | 0.423 |
| 1V10W1FeTMS | 87 | 0.173 | 6.2 | 194 | 0.483 |
| 1V10W3FeTMS | 88 | 0.173 | 6.1 | 185 | 0.495 |
| 1V10W5FeTMS | 60 | 0.168 | 8.9 | 179 | 0.506 |
The NOx-TPD results are shown in Fig. 3. All the catalysts show broad bands between 150 °C and 680 °C. This indicates that there are not only weakly adsorbed NOx but also nitrate species which exist in the type of monodentate nitrate, bridging nitrate, and bidentate nitrate formed on the catalyst surface.22 The sequence of NOx desorption amounts from the catalysts is 1V10W3FeTMS > 1V10W5FeTMS > 1V10W1FeTMS > 1V10WTMS. These results mean that the appropriate Fe2O3 species can improve basic sites over the 1V10WTMS on which the NOx species were adsorbed. While excess Fe2O3 is not beneficial to the adsorption of NOx. According to the literature,23 the active nitrate species could be continuously formed on the fresh FeTiOx catalyst, which favours the low temperature SCR reaction. Liu et al.24 also reported that more nitrate species on the catalyst surface could participate in the SCR reaction, which was beneficial to promote the SCR reaction. So the addition of Fe2O3 species should be positive to improve the low temperature SCR activity of 1V10WTMS.
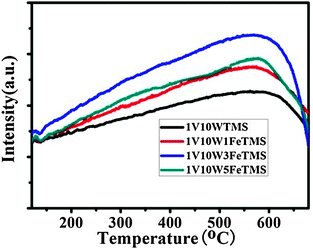 | ||
| Fig. 3 The NOx-TPD profiles of various catalysts. | ||
The TPR is widely used to study the redox property of metal oxide catalysts. Fig. 4 shows the H2-TPR profiles of VWTMS and VWFeTMS catalysts. As for 1V10WTMS catalysts the main peak is found at 870 °C and the two shoulders appear at 560 and 715 °C. The two peaks at low temperatures are attributed to the reduction of highly dispersed vanadium species, while the presence of a peak at 870 °C can imply the tungsten oxide reduction.25,26 The addition of Fe to the VWTMS catalysts caused the three reduction peaks to shift to the relative lower temperatures. For the 1V10W3FeTMS catalysts, the three reduction peaks shifted to 475, 680, and 850 °C. Liu and He14 reported that the Fe3+ species have been totally converted into Fe2+ until 500 °C, and then partial Fe2+ species have been converted into metallic Fe. So the peaks of lower temperatures were attributed to the reduction of V2O5 and Fe2O3. If overlaying the lines of the H2-TPR, the peak areas of the VWFeTMS catalysts are far greater than that of VWTMS. Among all the catalysts, the 1V10W3FeTMS catalysts have the largest area. These results indicate that the integration of Fe with the VWTMS catalyst can enhance the oxidative ability of the VWFeTMS catalyst.
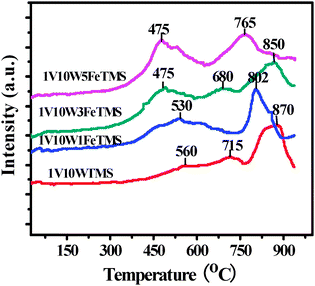 | ||
| Fig. 4 H2-TPR profiles of various catalysts. | ||
![[double bond, length as m-dash]](https://www.rsc.org/images/entities/char_e001.gif) O stretch of vanadyl groups internal to metavanadate chains.16 From Fig. 5b, the bands of 800 and 960 cm−1 are both weaker. Meanwhile, the corresponding XRD patterns did not show any diffraction peaks corresponding to crystalline tungsten and vanadia oxides. This indicates that the dominant tungsten and vanadia oxides over these catalysts are monomeric and polymeric oxide species.
O stretch of vanadyl groups internal to metavanadate chains.16 From Fig. 5b, the bands of 800 and 960 cm−1 are both weaker. Meanwhile, the corresponding XRD patterns did not show any diffraction peaks corresponding to crystalline tungsten and vanadia oxides. This indicates that the dominant tungsten and vanadia oxides over these catalysts are monomeric and polymeric oxide species.
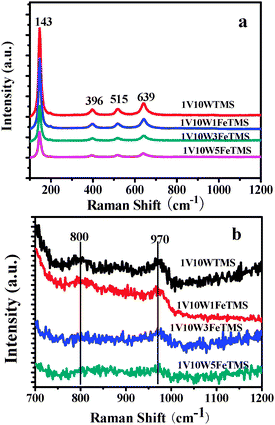 | ||
| Fig. 5 Raman spectra of various samples (a) full observation between 100 and 1200 cm−1 and (b) deep observation between 700 and 1200 cm−1. | ||
The XPS investigation of binding energies and intensities of the surface elements provides information on the chemical states and relative quantities of the outermost surface compounds. From the V 2p XPS spectra of the VWTMS and VWFeTMS samples given in Fig. 6a, we can distinguish vanadium oxide species in different chemical states from the position of the V 2p3/2 level, and the peak of V 2p1/2 (∼524.7 eV) was very weak and hindered by O 1s satellites (521.1 eV). As shown in Fig. 6a, the XPS spectra of the VWTMS and VWFeTMS were too weak for ready analysis indicating that the vanadia is highly dispersed on the TMS support. The V 2p3/2 of the VWTMS and VWFeTMS is between 514.0 and 517.5 eV which indicates that vanadium species in the VWTMS and VWFeTMS catalyst are in mixed oxidation states of V5+ and V4+.29
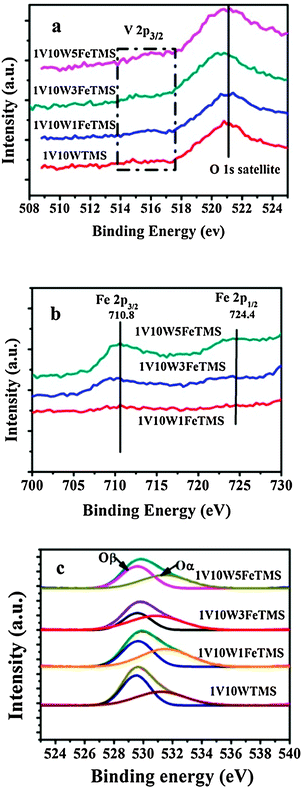 | ||
| Fig. 6 XPS spectra of V 2p (a) and Fe 2p (b) and O 1s (c) over different catalysts. | ||
Two peaks ascribed to Fe 2p3/2 (710.0–711.4 eV) and Fe 2p1/2 (724.4–725.0 eV) showed up in Fig. 6b. The binding energies of these two peaks correspond well with characteristic Fe3+ according to the literatures.7,30 According to works by Santhosh Kumar et al.,31 for SCR, the concentration of accessible Fe3+ that can participate in a reversible redox cycle should be maximized, whereas the formation of FexOy clusters must be completely or largely avoided, indicating that Fe3+ may play a major role in the catalytic cycle. The O 1s bands of different samples in Fig. 6c were deconvoluted by the curve-fitting procedure. The sub-bands at lower binding energy (530.2–530.5 eV) corresponded to the lattice oxygen O2− (denoted Oβ), and the sub-bands at higher binding energy (531.6–532.1 eV) corresponded to the surface adsorbed oxygen (denoted Oα), such as O22− or O− belonging to defect oxide or hydroxyl-like group.32 The quantitative peak-fitting results of O1s can be seen in Table 2. Usually, the surface oxygen Oα is more reactive in oxidation reactions due to its high mobility than lattice oxygen Oβ,33 which is beneficial to the NO oxidation to NO2 in the SCR reaction. Herein the relative concentration ratios of Oα/Oα + Oβ over all the catalysts are calculated and listed in Table 2. The Oα/Oα + Oβ ratio of 1V10W3FeTMS catalyst is much higher than that of the other catalysts, indicating the presence of more abundant surface oxygen. This might be beneficial for the enhancement of NO oxidation and thus the SCR activity.14,34
| Catalysts | Surface compositiona/mol% | BE (eV) | Oαb | |||
|---|---|---|---|---|---|---|
| W | Fe | Ti | Oα | Oβ | ||
| a The average value is provided in the brackets. b Oα(%) = SOα/SOα + SOβ. | ||||||
| 1V10WTMS | 2.39 | — | 22.04 | 531.2 | 529.5 | 31.1 |
| (1.21) | (32.08) | |||||
| 1V10W1FeTMS | 2.46 | 0.30 | 20.09 | 531.5 | 529.6 | 40.7 |
| (1.22) | (0.51) | (31.17) | ||||
| 1V10W3FeTMS | 6.02 | 0.89 | 18.47 | 530.9 | 529.6 | 45.6 |
| (1.23) | (1.54) | (30.81) | ||||
| 1V10W5FeTMS | 2.61 | 1.52 | 16.72 | 531.4 | 529.5 | 37.3 |
| (1.25) | (2.59) | (30.43) | ||||
Table 2 gives the quantitative results of the mole ratios of different atoms by XPS. The XPS spectra of V 2p3/2 over the VWTMS and VWFeTMS samples were too weak for quantitative analysis. It is interesting to note that the surface W content is much higher than the mean values for all catalysts. It is also clear that the surface Fe content is lower than the average values for all catalysts. These XPS results show that surface enrichment of WO3 is obviously observed for all of the catalysts, suggesting that WO3 is dispersed on the surface of the TMS and the Fe2O3 is mainly dispersed in the pores of the TMS. According to the comparison of the surface molar ratio of Fe with that of the mean value as added, it can be concluded that the increase of this ratio with the increasing weight percentage of iron is linear. This suggests that the dispersion of the surface iron species is uniform with increasing iron loading.
Fig. 7a shows the in situ IR results of 1V10WTMS and 1V10W3FeTMS catalysts during 500 ppm NH3 adsorption. Depending on the metal oxide surface, the adsorption of NH3 can occur through a hydrogen bond, coordination to an electron-deficient metal atom (Lewis acid site), dissociation of NH3 with formation of NH2 or NH group, and the formation of NH4+ at Brönsted acid sites.34–36Fig. 7a indicates that 1V10WTMS and 1V10W3FeTMS have similar adsorption sites. The features centered at 1200 and 1603 cm−1 were attributed to the symmetric and asymmetric deformation vibration of ammonia coordinated to Lewis acid sites. The bands at 1647 and 1450 cm−1 were correlated to NH4+ ions formed on Brönsted acidic sites.34 As compared with the 1V10WTMS catalyst, the Lewis acid sites (1200 cm−1) of 1V10W3FeTMS were weaker, but the Brönsted acid sites (1450 cm−1) were obviously similar. According to the NH3-SCR mechanism over vanadia–titania catalyst by Topsøe,37 both types of acid sites were involved in NH3 adsorption. The in situ IR results of NH3 on 1V10W3FeTMS from 25 to 250 °C were shown in Fig. 7b. With an increase of temperature, the bands of 1200, 1603, and 1647 cm−1 all shifted to the higher wave bands. The intensity of the band at 1450 cm−1 decreased more rapidly than that at 1200 cm−1. This indicated that the Lewis acid sites were much stable than the Brönsted acid sites over the 1V10W3FeTMS catalysts, which indicated that the Brönsted acid sites were more important than the Lewis acid sites at the low temperature NH3-SCR process. The comparison of NO plus O2 adsorption on different catalysts was presented in Fig. 7c. According to Liu et al.,24 the bands at 1612 and 1243 cm−1 are attributed to bridging nitrate species, whereas the band at 1581 cm−1 is attributed to bidentate nitrate species. The bands at 1543 and 1296 cm−1 can be assigned to monodentate nitrate. As compared with the 1V10WTMS catalyst, the bands of bridging nitrate species (1612 cm−1) on 1V10W3FeTMS were weaker, but the bands of monodentate nitrate (1296 cm−1) were obviously stronger. The M–O–NO2(M![[double bond, length as m-dash]](https://www.rsc.org/images/entities/char_e001.gif) Fe) species could rapidly react with adjacent adsorbed NH4+ or NH3 to produce more reactive intermediates M–O–NO2[NH4+]2 or M–O–NO2[NH3]2, which could further react with gaseous NO to form N2 and H2O.24 The in situ IR results of NO plus O2 adsorptions on 1V10W3FeTMS from 25 to 250 °C were shown in Fig 7d. With an increase of temperature, the intensity of 1612 and 1243 cm−1 decreased rapidly, while the 1543 cm−1 band still remained. This indicated that monodentate nitrates were more important than the bridging nitrate species for the NH3-SCR process.
Fe) species could rapidly react with adjacent adsorbed NH4+ or NH3 to produce more reactive intermediates M–O–NO2[NH4+]2 or M–O–NO2[NH3]2, which could further react with gaseous NO to form N2 and H2O.24 The in situ IR results of NO plus O2 adsorptions on 1V10W3FeTMS from 25 to 250 °C were shown in Fig 7d. With an increase of temperature, the intensity of 1612 and 1243 cm−1 decreased rapidly, while the 1543 cm−1 band still remained. This indicated that monodentate nitrates were more important than the bridging nitrate species for the NH3-SCR process.
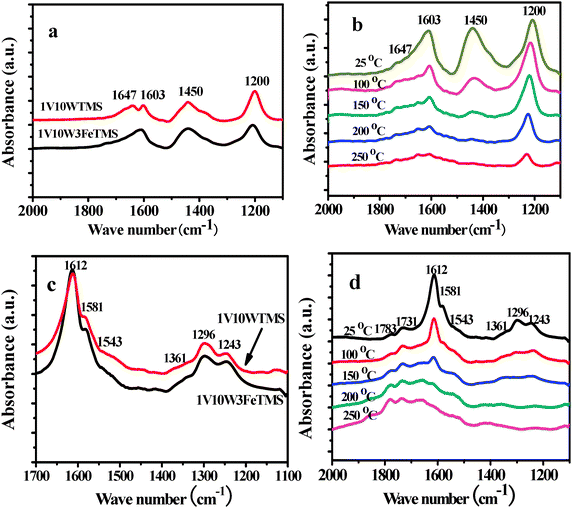 | ||
| Fig. 7 In situ IR results of (a) comparison of NH3 on different catalysts at 25 °C; (b) NH3 on 1V10W3FeTMS from 25 to 250 °C; (C) comparison of NO + O2 adsorption on different catalysts at 25 °C; (d) NO + O2 adsorption on 1V10W3FeTMS from 25 to 250 °C. | ||
3.2 Catalytic activity
The effects of various Fe loadings from 1 to 5% on the performance of the 1V10WFeTMS catalyst are shown in Fig. 8. Fig. 8a indicates that NO conversion below 350 °C was sharply improved with the increase of Fe loading. At 250 °C, the NO conversion was generally improved from 52.3 to 81.3% with an increase of Fe loading from 0 to 5%. The catalyst with a 3 wt% Fe loading had the widest temperature window and the best activity. It is worth noting that the 1V10W3FeTMS catalyst showed almost the same activity as the 1V10WTMS catalyst at higher temperature. This indicates that Fe could especially increase the activity of the SCR at low temperature. While the 1V10W1FeTMS catalyst and 1V10W5FeTMS catalyst showed lower activity than 1V10W3FeTMS, it may be attributed to the presence of less surface oxygen on the two catalysts than that on 1V10W3FeTMS. As seen in Fig. 8b, N2 selectivity over the 1V10WFeTMS catalyst at any temperature is higher than 90%. This indicates that the Fe-doped catalyst displays excellent N2 selectivity.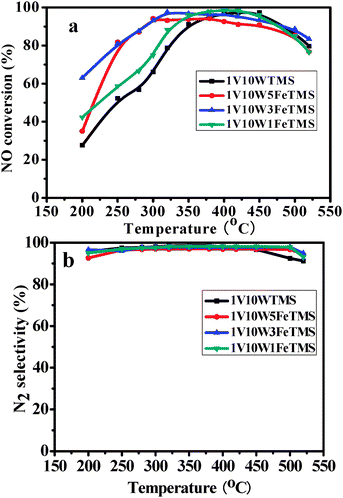 | ||
Fig. 8 (a) NO conversion against temperature under SCR conditions over different samples, (b) N2 selectivity against temperature under SCR conditions over different samples. 500 mL min−1 total rate, 550 ppm NO, 500 ppm NH3, 3% O2, and N2 balance, GHSV = 30![[thin space (1/6-em)]](https://www.rsc.org/images/entities/char_2009.gif) 000 h−1. 000 h−1. | ||
The SCR activities of the different catalysts indicated that Fe, V, and W elements supported on TiO2 had a positive synergetic interaction and accelerated the SCR reaction (Fig. S3, ESI†). The performance of 1V10W5FeTMS was better than that of 1% V2O5–10% WO3/5% Fe–TiO2 (common material) (shown in Fig. S4, ESI†). This phenomenon shows that the mesoporous spheres are more favorable for the title reaction. The catalyst exhibited its best performance at a calcination temperature of 550 °C (Fig. S5, ESI†). The NO conversion and selectivity of N2 over the 1V10W3FeTMS catalyst still kept above 80% and 92% after the second cycle (Fig. S6, ESI†). This finding clearly indicates that the 1V10W3FeTMS catalyst shows good stability which makes possible its further application as a good catalyst.
The effect of SO2 on NO conversion over the 1V10W3FeTMS, 1V10WTMS and 3FeTMS catalysts was shown in Fig. 9a. When 100 ppm SO2 was added to the reaction gases, the NO conversion over the 1V10W3FeTMS decreased from 97% to 75% in 1 h, and then nearly stabilized. After turning off SO2, the activity restored to 95%. The NO conversion over the 1V10WTMS decreased from 80% to 61% in 1 h after SO2 was added to the reaction, and then nearly stabilized. After removing SO2, the activity recovered to 71.8%. While the NO conversion over the 3FeTMS decreased from 94% to 70% in 1 h, and then nearly kept. When shutting off SO2, the activity restored to 76.6%. This indicates that the combination effect of iron oxide and V2O5–WO3/TiO2 could enhance the 1V10W3FeTMS catalyst resistance to SO2.
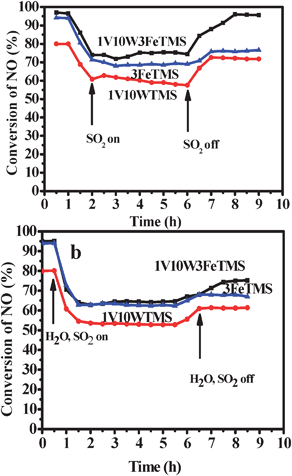 | ||
Fig. 9 (a) The effect of SO2 on NO conversion over the 1V10W3FeTMS, 1V10WTMS, and 3FeTMS catalysts. (b) The effect of SO2 and H2O on NO conversion over the 1V10W3FeTMS, 1V10WTMS catalysts. 500 mL min−1 total rate, 550 ppm NO, 500 ppm NH3, 3% O2, 10% H2O (when used), 100 ppm SO2 (when used) and N2 balance, and 3FeTMS 320 °C, GHSV = 30![[thin space (1/6-em)]](https://www.rsc.org/images/entities/char_2009.gif) 000 h−1. 000 h−1. | ||
The effect of SO2 and H2O on NO conversion over the 1V10W3FeTMS, 1V10WTMSand 3FeTMS catalysts was shown in Fig. 9b. When 100 ppm SO2 and 10% H2O were added to the reactants, the NO conversion over the 1V10W3FeTMS catalyst rapidly decreased from 97% to 64% in 1 h, and then nearly stabilized. After turning off SO2 and H2O, the activity restored to 75%. The NO conversion over the 1V10WTMS catalyst decreases from 80% to 53% in 1 h, and then nearly kept. After removing SO2 and H2O, the activity restored to 61%. For the 3FeTMS catalyst, the NO conversion reduces from 94% to 62% in 1 h, and then nearly stabilizes. After shutting off SO2 and H2O, the activity recovered to 67%. These results indicate that the resistance to the mixture of H2O and SO2 over the 1V10W3FeTMS catalyst is stronger than the 3FeTMS catalyst. This indicates that the addition of V2O5 and WO3 oxide could increase 3FeTMS catalyst resistance to SO2 and H2O. The decreased activity is mainly caused by the tightly adsorbed SO2, the formed sulfates, and the other species on the surface occupy the active sites, which decrease the SCR activity.
For the SCR of NOx with NH3, two reaction routes have been proposed: the “standard” reaction occurring between NH3 with NO, and the “fast” SCR reaction where both NO and NO2 are involved. The “fast” path has an important contribution, particularly at low temperature. So the generation of NO2 from NO is a key factor.38 The conversion of NO to NO2 over the different catalysts was measured and listed in Fig. S7 (ESI†). It is obvious that the introduction of Fe additive to the catalyst increases the oxidation activity of NO to NO2. It has been accepted that NO is more readily reduced to N2 along with a portion of NO2 than single NO by NH3.39,40 The introduction of iron oxide increases the oxidation rate of NO to NO2, which increases the SCR activity.
3.3 Correlation between catalytic activity and structures
It is confirmed that 1V10W3FeTMS exhibits the best activity among all the employed catalysts in the SCR reaction. It is demonstrated that the active components of vanadium oxide and tungsten oxide were well-dispersed on the surface of the iron oxide coated TiO2 microspheres, and the integration of Fe3+ with the VWTMS catalyst can enhance the oxidative ability of the VWFeTMS catalyst. It is clear that the dominant tungsten and vanadia oxides over these catalysts are monomeric and low polymeric oxide species. Based on the characterization results above, the surface oxygen Oα is more reactive in oxidation reactions due to its high mobility than lattice oxygen Oβ, which is beneficial to the NO oxidation to NO2 in the SCR reaction. Herein, the Oα/Oα + Oβ ratio of the 1V10W3FeTMS catalyst is much higher than that of the other catalysts, indicating the presence of more abundant surface oxygen. We proposed electron transfer between V and Fe in Scheme 1. The V and Fe species are interconnected in the form of V–O–Fe through oxygen bridges, facilitating electron transfer. This is beneficial for the enhancement of NO oxidation and thus the SCR activity. This agrees with the experiment of the conversion of NO to NO2 over 1V10W3FeTMS catalysts. The NOx-TPD results show that the appropriate Fe2O3 species can improve basic sites over the 1V10WTMS on which the NOx species were adsorbed and the active nitrate species could be easily formed resulting in the enhanced low-temperature SCR activity of the 1V10WTMS.23 In addition, as compared with the 1V10WTMS catalyst, the monodentate nitrate of the 1V10W3FeTMS was obviously more. The M–O–NO2 (M![[double bond, length as m-dash]](https://www.rsc.org/images/entities/char_e001.gif) Fe) species could rapidly react with adjacent adsorbed NH4+ or NH3 to produce more reactive intermediates M–O–NO2[NH4+]2 or M–O–NO2[NH3]2, which could further react with gaseous NO to form N2 and H2O.41
Fe) species could rapidly react with adjacent adsorbed NH4+ or NH3 to produce more reactive intermediates M–O–NO2[NH4+]2 or M–O–NO2[NH3]2, which could further react with gaseous NO to form N2 and H2O.41
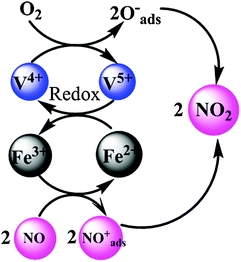 | ||
| Scheme 1 A redox catalytic cycle of the low temperature SCR reaction over VWFeTMS catalysts. | ||
4. Conclusion
The catalytic activity of 1V10WTMS was greatly enhanced by the addition of 3 wt% of Fe in the temperature range of 200–500 °C. V2O5 and WO3 could enhance the 3FeTMS catalyst resistance to SO2. The XRD results indicate that the active components of V and W oxides are well-dispersed. The Raman spectra indicate that the dominant vanadia and tungsten oxides over these catalysts are the monomeric and oligomeric tetrahedrally coordinated vanadia and tungsten species. NOx-TPD results show that the appropriate Fe2O3 species can improve basic sites over the 1V10WTMS on which the NOx species were adsorbed. The H2-TPR indicated that the addition of Fe over the VWTMS catalyst enhanced the oxidative ability of the VWFeTMS catalyst. The Oα/Oα + Oβ ratio of the 1V10W3FeTMS catalyst is much higher than that of the other catalysts resulting in the enhancement of NO oxidation and thus the SCR activity. Moreover the IR-NO + O2 results show the monodentate nitrate species are essential for the SCR reaction.Acknowledgements
The authors acknowledge the support of National Natural Science Foundation of China (51108258), Science and Technology Commission of Shanghai Municipality (10540500100 & 11nm0502200), Research Fund for the innovation Program of Shanghai University (A.10040711003), Shanghai Municipal Education Commission (B.37040711001), and Key Subject of Shanghai Municipal Education Commission (J50102). The authors would like to thank Prof. Y. L. Chu and Prof. W. J. Yu from analysis and test center of Shanghai University for help with the SEM and TEM measurements.Notes and references
- S. M. Jung and P. Grange, Appl. Catal., B, 2001, 32, 123 CrossRef CAS.
- R. Q. Long and R. T. Yang, Appl. Catal., B, 2000, 24, 13 CrossRef CAS.
- H. J. Chae, I. S. Nam, S. W. Ham and S. B. Hong, Appl. Catal., B, 2004, 53, 117 CrossRef CAS.
- G. Ramis, L. Yi, G. Busca, M. Turco, E. Kotur and R. J. Willey, J. Catal., 1995, 157, 523 CrossRef CAS.
- L. Chmielarz, P. Kuśtrowski, M. Zbroja, W. Łasocha and R. Dziembaj, Catal. Today, 2004, 90, 43 CrossRef CAS.
- M. Brandhorst, J. Zajac, D. J. Jones, J. Rozière, M. Womes, A. Jimenez-López and E. Rodríguez-Castellón, Appl. Catal., B, 2005, 55, 267 CrossRef CAS.
- S. Roy, B. Viswanath, M. S. Hegde and G. Madras, J. Phys. Chem. C, 2008, 112, 6002 CAS.
- N. Apostolescu, B. Geiger, K. Hizbullah, M. T. Jan, S. Kureti, D. Reichert, F. Schott and W. Weisweiler, Appl. Catal., B, 2006, 62, 104 CrossRef CAS.
- G. H. Yao, F. Wang, X. B. Wang and K. T. Gui, Energy, 2010, 35, 2295 CrossRef CAS.
- S. Brandenberger, O. Kröcher, M. Casapu, A. Tissler and R. Althoff, Appl. Catal., B, 2011, 101, 649 CrossRef CAS.
- A. Z. Ma and W. Grunert, Chem. Commun., 1999, 71 RSC.
- J. Li, R. Zhu, Y. Cheng, C. K. Lambert and R. T. Yang, Environ. Sci. Technol., 2010, 44, 1799 CrossRef CAS.
- O. Kröcher, M. Devadas, M. Elsener, A. Wokaun, N. Söger, M. Pfeifer, Y. Demel and L. Mussmann, Appl. Catal., B, 2006, 66, 208 CrossRef.
- F. Liu and H. He, J. Phys. Chem. C, 2010, 114, 16929 CAS.
- S. Putluru, A. Riisager and R. Fehrmann, Catal. Lett., 2009, 133, 370 CrossRef CAS.
- G. Madia, M. Elsener, M. Koebel, F. Raimondi and A. Wokaun, Appl. Catal., B, 2002, 39, 181 CrossRef CAS.
- M. D. Amiridis, R. V. Duevel and I. E. Wachs, Appl. Catal., B, 1999, 20, 111 CrossRef CAS.
- I. Giakoumelou, C. Fountzoula, C. Kordulis and S. Boghosian, J. Catal., 2006, 239, 1 CrossRef CAS.
- X. L. Yang, W. L. Dai, C. Guo, H. Chen, Y. Cao, H. Li, H. He and K. Fan, J. Catal., 2005, 234, 438 CrossRef CAS.
- C. W. Guo, Y. Cao, S. H. Xie, W. L. Dai and K. N. Fan, Chem. Commun., 2003, 700 RSC.
- L. K. Boudali, A. Ghorbel, P. Grange and F. Figueras, Appl. Catal., B, 2005, 59, 105 CrossRef CAS.
- R. Jin, Y. Liu, Z. Wu, H. Wang and T. Gu, Catal. Today, 2010, 153, 84 CrossRef CAS.
- F. Liu, K. Asakura, H. He, W. Shan, X. Shi and C. Zhang, Appl. Catal., B, 2011, 103, 369 CrossRef CAS.
- F. Liu, H. He, Y. Ding and C. Zhang, Appl. Catal., B, 2009, 93, 194 CrossRef CAS.
- Y. M. Liu, Y. Cao, S. R. Yan, W. L. Dai and K. N. Fan, Catal. Lett., 2003, 88, 61 CrossRef CAS.
- R. Gao, W. L. Dai, X. Yang, H. Li and K. Fan, Appl. Catal., A, 2007, 332, 138 CrossRef CAS.
- L. Lietti, I. Nova, G. Ramis, L. Dall'Acqua, G. Busca, E. Giamello, P. Forzatti and F. Bregani, J. Catal., 1999, 187, 419 CrossRef CAS.
- L. J. Alemany, L. Lietti, N. Ferlazzo, P. Forzatti, G. Busca, E. Giamello and F. Bregani, J. Catal., 1995, 155, 117 CrossRef CAS.
- J. Y. Lee, S. H. Hong, S. P. Cho and S. C. Hong, Curr. Appl. Phys., 2006, 6, 996 CrossRef.
- E. P. Reddy, L. Davydov and P. G. Smirniotis, J. Phys. Chem. B, 2002, 106, 3394 CrossRef CAS.
- M. Santhosh Kumar, M. Schwidder, W. Grünert and U. Bentrup, J. Catal., 2006, 239, 173 CrossRef CAS.
- M. Kang, E. D. Park, J. M. Kim and J. E. Yie, Appl. Catal., A, 2007, 327, 261 CrossRef CAS.
- H. Chen, A. Sayari, A. Adnot and F. ç. Larachi, Appl. Catal., B, 2001, 32, 195–204 CrossRef CAS.
- L. Chen, J. Li and M. Ge, J. Phys. Chem. C, 2009, 113, 21177 CAS.
- S. D. Lin, A. C. Gluhoi and B. E. Nieuwenhuys, Catal. Today, 2004, 90, 3 CrossRef CAS.
- M. A. Larrubia, G. Ramis and G. Busca, Appl. Catal., B, 2000, 27, L145 CrossRef CAS.
- N. Y. Topsøe, Science, 1994, 265, 1217 Search PubMed.
- M. Casapu, O. Krocher, M. Mehring, M. Nachtegaal, C. Borca, M. Harfouche and D. Grolimund, J. Phys. Chem. C, 2010, 114, 9791 CAS.
- M. Koebel, G. Madia and M. Elsener, Catal. Today, 2002, 73, 239 CrossRef CAS.
- G. Qi and R. T. Yang, Appl. Catal., B, 2003, 44, 217 CrossRef CAS.
- R. Q. Long and R. T. Yang, J. Catal., 2000, 190, 22 CrossRef CAS.
Footnote |
| † Electronic supplementary information (ESI) available: The morphology of 1V10W3FeTMS catalysts, and the catalytic performance of samples with various fabrication parameters. See DOI: 10.1039/c2cy20332d |
| This journal is © The Royal Society of Chemistry 2013 |
