The different NOx trap performance on ceria and barium/ceria containing LNT catalysts below 200 °C
Xinquan
Wang
a,
Liangfang
Lv
a,
Qingqing
Zhang
a,
Yuewei
Zhang
a,
Jun
Wang
a and
Meiqing
Shen
*ab
aKey Laboratory for Green Chemical Technology of State Education Ministry, School of Chemical Engineering & Technology, Tianjin University, Tianjin 300072, China. E-mail: mqshen@tju.edu.cn; Fax: +86 22 27892301; Tel: +86 22 27892301
bState Key Laboratory of Engines, Tianjin University, Tianjin 300072, China
First published on 30th August 2012
Abstract
The low-temperature NOx storage efficiency of Ce-containing lean NOx trap catalysts was investigated using temperature programmed adsorption. The incorporation of ceria either as a NOx storage phase or as the support for barium oxides improves the NOx storage capacity from 200 °C to 350 °C. However, as temperature increases from 100 °C to 150 °C, the rate of NOx storage slows down over the catalysts containing ceria as a storage phase, while this phenomenon is less obvious if ceria is used as the support for barium oxides. By investigating the individual components of catalysts using NO-TPD, we found that the NOx release was mainly from ceria. Based on the in situ DRIFT data, we conclude that nitrite species are formed on ceria during the NOx storage at low temperatures, and the nitrite species can be activated and transformed to nitrate species upon further oxidation, accompanied by NO release; on the other hand, NO release occurs weakly on barium/ceria as the nitrites are more stable on the more basic Ba phase than on the ceria. In addition, the dispersion of barium species on ceria is higher than that on γ-Al2O3, resulting in the formation of a larger amount of basic sites. The addition of barium onto ceria not only improves the stability of ad-NOx species but also positively impacts the amounts of NOx trapped.
1. Introduction
Compared with normal gasoline engines, lean burn gasoline and diesel engines are more fuel efficient and emit less CO2. However, the conventional three-way catalyst is ineffective in eliminating NOx under oxygen-rich (lean) conditions. There is a general consensus that a lean NOx trap (LNT) catalyst, comprising precious metals (Pt, Rh) and alkaline-earth metal oxide (e.g. BaO) supported on a high surface area support (γ-Al2O3), is one of the promising solutions to reduce NOx emissions from lean-burn engine exhaust.1 During the lean cycle (normal engine operation), NOx is stored on the alkaline-earth metal oxide in the form of nitrites and nitrates for a few minutes. As the LNT catalyst becomes saturated with stored NOx, a rich transient is introduced lasting a few seconds, which reduces the stored NOx to N2.One of the major challenges facing LNT catalysts is insufficient NOx storage capacity at low temperature.2 The average exhaust temperature from diesel cars is below 150 °C for the city portion (ECE, first 800 seconds) of the European driving cycle (NEDC, 1200 seconds). A current strategy of most of the car manufacturers is to trap NOx for the entire ECE portion and regenerate the catalyst during the high-temperature, high-speed portion (EUDC, the last 400 seconds).
Because of their oxygen storage capacity and their ability to modulate oxygen partial pressure of automotive exhaust around the stoichiometric point, ceria-containing materials are widely used in three-way catalysts. Recently, ceria-containing materials were found to trap NOx below 400 °C in a lean environment,3–6 which increases the overall NOx storage capacity of a Ba–NOx trap.7 However, there is limited work focusing on the stability of adsorbed NOx species below 150 °C, which is an important issue for the application of LNT catalysts because diesel car exhaust is typically below 150 °C for city driving and the desorption of NOx species upon acceleration will decrease the overall NOx conversion.
In this work, we report the low-temperature, NOx storage efficiency on ceria-containing catalysts using temperature programmed adsorption (TPA) experiments. Ceria serves as either a NOx trapping component or a support for Ba. Combined with the results of in situ DRIFT and NO-TPD experiments, we discuss the relationship between the stability of adsorbed NOx species and NOx trap efficiency.
2. Experimental
2.1 Catalysts preparation
Pt/Al2O3 (133.5 m2 g−1) was prepared by impregnating Pt(NO3)2 solution on a γ-Al2O3 (136.5 m2 g−1) support using the incipient wetness technique to reach a Pt loading of 2% by weight. The impregnated powder was dried in the air overnight at 100 °C and then calcinated in air at 500 °C for 5 h.20 wt% of BaO was loaded on CeO2 (BC, 95.8 m2 g−1) or Al2O3 (BA, 90.0 m2 g−1) by impregnating barium acetate solution on the powders. The impregnated powder was dried in the air overnight at 100 °C and subsequently calcinated in air at 500 °C for 5 h. γ-Al2O3 and CeO2 (153.8 m2 g−1) were provided by BASF Corporation.
2.2 Reaction tests and characterizations
![[thin space (1/6-em)]](https://www.rsc.org/images/entities/char_2009.gif) 000 h−1.
000 h−1.
A NICOLET 380 FT-IR spectrometer, equipped with a two meter gas cell, was used to detect the outlet concentrations of NO, NO2, NH3, N2O, CO, CO2, and H2O (g) at a 4 second interval. TPA was performed within the temperature range of 100–400 °C with a feed gas consisting of 120 ppm NO, 10% O2, 5% CO2, 6% H2O, and N2 balance. A typical TPA experimental consists the following steps: (1) heating a sample to 450 °C in 5% CO2–6% H2O–N2 balance, (2) reducing it at the same temperature in 7.5% CO–5% CO2–6% H2O–N2 balance for 5 min, (3) cooling the sample to 100 °C in 5% CO2–6% H2O–N2 balance, (4) holding the sample at 100 °C for 5 min in 120 ppm NO–10% O2–5% CO2–6% H2O–N2 balance, and (5) heating the sample to 400 °C at 10 °C min−1 in the same environment. The NOx storage efficiency is defined as
| NOx storage efficiency = (120 − NOxoutlet)/120 × 100% |
NO adsorptions were conducted by introducing 120 ppm NO–10% O2–N2 balance into the chamber at 100 °C for 40 min, purging the sample with N2 for 10 min, and heating the sample to 200 °C at 10 °C min−1 in N2 flow (100 mL min−1). The adsorbed species were recorded as a function of time/temperature.
3. Results
3.1 NOx storage efficiency
Fig. 1 compares the NOx storage efficiency on PA–BA, PA–Ce and PA–BC samples as a function of temperature. During temperature ramp, the highest NOx storage efficiency over PA–BA is 24% at 305 °C, and those over PA–Ce and PA–BC are 29% at 260 °C and 43% at 330 °C, respectively. The improvement in NOx storage efficiency by incorporating ceria into Ba-based NSR catalysts is obvious, which is in consistent with the reported results.3,8–12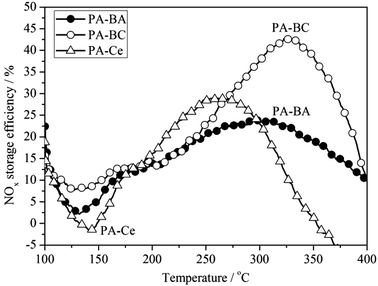 | ||
| Fig. 1 NOx storage efficiency obtained by TPA experiments. The samples were kept under 120 ppm NO–10% O2–5% CO2–6% H2O–N2 balance for 5 min, and then the temperature was increased to 400 °C at 10 °C min−1 under the same atmosphere conditions. | ||
However, there is a decrease in NOx storage efficiency as temperature increases from 100 °C to 150 °C, resulting in a minimum net storage efficiency of 2% on PA–BA, −2% on PA–Ce, and 8% on PA–BC. Net NOx release (catalyst outlet [NOx] is higher than the inlet [NOx]) was found on PA–Ce. The decrease in NOx storage efficiency with temperature ramp arises from the desorption/decomposition of the unstable stored NOx during the isothermal period (first 5 min at 100 °C, see Section 2.2.1). The net NOx release on PA–Ce indicates that a large amount of unstable adsorbed NOx species desorbs easily.
3.2 In situ DRIFTS
The stability of adsorbed NOx species was investigated by in situ DRIFT experiments. After an oxidation pre-treatment, a sample was kept in NO–O2 flow at 100 °C for 40 min. After purging the sample with N2 for 10 min, we increased the temperature from 100 to 200 °C at 10 °C min−1.Fig. 2a shows the DRIFT spectra of NOx adsorption on PA–BA. The main adsorption band appeared at 1230 cm−1 on PA–BA due to the formation of Ba nitrites,13 and its intensity increased with time. Another band was found at 1310 cm−1, with a lower intensity than that at 1230 cm−1, attributed to the monodentate nitrates on BaO. A band appeared at 1532 cm−1, due to the formation of bidentate nitrates.14–16 The band at 1532 cm−1 later blue shifted to 1546 cm−1. The intensity of the 1546 cm−1 band on PA–BA is lower than those of two other major bands (1230 and 1310 cm−1), and this may be due to the low surface sensitivity of DRIFT because of the surface-scattering effects,17–19 where the NOx species in the bulk of storage material could not be detected. Fig. 2c shows the desorption spectra of the NOx species adsorbed on PA–BA. After heating up to 200 °C in N2, we found that the intensity of the 1230 cm−1 (Ba nitrites) band decreased slightly as temperature increased from 100 to 200 °C, while that of the 1310 cm−1 (Ba nitrates) band remained the same. The intensity of the band at 1546 cm−1 was almost unchanged.
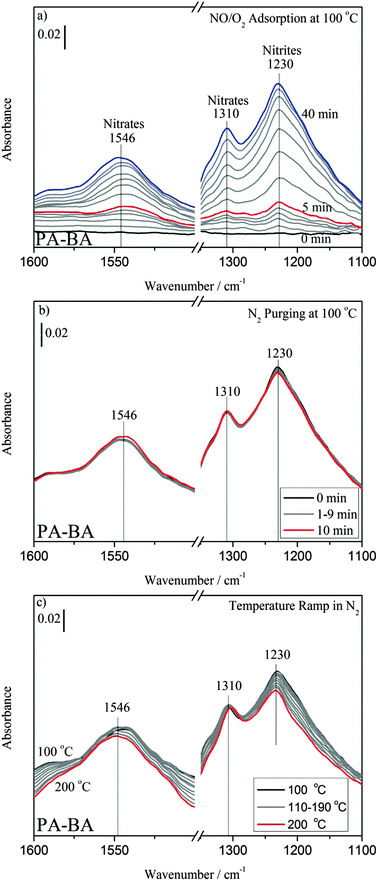 | ||
| Fig. 2 DRIFT spectra of (a) NOx adsorptions, (b) N2 purging and (c) temperature ramp on PA–BA. The samples were kept under 120 ppm NO–10% O2–N2 balance at 100 °C for 40 min. Subsequently, the samples were purged with N2 for 10 min and were heated up to 200 °C at 10 °C min−1 in N2 flow. | ||
Fig. 3a shows the DRIFT spectra of NOx adsorption on PA–Ce. The band emerges at 1180 cm−1 with high intensity due to the asymmetric N–O stretching mode of chelating bidentate nitrites adsorbed on the surface of CeO2.20–22 Its intensity increased with time up to 25 min and then decreased slightly after that. The band at 1306 cm−1 may be another type of nitrite species, which gradually red shifted to 1292 cm−1 during NOx adsorption.
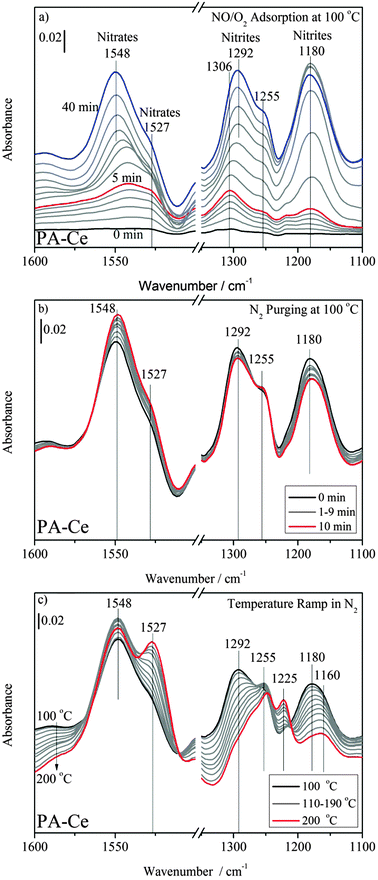 | ||
| Fig. 3 DRIFT spectra of (a) NOx adsorptions, (b) N2 purging and (c) temperature ramp on PA–Ce. The samples were kept under 120 ppm NO–10% O2–N2 balance at 100 °C for 40 min. Subsequently, the samples were purged with N2 for 10 min and were heated up to 200 °C at 10 °C min−1 in N2 flow. | ||
The intensities of the 1180 and 1292 cm−1 bands decreased obviously during the purge period (Fig. 3b), while that of the band at 1230 cm−1 on PA–BA remained unchanged (Fig. 2b). Upon increasing the temperature to 200 °C, however, the band at 1292 cm−1 disappeared completely and the band at 1180 cm−1 decreased significantly and red shifted to 1160 cm−1 (Fig. 3c). These results indicate that the nitrite species formed on ceria are unstable.
For nitrate species shown in Fig. 3a, the bands at 1541 and 1255 cm−1 are due to the formation of chelating bidentate nitrates.23 And the band at 1541 cm−1 gradually blue shifted to 1548 cm−1 as the adsorption proceeded. The discrete frequency shifts to higher wavenumbers can be explained by the repulsive interactions among the adsorbed molecules at a higher surface coverage.21 Further, we found a new pair of bands at 1527 and 1225 cm−1 and assign them to another kind of nitrates.22,23
During N2 purging (Fig. 3b), the band at 1545 cm−1 increased unexpectedly but decreased slightly with temperature (Fig. 3c). On the other hand, the bands at 1527 and 1223 cm−1 grew with temperature in N2.
Fig. 4 depicts the evolution of nitrites and nitrates on PA–Ce under NO–O2 conditions at 100 °C for 40 min. The intensities of the bands at 1180 cm−1 and 1541–1548 cm−1 reflect the surface concentrations of nitrites and nitrates, respectively. The intensity of the 1180 cm−1 band increases quickly for the initial 20 min, gradually reaching to its peak between 25 and 30 min, and then decreases slightly after 30 min. The nitrite species strongly adsorbs on the surface of ceria and proceeds with the process of adsorption → saturation → decomposition. Meanwhile, the formation of chelating bidentate nitrates (1545 cm−1) is relatively slow during the first 20 min but increases quickly after 35 min when the rate of formation of nitrites (1180 cm−1) is near constant or decreasing. It is possible that the decomposition of nitrites (1180 cm−1) creates O*, which facilitates the formation of nitrates (1545 cm−1). Moreover, the DRIFT spectra collected during N2 purging (Fig. 3b) show that PA–Ce displays the opposite trends in surface concentration between nitrites (1180 cm−1) and nitrates (1545 cm−1). Based on this observation, we can propose a pathway for the formation of the chelating bidentate nitrites. As shown in Scheme 1 (pathway I), surface saturation leads to the formation of sites with two neighboring adsorbed nitrites; one surface nitrite is activated by weakening one of its N–O bonds, which decomposes easily, leaving O* on the surface and releasing NO into gas phase; the other nitrite then reacts with O* forming a surface nitrate.
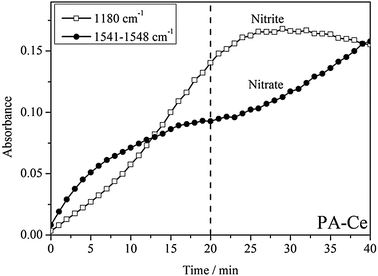 | ||
| Fig. 4 The evolution of the intensities for nitrites and nitrates on PA–Ce by in situ DRIFT experiments. The sample was kept under 120 ppm NO–10% O2–N2 balance at 100 °C for 40 min. | ||
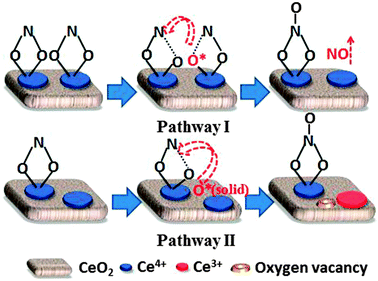 | ||
| Scheme 1 The transformation of nitrite to nitrate species under NO–O2 conditions at low temperatures. | ||
On the other hand, many authors reported the direct oxidation of nitrites by surface O* of the catalyst22,24,25 and observed weak vibration of nitrites due to enhanced transformation from nitrite to nitrate by fast oxygen mobility at high temperatures.26 During the temperature ramp in N2 (Fig. 3c), unlike other bands, the bands at 1527 and 1225 cm−1 increased, with temperature, perhaps due to the formation of another kind of nitrate species.22 Therefore, another pathway for the formation of nitrates can be proposed. As shown in Scheme 1 (pathway II), higher temperature increases oxygen mobility on ceria and promotes the formation of intrinsic O*, and O* can oxidize the nitrite species forming nitrates.
Fig. 5a shows the DRIFT spectra of NOx adsorption on PA–BC. The intensive nitrite bands that appeared at 1198 cm−1 and 1130 cm−110,27–30 remained unchanged during N2 purging (Fig. 5b) but decreased slightly with increasing temperature (Fig. 5c). Comparing with the nitrite species on PA–Ce, the nitrite species on both the PA–BA and PA–BC samples exert the higher stability.
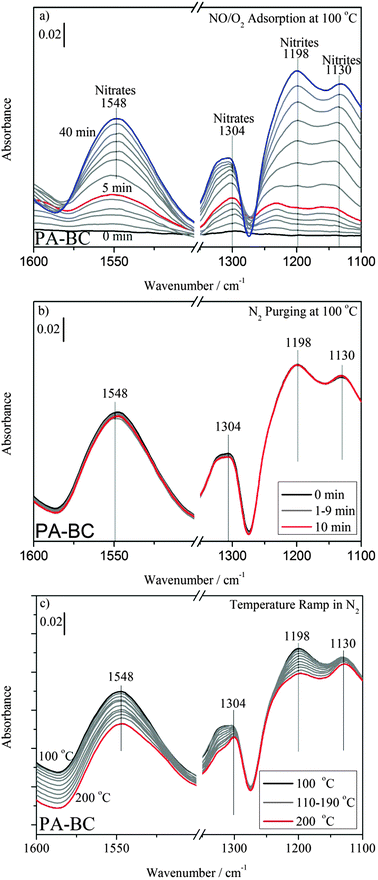 | ||
| Fig. 5 DRIFT spectra of (a) NOx adsorptions, (b) N2 purging and (c) temperature ramp on PA–BC. The samples were kept under 120 ppm NO–10% O2–N2 balance at 100 °C for 40 min. Subsequently, the samples were purged with N2 for 10 min and were heated up to 200 °C at 10 °C min−1 in N2 flow. | ||
3.3 NO-TPD
The stability of adsorbed NOx species was also investigated by NO-TPD experiments. Fig. 6a shows NO-TPD profiles on the three components: BA, Ce and BC. After an oxidation treatment, the sample had been kept under NO–O2 atmospheres for 5 min at 100 °C. The sample was then purged for 12 min with N2 and heated up to 400 °C at 10 °C min−1 in N2.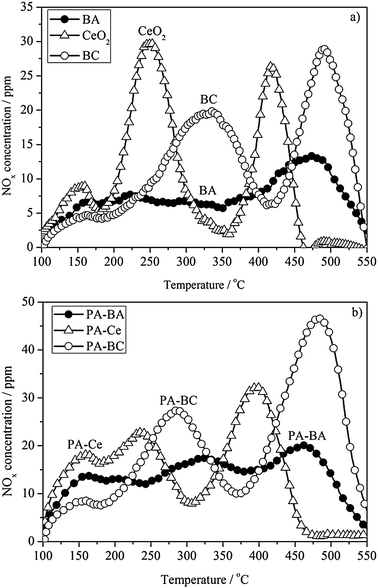 | ||
| Fig. 6 The evolution of NOx concentration during NO-TPD experiments. The samples were kept under 120 ppm NO–10% O2–N2 balance for 5 min at 100 °C. After N2 purging at 100 °C for 12 min, the temperature was increased to 550 °C with 10 °C min−1 under N2 flow. | ||
Table 1 shows the amount of NOx adsorbed during the adsorption period, the amounts of NOx desorbed during purge and TPD periods. The integrated amount of NOx in (purging + TPD) period is slightly higher than that in (NOx adsorption) period. This is because the NOx species in the gas phase cannot be cleaned up immediately at the initial period of N2 purging. However, the mass balance of adsorbed and desorbed NOx is better than 95% for all samples. The amounts of adsorbed NOx on CeO2 (12.4 μmol) and BC (12.8 μmol) are higher than that on BA (9.5 μmol). During the purge period, the amount of desorbed NOx follows the order, CeO2 (3.4 μmol) > BA (2.5 μmol) ≈ BC (2.4 μmol). The TPD results show that ceria enhances NOx adsorption, and the ad-NOx is more stable when barium is also present.
| Sample | NOx adsorption (μmol) | Purging (μmol) | TPD (μmol) |
|---|---|---|---|
| BA | 9.5 | 2.5 | 7.0 |
| CeO2 | 12.4 | 3.4 | 9.4 |
| BC | 12.8 | 2.4 | 11.2 |
On BA, the rate of NOx desorption was constant below 400 °C, and as temperature increased further, NOx desorption peaked at 470 °C. The two ceria containing components show very different desorption features from BA. Ceria has three desorption peaks, a weaker one at 160 °C and two strong ones at 250 and 420 °C. Similarly, BC has a weaker peak at 160 °C, but the two stronger peaks appear at higher temperatures (330 and 490 °C) compared with those on CeO2. This suggests that the NOx species adsorbed on BC is more stable than that on CeO2.
Fig. 6b shows the comparison of TPD profiles between PA–Ce and PA–BC with PA–BA as reference. On PA–Ce, a large amount of NO desorbs around 160 and 230 °C, while on PA–BC the first desorption peak appears around 280 °C. Our DRIFT spectra show that the nitrite species (1292 cm−1 and 1180 cm−1) are almost disappeared below 200 °C on PA–Ce (Fig. 3c), while they (1198 cm−1 and 1130 cm−1) are still at a relatively high level on PA–BC (Fig. 5c). This confirms that barium oxide enhances the stability of surface nitrite species.
Both the PA–BA and PA–BC samples exhibit two main NO desorption peaks around 300 °C and 475 °C, i.e. the stability of adsorbed NOx species on PA–BC is similar to that on PA–BA. However, the amount of adsorbed NOx species on PA–BC is about 1.5 times of that on PA–BA.
3.4 CO2-TPD
The basicity of the catalysts is crucial to the stability of the adsorbed NOx species. Fig. 7 compares the basicity of BA, CeO2 and BC measured by CO2-TPD. The integrated quantity of CO2 desorbed decreases in the following order: BC (222.0 μmol g−1) > BA (116.7 μmol g−1) ≈ CeO2 (112.6 μmol g−1). The BC sample possesses the largest amount of basic sites among the samples investigated in this work.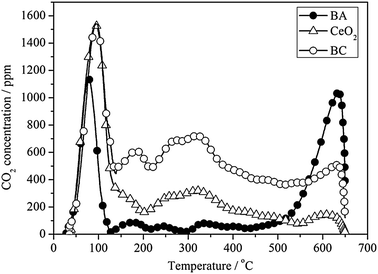 | ||
| Fig. 7 The evolution of CO2 concentration during CO2-TPD experiments. The samples were kept under 25% CO2–N2 until saturation was achieved. After purging under N2, the temperature was increased from 30 °C to 650 °C at 10 °C min−1 in N2 flow. | ||
Moreover, we can attribute different basic strengths depending on the CO2 desorption temperature. Both the CeO2 and BC samples exhibit one intense peak around 100 °C and a long CO2 desorption tail up to 550 °C. While for the BA sample, there is a CO2 desorption peak with a lower intensity around 70 °C, and an intensive desorption peak at 600 °C. According to our previous work, the peak around 100 °C is due to the decomposition of bicarbonates.31 All of the CeO2, BC and BA samples exhibit the similar amount of such kinds of weak basic sites. The evolution of CO2 in the 200–500 °C range can be attributed mainly to the decomposition of amorphous BaCO3.32,33 The BC sample possesses the largest amount of such kinds of medium basic sites, while it is limited to detection on the BA sample. And the intensive CO2 peak at 600 °C can be attributed to the decomposition of crystalline BaCO3.33 The BA sample exerts the highest amount of such strong basic sites.
Piacentini et al. found that the thermal stability of supported BaCO3 species depends on their interaction with the alumina support:33 (1) the BaCO3 species, being in intimate contact with the support, are unstable. They can be decomposed during calcination at 500 °C. (2) The most stable are bulk-like BaCO3 species, which are not in contact with the alumina support. Therefore, the different CO2 desorption behavior obtained for the BC and BA samples indicates that the barium species are in close contact with ceria, however, the BaCO3 species on alumina is more bulk like, although BaO-loading (20 wt%) on CeO2 and Al2O3 is the same.
3.5 XRD
Fig. 8 shows the XRD patterns of the BC, CeO2, BA and γ-Al2O3 samples. The presence of micro-crystalline γ-Al2O3 (JCPDS 75-0921) is evident (Fig. 8, curve d). The crystalline BaCO3 whiterite phase (JCPDS 45-1471) appears on the BA sample (Fig. 8, curve c), and the crystalline size of BaCO3 equals to 12.8 nm. The results are in agreement with a previous study33 that the presence of crystalline BaCO3 occurs for Ba-loadings higher than 16.7 wt%.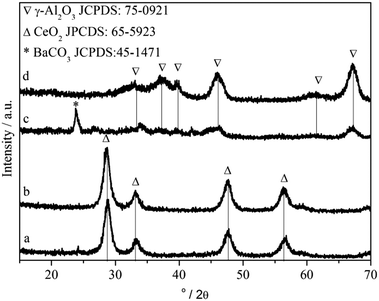 | ||
| Fig. 8 XRD patterns of (a) BC, (b) CeO2, (c) BA and (d) γ-Al2O3. | ||
In the case of the BC sample, the peak profiles show four main peaks between 20° and 80°, indicating the presence of micro-crystalline CeO2 (JCPDS 65-5923) (Fig. 8 curve a). Ba-containing species are X-ray amorphous (Fig. 8, curve b). It suggests that the Ba phase is well-dispersed over the CeO2 support. In our previous work,34 we have found that higher Ce content of CexZr1−xO2 favors small BaCO3 particles, which is probably due to Ba–Ce contact hindering crystallization of BaCO3.35
3.6 HR-TEM
The dispersion of BaCO3 on the BA and BC samples is supported by the HR-TEM analysis presented in Fig. 9. The presence of (111) planes at 0.37 nm and (122) planes at 0.22 nm on the BA sample is shown by the relevant selected area diffraction pattern of the crystallites, indicating the traces of crystalline BaCO3. While only the feature of CeO2 surface lattice strips, i.e. (111) planes at 0.31 nm, (220) planes at 0.19 nm and (222) planes at 0.15 nm, is discernible on the BC sample.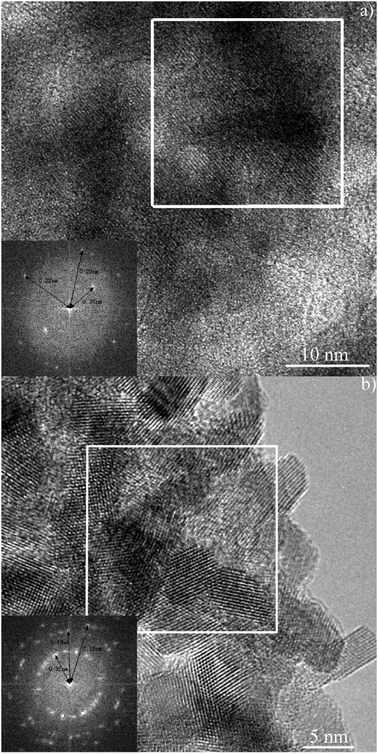 | ||
| Fig. 9 Transmission electron micrograph of BA (a) and BC (b). Inset illustrates the relevant selected area diffraction pattern of the crystallites. | ||
4. Discussion
For ceria-containing samples, where ceria is a NOx storage component, there was a net decrease in NOx storage efficiency (−2%) as temperature increased from 100 °C to 150 °C. When ceria is used as a support for barium (PA–BC), the drop in NOx storage efficiency (8%) is less. It indicates that the stability of adsorbed NOx species is crucial to NOx trapping at low temperatures.Having exposed ceria-containing samples to NO–O2 for 40 min at 100 °C, we observed large amounts of nitrites formed on PA–Ce (high-intensity bands at 1180 and 1292 cm−1) and on PA–BC (1198 cm−1 and 1130 cm−1). The rate of formation of chelating bidentate nitrates (1180 cm−1) on PA–Ce is the fastest, the band achieves saturation in 25 min. This suggests that nitrite formed on ceria is a major contributor of its NOx storage capacity at 100 °C.
However, bidentate nitrites disappeared upon increasing temperature to 200 °C. The net NO release was found below 200 °C on PA–Ce during the TPA experiments (Fig. 1). The decrease in the NOx storage efficiency coincides with the decomposition/transformation of the bidentate nitrites observed by in situ DRIFT. This suggests that the instability of the bidentate nitrites (1180 cm−1) is the main cause of slowing down the NOx storage process during temperature ramp. Indeed, as shown in Fig. 3c, the rate of decrease in band intensity at 1180 cm−1–1160 cm−1 (bidentate nitrites) is obviously higher than the rate of the increase at 1550 cm−1 (nitrates). Although, a large amount of nitrites forms on PA–Ce in NO–O2 at 100 °C, not all the nitrites are transformed to nitrates during our TPA experiment. Therefore, the main cause for NO desorption is the decomposition of nitrite species. The defective ceria surface facilitates the decomposition of nitrites. We found that the band at 1180 cm−1 red shifted to 1160 cm−1 upon increasing temperature from 100 °C to 200 °C. As reported in the literature for both experimental36 and theoretical data,37 the red shift of the 1180 cm−1 band indicates the elongation of the N–O bond in nitrite species formed at oxygen vacancy sites of CeO2, which is the initiation step for nitrites decomposition.21,38 In this work, the nitrite species with an elongated N–O bond dissociate into O* and NO, and the latter species release into the gas phase. However, the activation of nitrites (frequency red shift) does not occur on the BC sample (Fig. 5c), indicating that the adsorbed nitrites are not in close contact with ceria, which makes the dissociation of nitrites difficult to happen. Moreover, it is not surprising that nitrites are more stable on PA–BC than on PA–Ce since nitrites would be more stable on the more basic Ba phase than on the support.12
The introduction of barium inhibits NO release significantly with temperature ramp, however, the NOx storage efficiency varies by substitution of alumina for ceria. The PA–BC sample exerts higher NOx storage efficiency than that on PA–BA within the whole investigated temperature range (100–400 °C). The results of CO2-TPD, XRD and HR-TEM characterizations manifest that barium species are well-dispersed on ceria while the BaCO3 phases on alumina are bulk like, although BaO-loading (20 wt%) on CeO2 and Al2O3 is the same. It is well-known that the well-dispersed BaCO3 provides a larger amount of basic sites and exerts the higher reactivity for NOx trapping.33 While the bulk like BaCO3 exhibits a poor NOx storage activity, which is affected by diffusional limitation.39,40 Therefore, the addition of barium onto ceria not only improves the stability of ad-NOx species but also positively impacts the amounts of NOx trapped.
Additionally, it is worth noting that the enhanced ad-NOx stability is beneficial for efficient NOx storage during lean periods but may decrease the rate of NOx reduction during rich periods.41 Considering the practical application, there would be a trade-off between efficient NOx storage and NOx reduction determined by the nature of the NOx storage component.
5. Conclusions
NOx storage efficiency has been evaluated using TPA experiments. We found that the incorporation of ceria either as a NOx storage component or as a support for barium increased the NOx storage capacity of the catalyst significantly between 150 °C and 350 °C. If ceria is used as a NOx storage component, the NO storage efficiency decreases with increasing temperature between 100 °C and 150 °C, if ceria is used as a support for Ba, however, the decrease in NO storage efficiency is small. Using in situ DRIFT, we can conclude that NO release from the ceria surface is a consequence of the conversion process from surface nitrites to nitrates, accompanied by nitrites decomposition and NO release. The well-dispersed barium phase on ceria is crucial in stabilizing the adsorbed nitrite species and providing more basic sites for NOx trapping.Acknowledgements
The authors are grateful to the financial support from the National High Technology Research and Development Program of China (863 Program, 2011AA03A405), the Program of Natural Science Foundation of China (No. 50972104).Notes and references
- N. Takahashi, H. Shinjoh, T. Iijima, T. Suzuki, K. Yamazaki, K. Yokota, H. Suzuki, N. Miyoshi, S.-i. Matsumoto, T. Tanizawa, T. Tanaka, S.-s. Tateishi and K. Kasahara, Catal. Today, 1996, 27, 63 CrossRef CAS.
- M. V. Twigg, Catal. Today, 2011, 163, 33 CrossRef CAS.
- M. Haneda, T. Morita, Y. Nagao, Y. Kintaichi and H. Hamada, Phys. Chem. Chem. Phys., 2001, 3, 4696 RSC.
- A. Martínez-Arias, J. Soria, J. C. Conesa, X. L. Seoane, A. Arcoya and R. Cataluña, J. Chem. Soc., Faraday Trans., 1995, 91, 1679 RSC.
- S. H. Overbury, D. R. Mullins, D. R. Huntley and L. Kundakovic, J. Catal., 1999, 186, 296 CrossRef CAS.
- J. A. Rodriguez, T. Jirsak, S. Sambasivan, D. Fischer and A. Maiti, J. Chem. Phys., 2000, 112, 9929 CrossRef CAS.
- Y. Ji, C. Fisk, V. Easterling, U. Graham, A. Poole, M. Crocker, J.-S. Choi, W. Partridge and K. Wilson, Catal. Today, 2010, 151, 362 CrossRef CAS.
- M. Crocker, Y. Y. Ji, T. J. Toops, U. M. Graham and G. Jacobs, Catal. Lett., 2006, 110, 29 CrossRef.
- S. Philipp, A. Drochner, J. Kunert, H. Vogel, J. Theis and E. S. Lox, Top. Catal., 2004, 30–31, 235 CrossRef.
- A. Drochner, M. O. Symalla, H. Vogel, S. Philipp, U. Gobel and W. Muller, Top. Catal., 2007, 42–43, 199 Search PubMed.
- E. Rohart, V. Belliere-Baca, K. Yokota, V. Harle and C. Pitois, Top. Catal., 2007, 42–43, 71 CrossRef.
- M. Crocker, Y. Y. Ji and T. J. Toops, Catal. Lett., 2007, 119, 257 CrossRef.
- J. Szanyi, J. H. Kwak, D. H. Kim, X. Wang, R. Chimentao, J. Hanson, W. S. Epling and C. H. F. Peden, J. Phys. Chem. C, 2007, 111, 4678 CAS.
- G. Centi, S. Perathoner, D. Biglino and E. Giamello, J. Catal., 1995, 152, 75 CrossRef CAS.
- B. A. Morrow, R. A. McFarlane and L. E. Moran, J. Phys. Chem., 1985, 89, 77 CrossRef CAS.
- E. Ito, Y. J. Mergler, B. E. Nieuwenhuys, H. van Bekkum and C. M. van den Bleek, Microporous Mater., 1995, 4, 455 CrossRef CAS.
- A. Urakawa, N. Maeda and A. Baiker, Top. Catal., 2009, 52, 1746 CrossRef.
- A. Urakawa, N. Maeda and A. Baiker, Angew. Chem., Int. Ed., 2008, 47, 9256 CrossRef CAS.
- A. Urakawa, E. Roedel, S. Kureti and A. Baiker, Phys. Chem. Chem. Phys., 2008, 10, 6190 RSC.
- B. Azambre, L. Zenboury, F. Delacroix and J. V. Weber, Catal. Today, 2008, 137, 278 CrossRef CAS.
- K. I. Hadjiivanov, Catal. Rev.: Sci. Eng., 2000, 42, 71 CAS.
- B. Azambre, L. Zenboury, A. Koch and J. V. Weber, J. Phys. Chem. C, 2009, 113, 13287 CAS.
- M. Crocker, Y. Y. Ji, T. J. Toops and J. A. Pihl, Appl. Catal., B, 2009, 91, 329 CrossRef.
- A. B. Lopez, I. Atribak, B. Azambre and A. Garcia-Garcia, Appl. Catal., B, 2009, 92, 126 CrossRef.
- A. Garcia-Garcia, I. Atribak, B. Azambre and A. Bueno-Lopez, Top. Catal., 2009, 52, 2092 CrossRef.
- B. Levasseur, A. M. Ebrahim and T. J. Bandosz, Langmuir, 2011, 27, 9379 CrossRef CAS.
- J. Libuda, A. Desikusumastuti, T. Staudt and H. Gronbeck, J. Catal., 2008, 255, 127 CrossRef.
- J. Szanyi, C. W. Yi and J. H. Kwak, J. Phys. Chem. C, 2007, 111, 15299 Search PubMed.
- P. T. Fanson, M. R. Horton, W. N. Delgass and J. Lauterbach, Appl. Catal., B, 2003, 46, 393 CrossRef CAS.
- I. Nova, L. Castoldi, F. Prinetto, V. Dal Santo, L. Lietti, E. Tronconi, P. Forzatti, G. Ghiotti, R. Psaro and S. Recchia, Top. Catal., 2004, 30–31, 181 CrossRef.
- X. Q. Wang, M. Q. Shen, L. Y. Song, Y. G. Su and J. Wang, Phys. Chem. Chem. Phys., 2011, 13, 15589 RSC.
- M. Piacentini, M. Maciejewski, T. Burgi and A. Baiker, Top. Catal., 2004, 30–31, 71 CrossRef.
- M. Piacentini, M. Maciejewski and A. Baiker, Appl. Catal., B, 2005, 59, 187 CrossRef CAS.
- C. Lei, M. Shen, M. Yang, J. Wang and J. Wang, Appl. Catal., B, 2011, 101, 355 CrossRef CAS.
- M. Piacentini, M. Maciejewski and A. Baiker, Appl. Catal., B, 2006, 66, 126 CrossRef CAS.
- B. Azambre, I. Atribak, A. Bueno-Lopez and A. Garcia-Garcia, J. Phys. Chem. C, 2010, 114, 13300 CAS.
- M. Nolan, S. C. Parker and G. W. Watson, J. Phys. Chem. B, 2006, 110, 2256 CrossRef CAS.
- W. S. Epling, L. E. Campbell, A. Yezerets, N. W. Currier and J. E. Parks II, Catal. Rev.: Sci. Eng., 2004, 46, 163 Search PubMed.
- U. Tuttlies, V. Schmeisser and G. Eigenberger, Chem. Eng. Sci., 2004, 59, 4731 CrossRef CAS.
- R. L. Muncrief, P. Khanna, K. S. Kabin and M. P. Harold, Catal. Today, 2004, 98, 393 CrossRef CAS.
- N. Maeda, A. Urakawa and A. Baiker, J. Phys. Chem. C, 2009, 113, 16724 CAS.
| This journal is © The Royal Society of Chemistry 2013 |
