Combustion resistance of the 129Xe hyperpolarized nuclear spin state
Karl F.
Stupic†
a,
Joseph S.
Six
a,
Michael D.
Olsen
b,
Galina E.
Pavlovskaya
a and
Thomas
Meersmann
*a
aUniversity of Nottingham, School of Clinical Sciences, Sir Peter Mansfield Magnetic Resonance Centre, Nottingham, NG7 2RD, UK. E-mail: Thomas.Meersmann@Nottingham.ac.uk; Meer@MagneticResonance.us
bDepartment of Chemistry, Colorado State University, Fort Collins, Colorado 80523, USA
First published on 6th November 2012
Abstract
Using a methane–xenon mixture for spin exchange optical pumping, MRI of combustion was enabled. The 129Xe hyperpolarized nuclear spin state was found to sufficiently survive the complete passage through the harsh environment of the reaction zone. A velocity profile (Vz(z)) of a flame was recorded to demonstrate the feasibility of MRI velocimetry of transport processes in combustors.
To date, in situ magnetic resonance imaging (MRI) of a combustion process reported in literature is limited to work by Glover et al.1 although ongoing research was recently presented by Pines and co-workers with focus on demanding hp 129Xe flow field measurements.2 The difficulties of in situ MRI of combustion are caused to some extent by the thermal effects on MR hardware, however sufficient cooling can usually be applied to study high temperature processes safely.1,3–5 More fundamental challenges lie in the very short relaxation times associated with the combustion process due to radical reaction mechanisms, the low spin density in the combustion zone, and the unfavorable Boltzman equilibrium spin population at the high temperatures of approximately 1700 K for premixed methane–air combustion.6 These problems were demonstrated by Glover et al.1 whose 1H MR images show the methane entering the combustion zone but not in the combustion region itself despite the employment of SPRITE,7 an MRI technique that allows for the study of media with short T1 or
 times and enables MR study of fast and turbulent flowing systems. Alternatively, it is possible to use condensation products of combustion for 1H MRI as reported by Axelson and Wooten8 and Dufour et al.9 recently demonstrated in situ NMR spectroscopy of pyrolysis products. Although the fuel entering the reaction zone and the combustion exhaust can be observed through the 1H MRI, the combustion zone itself remains elusive.
The fast relaxation within the combustion processes is also expected to render hyperpolarized molecules useless for these studies, unless a system is chosen that does not radicalize in the combustion process. Using SEOP to generate hp 129Xe,10 Anala et al. demonstrated that the hyperpolarized mixture can be added to fuel for usage as a ‘spy’ in 2D EXCSY NMR spectroscopy of methane combustion.5 However, it remained to be shown whether the hyperpolarized state is sustainable throughout the entire combustion process. Since combustion in a stable flame takes place under steady state conditions where ‘location in space’ is closely associated with ‘point in time’ of the reaction, hp 129Xe MRI may provide the answer.
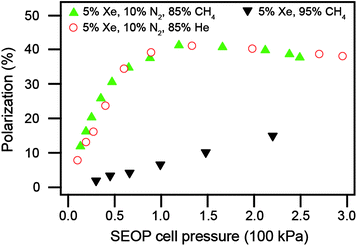
It is crucial for the MRI experiments that an uninterrupted, constant flow of the hp 129Xe–CH4 mixture is provided. Continuous flow SEOP is often performed using dilute xenon mixtures in nitrogen and helium. The hp 129Xe can be extracted from these mixtures using cryogenic separation.11 However, the separation process interrupts the supply of gas effectively resulting in a ‘batch mode’ production of hp 129Xe. Alternatively, the extraction process can be omitted and the hp mixture can be continuously fed into the fuel. However, as a consequence, the methane will be strongly diluted to ensure sufficient hp 129Xe density for MR detection. The dilution of the methane with the hp gas mixture can be reduced through SEOP with high xenon density mixtures.12 High xenon density SEOP was used in the previous combustion work, however the associated lower spin polarization necessitated a high xenon concentration in the fuel with a concentration of only 39% methane.5 Instead of adding hp 129Xe to a fuel after SEOP, this work explored direct SEOP of a fuel–xenon mixture leading to the results in Fig. 1.
 | ||
| Fig. 1 129Xe polarization as a function of SEOP cell pressure for three different gas mixtures (detailed in the legend) in stopped flow SEOP. | ||
The very reactive vapor phase rubidium in the SEOP process will not readily react with saturated hydrocarbons such as methane.13Fig. 1 demonstrates the feasibility of stopped flow SEOP14 with a 5% Xe–95% CH4 mixture, but the generated spin polarization P stays below 15% and falls short compared to P > 40% obtained in stopped flow SEOP with a Xe–N2–He mixture. The low polarization and the SEOP pressure dependence of the polarization14 can be explained by methane's insufficient capability to quench radiation trapping,13,15 a spin depolarizing process during SEOP.16 Unlike CH4, molecular nitrogen can effectively quench the fluorescence through energy transfer into its vibrational mode.16 Therefore, the situation can be improved by a ternary SEOP gas mixture of Xe, CH4, and N2. The results with 5% Xe–10% N2–85% CH4 shown in Fig. 1 are nearly identical to the counterpart mixture with He, suggesting that CH4 can replace He as an SEOP buffer gas, if required. Details of batch mode SEOP used in polarization measurements are described elsewhere.14
For the continuous flow production in this work, an SEOP pressure slightly above ambient was chosen to allow for the least demanding experimental conditions. As shown in Fig. 1, SEOP of 5% Xe–10% N2–85% CH4 at 100 kPa (i.e. ambient pressure) results to high polarization. Therefore, this mixture was used for all MRI experiments in this work. SEOP at higher pressure would allow for the N2 concentration to be reduced further. Note that only xenon gas with natural abundance of 26% 129Xe was used in this work.
Due to shorter SEOP times, the polarization generated under continuous flow conditions is typically reduced compared to that obtained in stopped flow SEOP shown in Fig. 1. The reduction was amplified because the flow rates used in the experiments were determined for combustion and were not optimized for polarization. The polarization produced through the setup sketched in Fig. 2 was reduced to a spin polarization of P = 7% for a flow rate of 40 mL min−1 and P = 6% for a flow rate of 15 mL min−1.
 | ||
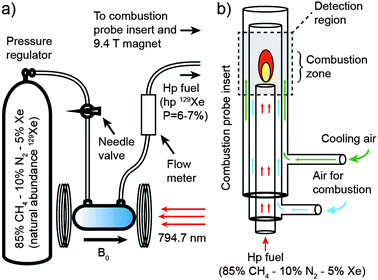
| Fig. 2 (a) Experimental setup for continuous flow SEOP. (b) Sketch of the combustion probe insert made of Pyrex and quartz. | ||
The continuous flow setup, shown in Fig. 2a, supplied a non-interrupted source of methane for combustion that contained hp 129Xe for MRI detection. The flow rate of the fuel mixture was regulated by a needle valve before the SEOP cell. During passage through the SEOP cell, hyperpolarization of 129Xe is obtained via spin-exchange with laser pumped Rb vapor. The hp 129Xe gas mixture then continuously exits the SEOP cell and the flow rate is measured before the mixture goes into the combustion probe placed in a 9.4 T superconducting magnet. The location of the flow meter at the exit of the SEOP cell was chosen in the interest of keeping cell contamination at a minimum. Losses in spin polarization due to the flow meter were deemed acceptable and are included in the polarization values reported in this work.
The combustion probe insert outlined in Fig. 2b (15 mm outer diameter) was placed into a custom built birdcage resonator probe tuned to 110.69 MHz corresponding to the NMR frequency of 129Xe at 9.4 T. The combustion probe insert was made of Pyrex except for the heat resistant quartz end piece of the hp fuel delivery line. Air as an oxidation agent was delivered through a secondary tube surrounding the hp fuel line. Cooling air, supplied by a third tube that enclosed both inner tubes, reduced the maximum wall temperatures of the insert to 313 K. Additional temperature insulation was provided by the spacing between the 15 mm outer diameter of the insert and the 25 mm inner diameter of the custom made micro-imaging probe. After passing the MR detection region, the hot combustion products were mixed with the cooling air and were exhausted through the vertical room temperature bore of the 9.4 T superconducting magnet without any obstruction.
Images were acquired with 90 degree pulses using a 32 increment standard gradient echo imaging sequence with a Bruker Avance III, MICRO 2.5 spectrometer. For each phase increment 128 scans were collected resulting in a total image acquisition time of less than 20 minutes.
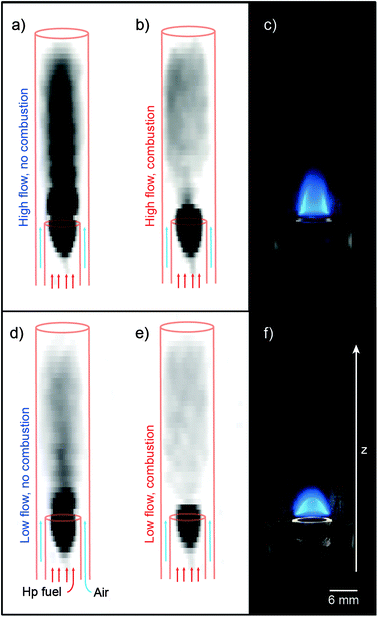
Two different flame profiles were imaged: (1) a ‘large’ flame with an hp mixture flow rate of 40 mL min−1 and an air flow rate of 600 mL min−1; and (2) a ‘small’ flame with an hp gas mixture flow rate of 15 mL min−1 and an air flow rate 400 mL min−1. The resulting in situ hp 129Xe MR images of the hyperpolarized fuel mixtures after ignition are shown in Fig. 3b and e (i.e. high and low flow respectively); for comparison, Fig. 3a and d (i.e. high and low flow respectively) show in situ hp 129Xe MRI of the same flow rates but without ignition. Fig. 3c and f show photographs of the respective flames. The hp 129Xe is seen strongly in the central channel where its density is the greatest before entering the combustion zone where the signal then diminishes as the hp gas mixes with a high flow of air.
 | ||
| Fig. 3 Hp 129Xe MRI of combustion using natural abundance xenon in methane. The upper panels ((a), (b), and (c)) display images using gas flow rates for a large flame (hp fuel at 40 mL min−1, air at 600 mL min−1). (a) MRI of hp 129Xe mixture without ignition, (b) MRI of hp 129Xe with ignition, and (c) photograph of combustion in the probe insert. The lower panels ((d), (e), and (f)) display images using flow rates for a small flame (hp fuel at 15 mL min−1, air at 400 mL min−1). (d) MRI of hp 129Xe mixture without ignition, (e) MRI of hp 129Xe with ignition, and (f) photograph of the combustion. The approximate position of the combustion probe insert is indicated in the MR images. | ||
Although there is a decrease in the observed 129Xe signal with ignition, it is apparent that the hyperpolarized state survived the harsh and reactive conditions of combustion. Furthermore, the reduction of the signal is partially caused by a decrease in gas density at the high combustion temperatures (i.e. >1000 K, as opposed to 290 K without ignition).
Even with the reduction in density, substantial signal is observed in the flame and exhaust regions. To further verify the combustion resistance of the hyperpolarized nuclear spin state, the exhaust of the hp fuel was collected after combustion through a glass syringe (i.e. with the combustor insert removed from the magnet for this purpose), injected into a sample container, and a 1D NMR spectrum was taken that revealed the ‘survival’ of considerable hp 129Xe polarization.
To confirm complete combustion, the exhaust from the combustion of the CH4–N2–Xe mixture was collected and analyzed through flame ionization detector gas chromatography. No detectable amount of methane was found. From the detection limit of the instrument and the observed CO2 concentration, one can conclude that >99.9% of the methane had indeed reacted in the combustion process.
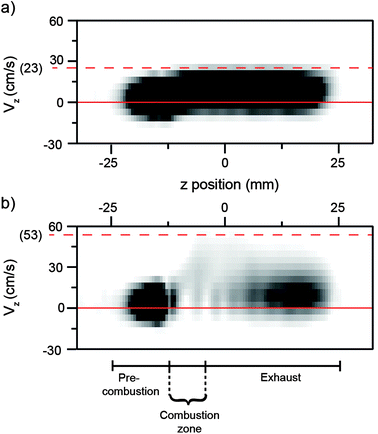
The combustion resistance of the hyperpolarized state of the 129Xe nuclear spins enables spatial-velocity measurements throughout the combustor. As a proof of principle, this work investigated velocities using the flow rates of the large flame in Fig. 3. The methodology of acquiring spatial-velocity profiles of hp 129Xe was similar to that described in detail by Kaiser et al.17Fig. 4 shows the velocity of 129Xe in the z-axis (Vz, movement parallel to the direction of the bulk flow), as a function of z position The relatively simple Vz(z) profiles (i.e. one spatial and one velocity dimension) demonstrate the drastic changes in velocity between non-ignited flow and combustion (see Fig. 4a and b respectively).
 | ||
| Fig. 4 Hp 129Xe spatial-velocity profile displaying velocity Vz as a function of z position (a) without ignition and (b) with ignition. The pre-combustion, combustion, and exhaust regions are approximated. | ||
To acquire velocity profiles, the spatial phase encoding gradients in the imaging sequence described earlier were replaced by 16 flow encoding gradients with δ = 0.3 ms, and Δ = 1 ms. Unlike previous work17 a stimulated echo was not employed because signal lost from transverse relaxation was acceptable in the short duration of Δ.
Fig. 4a displays Vz(z) without ignition of the hp mixture. A maximum velocity of 18 cm s−1 is observed in the pre-combustion region. After mixing with the air the maximum velocity increases to 23 cm s−1 and then remains constant for the remainder of the detection region. Conversely, with ignition the velocity profile changes dramatically as seen in Fig. 4b. The inlet region is nearly identical to the profile acquired without ignition. However, the maximum velocity near the combustion region is greatly increased to 53 cm s−1. The maximum velocity then reduces with distance from the combustion zone. The greater distribution of velocities contributes to the apparent decrease in signal intensity. The gap of observed signal at −13 cm is possibly an artifact arising from the migration of spins between flow encoding and spatial encoding, thus creating an error in the observed position. The Vz(z) profile took less than 20 min to record and it should be possible to extend the measurement to complete flow field images. The MR images may be improved by utilization of fast imaging techniques such as SPRITE.7
In conclusion, data presented in this communication show in situ MR images of combustion using hp 129Xe. These experiments were possible because of a novel approach to dope the fuel with hp 129Xe. Stopped flow experiments demonstrated that hp of 129Xe was possible with methane present in the SEOP cell and generally high spin polarization can be obtained by the use of a ternary mixture that included molecular nitrogen. The ability to perform continuous flow SEOP with the methane in the mixture simplifies the delivery of the hp 129Xe for prolonged MRI data acquisition.
The combustion resistance of the hp 129Xe nuclear spin state found in this work permits the collection of images that cover not only the pre-combustion region but also the combustion region and the exhaust. This work also demonstrated the feasibility of simple Vz(z) spatial-velocity profiles covering the pre-combustion, combustion, and exhaust regions.
The preservation of the hyperpolarized nuclear spin state through the combustion process may allow for MRI to be used as an effective tool for investigating the fluid dynamics of combustion processes. Since the reaction conditions in low temperature catalyzed reactions are milder than the open combustion used in this work, hp 129Xe MRI should be extendable to study heterogeneously catalyzed combustion.6 Catalyzed combustion is used to avoid the build up of nitrogen oxides in gas powered turbines,18 allows for micro combustors,19 and can be used for example for the generation of synthetic fuels and selective partial combustion reactions.20,21 Hp 129Xe MRI may be used for the study of flow fields within catalytic combustors and provide a better understanding of gas exchange with their porous surfaces.22
Finally, as a cautionary note, the non-invasive nature of MRI for combustion within high magnetic fields remains unproven, in particular when fast moving ions are being generated.
Acknowledgements
This material was based upon work supported by the National Science Foundation under Grant No. CHE-0719423, CBET-0747253, the American Chemical Society Petroleum Research Fund under grant No. ACS PRF 40625-AC, and by the Medical Research Council under Grant No. G0900785.References
- P. M. Glover, B. Newling, C. Poirier and B. J. Balcom, J. Magn. Reson., 2005, 176, 79–86 CrossRef CAS.
- J. P. Mustonen, H. D. Shin, D. Graziani, T. Theis, X. Zhou, V. S. Bajaj and A. Pines, in EUROMAR 2011, Frankfurt, 2011 Search PubMed.
- J. F. Stebbins, E. Schneider, J. B. Murdoch, A. Pines and I. S. E. Carmichael, Rev. Sci. Instrum., 1986, 57, 39–42 CrossRef CAS.
- D. Massiot, D. Trumeau, B. Touzo, I. Farnan, J. C. Rifflet, A. Douy and J. P. Coutures, J. Phys. Chem., 1995, 99, 16455–16459 CrossRef CAS.
- S. Anala, G. E. Pavlovskaya, P. Pichumani, T. J. Dieken, M. D. Olsen and T. Meersmann, J. Am. Chem. Soc., 2003, 125, 13298–13302 CrossRef CAS.
- R. E. Hayes and S. T. Kolaczkowski, Introduction to Catalytic Combustion, Gordon and Breach Science Publishers, Amsterdam, 1997 Search PubMed.
- B. J. Balcom, R. P. MacGregor, S. D. Beyea, D. P. Green, R. L. Armstrong and T. W. Bremner, J. Mag. Reson., Ser. A, 1996, 123, 131–134 CrossRef CAS.
- D. E. Axelson and J. B. Wooten, J. Anal. Appl. Pyrolysis, 2007, 78, 214–227 CrossRef CAS.
- A. Dufour, M. Castro-Diaz, N. Brosse, M. Bouroukba and C. Snape, Chemsuschem, 2012, 5, 1258–1265 CrossRef CAS.
- D. Raftery, H. Long, T. Meersmann, P. J. Grandinetti, L. Reven and A. Pines, Phys. Rev. Lett., 1991, 66, 584–587 CrossRef CAS.
- I. C. Ruset, S. Ketel and F. W. Hersman, Phys. Rev. Lett., 2006, 96, 053002 CrossRef CAS.
- M. G. Mortuza, S. Anala, G. E. Pavlovskaya, T. J. Dieken and T. Meersmann, J. Chem. Phys., 2003, 118, 1581–1584 CrossRef CAS.
- E. S. Hrycyshyn and L. Krause, Can. J. Phys., 1970, 48, 2761–2768 CrossRef CAS.
- J. S. Six, T. Hughes-Riley, K. F. Stupic, G. E. Pavlovskaya and T. Meersmann, PLoS One, 2012 DOI:10.1371/journal.pone.0049927.
- N. D. Zameroski, W. Rudolph, G. D. Hager and D. A. Hostutler, J. Phys. B:At., Mol. Opt. Phys., 2009, 42, 245401 CrossRef.
- W. Happer, Rev. Mod. Phys., 1972, 44, 169–249 CrossRef CAS.
- L. G. Kaiser, J. W. Logan, T. Meersmann and A. Pines, J. Magn. Reson., 2001, 149, 144–148 CrossRef CAS.
- J. G. McCarty, Nature, 2000, 403, 35–36 CrossRef CAS.
- C. M. Spadaccini, X. Zhang, C. P. Cadou, N. Miki and I. A. Waitz, Sens. Actuators, A, 2003, 103, 219–224 CrossRef.
- J. Reimer, Nature, 2003, 426, 508–509 CrossRef CAS.
- S. M. Lang, T. M. Bernhardt, R. N. Barnett and U. Landman, J. Phys. Chem. C, 2011, 115, 6788–6795 CAS.
- R. E. Hayes, S. T. Kolaczkowski, P. K. C. Li and S. Awdry, Chem. Eng. Sci., 2001, 56, 4815–4835 CrossRef CAS.
Footnote |
| † Present address: Division of Magnetics, National Institute of Standards and Technology, Boulder, Colorado, 80305, USA. |
| This journal is © the Owner Societies 2013 |
