Gamma-radiation induced formation of chromium oxide nanoparticles from dissolved dichromate
Received 7th September 2012, Accepted 18th October 2012
First published on 22nd October 2012
Abstract
The formation of chromium oxide nanoparticles by gamma radiolysis of CrVI (CrO42− or Cr2O72−) solutions was investigated as a function of pH and initial CrVI concentration by measuring [CrVI], the particle concentration ([CrIII(col)]) and [H2], and by characterizing the particles using TEM, Raman, FTIR and XPS. The results show that CrVI is easily reduced to CrIII by a homogeneous aqueous reaction with ˙eaq−, but, due to the stability of CrIII colloids, the growth of the Cr(OH)3 particles is very slow. As the particles grow the interior of the particle dehydrates to form Cr2O3 while the outer layer remains hydrated. When most of the CrVI that is initially present in the solution is converted to Cr(OH)3 further redox reactions of chromium species occur on the particle surfaces. The redox system reaches a pseudo-equilibrium state due to cyclic reactions of CrIII with ˙OH and H2O2, and reactions of CrVI with ˙eaq− and H2O2. The size distribution of the particles that are formed is controlled by these solution–solid interface reactions.
1. Introduction
Nano-scale chromium oxide particles have numerous applications. Depending on their crystalline size and morphology, they are used as green pigments,1 heterogeneous catalysts,2 coating materials for thermal protection,3 coatings for wear resistance,4 and as electrochromic materials.5 The high melting point (2435 °C) and the oxidation resistance of this oxide also makes it an important refractory material, although its sintering ability is poor. In addition to improving pigment opacity and catalytic activity, reducing the chromium oxide particle size could improve its sintering ability by decreasing the required sintering temperature and by increasing the density of the sintered powder.6,7Chromium oxide nanoparticles have been synthesized by various techniques such as hydrothermal reduction,8 solution combustion synthesis,9 sonochemical reaction,10 laser-induced pyrolysis,11 hydrazine reduction and thermal treatments,12 supercritical alcohol synthesis,13 condensation–polymerization,14 precipitation–gelation,15 gas condensation,16 microwave plasma chemistry,17 and sol–gel methods.18 The major drawbacks of most of these methods are a large particle size distribution, low yield, and agglomeration of the particles. The methods also tend to be complex and require chemically harsh conditions and/or high processing temperatures. Radiolysis is a promising new technique for generating nano-scale particles with a narrow size distribution.19,20 Radiation-induced nanoparticle formation also does not require the chemical additives and stabilizers for particle size control that are used in other conventional methods.21 This eliminates undesired effects of these chemicals on the nanoparticle structure and chemical composition.
The conversion of CrVI to CrIII using ionizing radiation could also be used as an environmental protection process. Chromium, as CrVI, is toxic and considered to be carcinogenic, while chromium, as CrIII, is an essential micronutrient for humans.22 CrVI is used in a wide range of industrial processes such as electroplating, tanning, and steel manufacturing.23 Any CrVI-contaminated waste water has to be treated to reduce CrVI to less harmful CrIII before it can be safely discharged into the environment. Common techniques used for this reduction include electrolysis,24 photochemical reduction,25 chemical reduction26 and biological reduction.27 These methods require the use of reagents, can have a low efficiency, and can be dependent on the water chemistry (particularly pH). Radiation-induced reduction of CrVI to CrIII is a technique for the treatment of CrVI-contaminated waste water that does not have these disadvantages.28
When exposed to ionizing radiation, water decomposes to form a range of chemically reactive radical and molecular products:29,30
| |  | (1) |
These products react with one another to form secondary species such as O
2, ˙O
2− and ˙O
3. The water radiolysis products range from highly oxidizing (
e.g., ˙OH, H
2O
2 and O
2) to highly reducing (
e.g., ˙H, ˙e
aq− and ˙O
2−) and can readily change the oxidation state of dissolved metal ions. The solubility of a transition metal ion can vary by several orders of magnitude depending on its oxidation state and the solution pH. Thus, reactions that can alter the oxidation state of a dissolved ion can lead to the condensation of insoluble species and the formation of solid particles.
Nanoparticle synthesis by ionizing radiation has been reported by various groups,31–33 but mechanistic studies of the nanoparticle formation process are very limited.20 The short-term pulse irradiation technique provides very useful information on the initial homogeneous aqueous reactions that occur, but does not provide information on particle growth and heterogeneous surface reactions that occur at longer times (orders of magnitude beyond the duration of the irradiation pulse).
Our recent studies have shown that uniform-sized colloidal particles of γ-FeOOH can be formed by the radiolytic oxidation of dissolved FeII using continuous gamma irradiation. We have also demonstrated the formation of nano-scale Co3O4 particles from the radiolysis of hydrated CoII.20,34 In these processes the oxidizing power of water radiolysis products is utilized for particle formation. In this study we report on the formation of Cr2O3 nanoparticles using water radiolysis to drive reduction of dissolved chromate ions. In addition to demonstrating nanoparticle synthesis, we provide a mechanistic understanding of particle formation and growth kinetics. The particles that are formed are well characterized and the effects of the initial concentration of CrVI ions and pH on the particle growth were investigated.
2. Experimental
Solutions were prepared by dissolving an appropriate amount of high-purity potassium dichromate salt purchased from Sigma-Aldrich (purity ≥ 99%). The salt is highly soluble and the anion is present as either CrO42− or Cr2O72−depending on the pH.35,36 The solutions are referred to as CrVI solutions hereafter. The concentration of CrVI ranged from 0.1 to 10 mM. Concentrated NaOH solution was added to a CrVI solution to obtain the three pHs (6.0, 8.5 and 10.6) explored in this study. All solutions were freshly prepared with water purified using a NANOpure Diamond UV Ultrapure water system, with a resistivity of 18.2 MΩ cm. All deaerated solutions were prepared inside an Ar-filled glove box (where the oxygen level was maintained below 0.1 vol%) using pure water that was purged with ultra-high purity argon (impurity content less than 0.001%) for an hour. The solutions were then transferred into 20 mL glass vials leaving no headspace and sealed using aluminum crimp caps with PTFE silicon septa (Agilent Technologies). The sample vials were irradiated in a 60Co gamma cell (MDS Nordion) as described in detail in a previous publication.37 The gamma source provided a uniform absorption dose rate of 6.7 kGy h−1 in the water samples at the time of this study as determined using Fricke dosimetry.30 Since CrVI is a hazardous ion, handling precautions were taken in preparing test solutions to prevent exposure to the skin or inhalation.Following irradiation for a desired period, a series of chemical analyses of the test solution were performed. Colloid particles were then collected for analysis (see below for details). For analysis of dissolved H2, one half (10 mL) of the irradiated test solution was transferred to a new 20 mL vacuum-tight vial using a gas-tight syringe (Hamilton). Equilibration of the gas concentrations in the headspace above the solution and in the aqueous phase was quickly established. A gas sample was extracted from the headspace using a gas-tight syringe with a Luer lock (Agilent Technologies) and was analyzed using a gas chromatograph with a thermal conductivity detector (GC-TCD, 6580 Agilent Technologies) as described elsewhere in detail.37 The aqueous phase H2 concentrations were calculated from the measured gas phase concentrations using the known aqueous-gas partition coefficients (0.019 for H2 at 25 °C ([Caq]/[Cg], both concentrations in mol dm−3)). Using this method, the detection limit for the aqueous [H2] was 1.0 × 10⁻⁵ mol dm−3 and the uncertainties in the measurement arising from sampling and instrumental errors were estimated to be ±50% at the low end of the measured concentration range and ±0.005% at the high end of the concentration range. The concentration of hydrogen peroxide in the test solution was determined by the Ghormley tri-iodide method, as previously reported.38,39
The solutions were analysed for their CrVI content using a UV-VIS Spectrophotometer (BioLogic Science Instruments). The concentration of CrVI was determined by adding diphenylcarbazide (DPC) to a solution sample. This reacts with CrVI to form a coloured complex that absorbs light at 540 nm.40 A calibration curve for CrVI over the concentration range of 0.01 to 1 mM was generated. The molar extinction coefficient of 39![[thin space (1/6-em)]](https://www.rsc.org/images/entities/char_2009.gif) 032 M−1 cm−1 obtained from our calibration curve is comparable to the reported value of 34400 M−1 cm−1,40 and our calibration value was used to determine the concentration of chromium in our samples. This colorimetric method is referred to as the DPC method hereafter. Gamma-irradiation reduces CrVI to CrIII which then forms colloidal particles that are comprised of Cr(OH)3, CrOOH, and Cr2O3. The particles are collectively referred to as CrIII(col). The concentration of CrIII(col) dispersed in the solution samples was determined by first oxidizing the CrIII(col) with potassium permanganate to form dissolved CrVI and then by measuring the CrVI concentration in the samples using the DPC method. The CrIII(col) concentration was calculated by subtracting the initially-determined dissolved CrVI concentration from the total CrVI concentration determined after CrIII(col) oxidation.
032 M−1 cm−1 obtained from our calibration curve is comparable to the reported value of 34400 M−1 cm−1,40 and our calibration value was used to determine the concentration of chromium in our samples. This colorimetric method is referred to as the DPC method hereafter. Gamma-irradiation reduces CrVI to CrIII which then forms colloidal particles that are comprised of Cr(OH)3, CrOOH, and Cr2O3. The particles are collectively referred to as CrIII(col). The concentration of CrIII(col) dispersed in the solution samples was determined by first oxidizing the CrIII(col) with potassium permanganate to form dissolved CrVI and then by measuring the CrVI concentration in the samples using the DPC method. The CrIII(col) concentration was calculated by subtracting the initially-determined dissolved CrVI concentration from the total CrVI concentration determined after CrIII(col) oxidation.
Particles were collected from the sample vials for analysis by transmission electron microscopy (TEM), X-ray photoelectron spectroscopy (XPS), Fourier transform infrared spectroscopy (FTIR) and Raman spectroscopy. For the XPS, FTIR and Raman analyses the particles were collected by centrifuging the solution and then drying the precipitate on a glass plate in an Ar-purged glove box. Samples for TEM were collected by dipping a carbon-coated copper grid into the irradiated test solution and then drying the sample grid in air. FTIR spectroscopy was performed with a Bruker, Vertex 70v in the 400 to 4000 cm−1 range. The TEM images were obtained with a Philips Electronics Ltd. TEM with the electron microscope operated at 80 keV. XPS spectra were acquired on a KRATOS Axis Nova spectrometer using monochromatic Al Kα radiation and operating at 210 W with a base pressure of 10−8 Pa. The analysis depth of the XPS instrument is 6–7 nm. Raman scattering measurements were performed using a Renishaw model 2000 Raman spectrometer with a laser excitation wavelength of 633 nm.
3. Results and discussion
3.1 Experimental observations
A series of tests was performed with CrVI solutions that were aerated (by purging with air) for 1 h prior to testing. These tests included a range of CrVI concentrations and solution pHs. In all of these tests no changes in the test solutions were observed, with and without extended periods of gamma irradiation, and no particle formation was observed. All the data presented and discussed below are for tests that were performed using de-aerated solutions.Fig. 1 shows the photographs and UV-Vis spectra of 0.1 mM CrVI solutions at pH 8.5 that were irradiated for different time periods (tRAD). These images were taken after transferring the solutions from the irradiated test vials to new, clear vials because the test vials darken during irradiation. The solutions change from yellow, characteristic of dissolved CrO42−/Cr2O72−, to colourless as the irradiation time increases. The colour change is shown more quantitatively by the decrease in the UV-Vis absorption intensity of the solutions at 370 nm (the known absorption peak for CrO42−) with increasing tRAD. The good agreement between the decrease in the UV-Vis absorbance and the change in [CrVI] as determined using the DPC method is shown in Fig. 2.
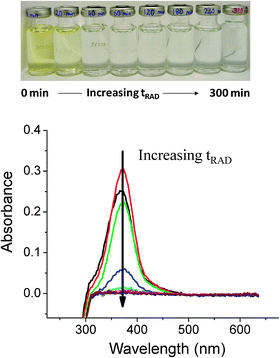 |
| | Fig. 1 Photographs of argon-purged solutions initially containing 0.1 mM CrVI at pH 8.5 that were irradiated for different durations, and UV-Vis spectra showing the decrease in the intensity of the absorbance peak of CrVI over the same time period. | |
![The decrease in the height of the UV-Vis absorption peak at 370 nm and the decrease in [CrVI] as a function of irradiation time for deaerated solutions initially containing 0.1 mM CrVI at pH 8.5.](/image/article/2013/CP/c2cp43150e/c2cp43150e-f2.gif) |
| | Fig. 2 The decrease in the height of the UV-Vis absorption peak at 370 nm and the decrease in [CrVI] as a function of irradiation time for deaerated solutions initially containing 0.1 mM CrVI at pH 8.5. | |
The concentrations of CrVI, CrIII(col) and H2, in the test solutions as a function of tRAD are presented in Fig. 3. The results for three different initial CrVI(aq) concentrations (0.1, 0.3 and 0.5 mM) at three different pHs (6.0, 8.5 and 10.6) are shown. We also attempted to measure the concentration of another molecular radiolysis product, H2O2, but its concentration was below our detection limit (≤3 × 10⁻⁶ M) in all tests. The data show the presence of two stages in the particle formation process. In stage 1, at any given [CrVI]0 and pH, [CrVI] decreases linearly with time while [CrIII(col)] increases until most of the initial CrVI is converted to CrIII(col). The chromium concentrations reach steady state values in stage 2. The time to reach stage 2 increases with an increase in [CrVI]0 but is independent of pH (over the range that we studied). The rates of change of the chromium species concentrations in stage 1 were independent of [CrVI]0 or pH; the concentration vs. time plots all have the same slopes:
| |  | (2) |
The [H
2] also increased with irradiation time in stage 1, but it did not reach a steady state and continued to increase at a faster rate in stage 2.
![The concentrations of CrVI (top), CrIII (middle) and H2 (bottom) measured as a function of irradiation time at pHs 6.0 (black squares), 8.5 (blue triangles) and 10.6 (red circles) for solutions initially containing [CrVI] of 0.1 mM (solid symbols), 0.3 mM (half filled symbols) and 0.5 mM (open symbols).](/image/article/2013/CP/c2cp43150e/c2cp43150e-f3.gif) |
| | Fig. 3 The concentrations of CrVI (top), CrIII (middle) and H2 (bottom) measured as a function of irradiation time at pHs 6.0 (black squares), 8.5 (blue triangles) and 10.6 (red circles) for solutions initially containing [CrVI] of 0.1 mM (solid symbols), 0.3 mM (half filled symbols) and 0.5 mM (open symbols). | |
All of the species that comprise the CrIII(col) (Cr(OH)3, CrOOH and Cr2O3) are insoluble at all of the pHs used here.41 However, the photographs of the test solutions (Fig. 1) show no evidence of any precipitate. There is no evidence that the test solutions were supersaturated (no spontaneous formation of a solid precipitate was observed at any time). The CrIII species must have condensed as particles less than 0.1 μm in size (not visible to the naked eye) and formed a stable dispersed phase in the solution (hence the designation of CrIII(col) as colloid). The presence of colloid particles was confirmed by TEM analysis of particles collected from the irradiated test solutions. The size and morphology of the colloid particles formed at various irradiation times were examined. Fig. 4 shows TEM images of chromium particles formed after 300 min irradiation; three different [CrVI]0 (0.1, 0.5 and 10 mM) are compared. The particles are relatively uniform in size, ranging from 9 to 30 nm and approximately spherical with jagged edges. The average size of the particles is nearly independent of pH but increases with [CrVI]0. The size of the particles also appears to increase with time until reaching a final size (Table 1) and the time needed to reach the final size is longer for a higher [CrVI]0 (Fig. 3). It was difficult to collect particles when [CrVI]0 was less than 0.1 mM (hence the lower limit for the [CrVI]0 used in our study). Also, when the irradiation time was very short the number density of the particles larger than a few nm was small.
![TEM images of chromium oxide nanoparticles formed after 300 min irradiation for (a) 0.1 mM [CrVI]0, (b) 0.5 mM [CrVI]0 and (c) 10 mM [CrVI]0.](/image/article/2013/CP/c2cp43150e/c2cp43150e-f4.gif) |
| | Fig. 4 TEM images of chromium oxide nanoparticles formed after 300 min irradiation for (a) 0.1 mM [CrVI]0, (b) 0.5 mM [CrVI]0 and (c) 10 mM [CrVI]0. | |
Table 1 Size ranges of the chromium oxide nanoparticles determined from TEM images
| [CrVI]0 | Irradiation time (tRAD) |
|---|
| 60 min | 300 min | 60 min | 300 min |
|---|
| pH 8.5 | pH 10.6 |
|---|
| 0.5 mM | 12–24.5 nm | 21–22 nm | 10–20 nm | 15–28 nm |
| 0.1 mM | 9–13 nm | 9–38 nm | 8–20 nm | 9–20 nm |
The chemical and phase compositions of the CrIII(col) particles were analyzed using Raman, FTIR and XPS. Due to the small particle size it was impossible to collect sufficient particles for the spectroscopic characterization when [CrVI]0 was below 0.5 mM. For the spectroscopic analyses, only the particles formed from the solutions initially containing 10 mM CrVI that were irradiated for 300 min were analyzed. The colour of the irradiated solution (Fig. 5a) is visibly green which is characteristic of chromium(III) oxide.42 (Note that the green colour is not visible in Fig. 1 due to low concentration.) The particles collected from the irradiated solution were subjected to three different treatments prior to analysis: (1) as collected (unwashed), (2) washing with distilled water, and (3) washing followed by heating at 500 °C for 5 h in air. The particles collected were washed with distilled water to remove any CrVI adsorbed on the particles. The heating treatment was performed to remove any hydrated species on the particle surface layers. The Raman spectrum of the unwashed particles whose TEM image is shown in Fig. 4 is shown in Fig. 5. The unwashed particles have jagged edges and a very narrow size distribution. The Raman spectrum of these particles shows the presence of CrVI species (as CrO42− or Cr2O72− depending on pH). Note that Fig. 5 contains the reference spectrum of CrVI dissolved in solution and not as adsorbed CrVI.
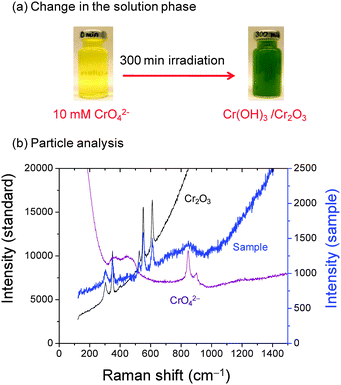 |
| | Fig. 5 (a) Photographs before and after irradiation of an Ar-purged 10 mM CrVI solution at pH 8.5 and (b) Raman spectrum of unwashed chromium oxide nanoparticles formed in the irradiated solution. The reference spectra of CrO42− dissolved in solution and Cr2O3 powder are also shown. | |
The TEM images and the FTIR spectra of washed particles, and washed and heated particles are shown in Fig. 6. The reference spectra of Cr2O3 (purchased from Alfa Aesar) and Cr(OH)3 (synthesized according to Biesinger et al.43) are also shown in the figure. The spectrum of the washed particles matches the reference spectrum of Cr(OH)3 while the spectrum of the washed and heated particles matches the reference spectrum of Cr2O3. Similar results obtained by XPS are shown in Fig. 7. Deconvolution of the XPS band for Cr 2-p (see ref. 35 for deconvolution analysis process) shows that the washed particles contain a higher fraction of Cr(OH)3 (72.9%) than Cr2O3 (18.5%) while the washed and heated particles are almost pure Cr2O3 (98.6%). The heating removes adsorbed water and converts Cr(OH)3 to Cr2O3.
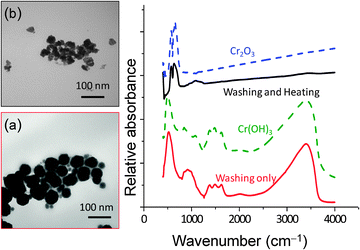 |
| | Fig. 6 The FTIR spectrum and TEM image of chromium oxide nanoparticles after washing (a) prior to and (b) after heating. Also included are spectra for Cr2O3 and Cr(OH)3 for comparison. | |
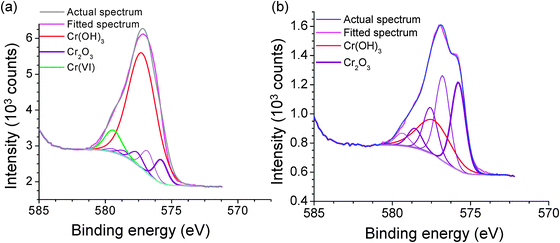 |
| | Fig. 7 XPS spectra of washed chromium oxide nanoparticles showing the fit to the different components of the particles (a) with no heating and (b) with heating. | |
3.2 Kinetic analysis
The results presented in Fig. 3 show that the radiolytic conversion of CrVI(aq) to CrIII(col) follows linear kinetics in stage 1. During the conversion [H2] also increases linearly albeit at a slower rate. The particle analysis results indicate that the particle growth occurs at a much slower rate than the reductive conversion and continues long after most of the CrVI(aq) has been converted to CrIII(col). What reaction mechanism can explain these observations?When exposed to ionizing radiation, water decomposes to form a range of chemically reactive species. The physical and physicochemical processes occurring in water within the μs time scale following the absorption of radiation energy have been studied extensively.29,44 These studies have established that the distribution of the water radiolysis products reaches homogeneity along the radiation track within 10−9 to 10−6 s. The chemical species formed at this time scale are referred to as primary radiolysis products, and the primary radiolysis yields (often referred to as G-values) are expressed as species formed per unit of absorbed energy (μmol J−1). For gamma-radiolysis of water, the primary radiolysis products and corresponding G-values (in parenthesis) are given below:
| |  | (1) |
These primary radiolysis yields are not affected by the presence of a solute at a concentration less than 10
−3 M. Since the primary yields are reached at a very short time scale (<μs) while chemical reactions in solution are slow, we can take the yields multiplied by the radiation dose rate (J (kg H
2O)
−1 s
−1 = Gy s
−1) to be the production rate of these species by the incident radiation. Homogeneous aqueous phase chemical kinetics under continuous gamma irradiation combines these yields with the subsequent reactions of these species with each other, with water molecules, and, if present, with solute species.
The main water radiolysis product that is involved in the reduction of CrVI is the hydrated electron, ˙eaq−. In de-aerated solutions free of chromium species, the main removal reaction for ˙eaq− is30
| | 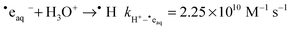 | (3) |
The kinetics of the radiolytic reduction of Cr
VI by ˙e
aq− have been studied using pulse radiolysis techniques:
45| |  | (4) |
The rate constant of this process is comparable to that of the reaction of ˙e
aq− with H
3O
+ and it is higher than the typical rate constant for a diffusion-limited reaction. The very high rate constant is attributed to electron tunnelling.
46 Thus, when [Cr
VI] > [H
3O
+]
reaction (4) becomes the main route for removal of ˙e
aq−.
The reduction of the poly-oxygenated CrO42− or Cr2O72− to Cr(OH)3−nn+ (n = 1,2,3) in water requires a change in the coordination structure of the chromium atom from tetrahedral to octahedral.47 The reduction also requires the loss of an oxygen atom from the Cr coordination structure. In their pulse radiolysis study of CrVI reduction, Buxton and Djouider found that intermediate CrV and CrIV species appear within a few μs after the radiation pulse and the change in the coordination structure of the Cr atom occurred when the chromium was in the CrV state.48 In their study, they could not follow the evolution of the chromium species to final products. Thus, it is difficult to determine whether the overall reduction rate of CrVI to CrIII is as fast as the rate of reaction (4) (effectively the rate for the first step in the CrVI reduction) or if there is a slower rate-determining step later in the reduction.
The multistep process cannot be independently verified in our work. To understand the kinetics of the reduction of CrVI to CrIII the thermodynamic stabilities of the intermediates were examined by computational simulation. Since the exact chemical structures of the intermediates in the reduction process are not known, we attempted to identify the likely candidates by calculating the enthalpies of formation of potential intermediates having different chemical and coordination structures using the VAMP 10.0 model in Materials Studio® 5.5 software. Parametric Method (PM6), a recent NDDO-type method developed by Stewart,49 was employed after optimizing the molecule geometry. The Parametric Method is semi-empirical and contains modified NDDO core–core interaction terms and an optimized set of atomic and diatomic parameters. Complete geometry optimization of the molecules was carried out ab initio using unrestricted Hartree–Fock theory (UHF) and a self-consistent field (SCF) with a tolerance limit of 5 × 10⁻⁷ eV atom−1 and a root mean square (rms) force convergence of 4.81 kJ mol−1 Å−1. The optimization was repeated until a minimum energy was reached. A detailed description of the computational modelling approach can be found elsewhere.50 The most stable chemical structures for the intermediate CrV and CrIV ions based on their calculated enthalpies of formation are shown in Fig. 8. The calculated enthalpies of formation are comparable with the experimentally obtained values (shown in parenthesis): ΔHf for CrO42− = −879.95 (−705) kJ mol−1 and ΔHf for Cr(OH)3 = −1163.73 (−1064) kJ mol−1. The calculated enthalpies of formation were used to determine the relative thermodynamic stability of the intermediate Cr products (Fig. 8).
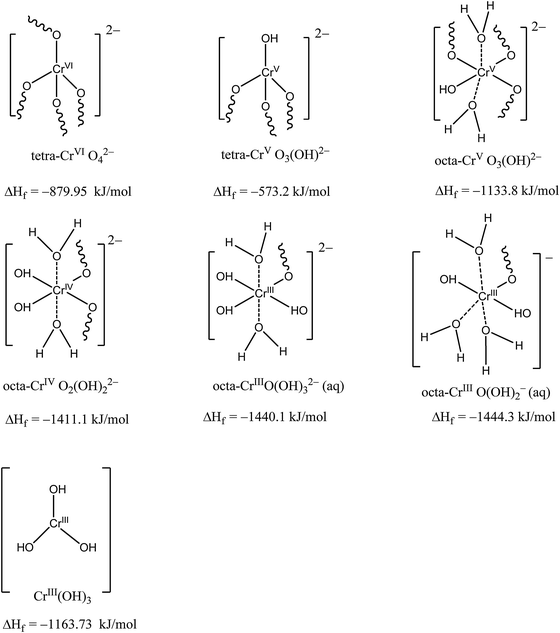 |
| | Fig. 8 Chemical structures and the calculated heats of formation (ΔHf) of intermediate Cr products. The solid and broken lines represent Cr coordination with O atoms and water molecules, and the squiggles represent hydrogen bonding with water molecules. The prefixes tetra- and octa- indicate the tetrahedral or octahedral coordination of the chromium species. | |
The calculated enthalpies of formation for the chromium species and the known enthalpies of formation of the radiolysis products51,52 were then used to calculate the enthalpies of the sequential reduction reactions of chromium species with ˙eaq−:
| | | tetra-CrVIO42− + ˙eaq− + H2O → octa-CrVO3(OH)2− + OH− ΔHr = −56 kJ mol−1 | (5) |
| | | octa-CrVO3(OH)2− + ˙eaq− + H2O → octa-CrIVO2(OH)22− + OH− ΔHr = −79.4 kJ mol−1 | (6) |
| | | octa-CrIVO2(OH)22− + ˙eaq− + H2O → CrIIIO(OH)2− + 2 OH− ΔHr = −65.2 kJ mol−1 | (7) |
where the prefixes, tetra- and octa-, identify the tetrahedral and octahedral coordination structure of the chromium species. The Cr
IIIO(OH)
2− is in acid–base equilibrium with Cr(OH)
3:
| | | CrIIIO(OH)2− + H2O ⇆ CrIII(OH)3 + OH− | (8) |
so the net reaction is
| | | CrVIO42− + 3 ˙eaq− + 4 H2O → CrIII(OH)3 + 5 OH− ΔHr = −214.08 kJ mol−1 | (9) |
(Note that coordinated water molecules are not included in the chemical formulae for brevity, but they are shown in the coordination structure presentations in
Fig. 8.) Although the activation energies of these reactions are not known, a radical/molecule reaction normally has a relatively small activation energy provided there is no steric hindrance involved.
53 Since all of the reduction reactions are exothermic and the activation energies are assumed to be low, we can assume that all the reactions are fast and the overall reduction of Cr
VI to Cr
III should occur at a fast rate, possibly close to the rate observed in the pulse radiolysis study discussed above.
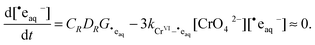
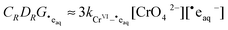
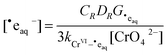
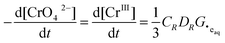
The rate of the radiolytic reduction can then be expressed as:
| |  | (10) |
where

is the rate constant for
reaction (4). The data in the top graph of
Fig. 3 show that the rate of loss of Cr
VI follows a straight line with a slope that is independent of pH and [CrO
42−]
0. This slope is also the same in value, but with the opposite sign, as the slope of the rate of increase in [Cr
III(col)]. This result can also be explained by radiolysis kinetics. Under continuous radiolysis conditions, the concentration of a radical radiolysis product is determined by the primary radiolysis production rate and the removal rates of the products:
29,37| |  | (11) |
where
CR is a unit conversion factor,
DR is the radiation energy absorption rate (1.87 Gy s
−1 in this study where Gy = J kg
−1),
G˙eaq is the primary production yield for ˙e
aq− (0.26 μmol J
−1) and
ki−˙eaq is the second order rate constant for the reaction of ˙e
aq− with species
i. At the studied pHs (>6.0) and for [CrO
42−]
0 (>0.1 mM),
reaction (4) is the main removal path for ˙e
aq−. This allows us to simplify
eqn (11) using the approximation
| |  | (12) |
The rate constant

in
eqn (12) is the same rate constant used in
eqn (10). The factor of three is necessary because the reduction of Cr
VIO
42− to Cr
III requires reaction with three hydrated electrons (˙e
aq−).
The rapid removal of ˙eaq−ensures that [˙eaq−] will be at steady state during continuous irradiation:
| |  | (13) |
so that
| |  | (14) |
and
| |  | (15) |
Substitution of
eqn (14) into
eqn (10) yields:
| |  | (16) |
This analysis also shows that the rate of radiolytic reduction of CrO
42− to Cr
III is constant with time, and independent of pH and [CrO
42−]
0, consistent with the data shown in
Fig. 3.
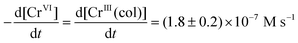
Eqn (16) also predicts that the slope of the plot of [CrO42−] versus time will be 1/3 of the primary production rate of ˙eaq−. The absolute values of the slopes of the lines for the plots of [CrO42−] vs. t and [CrIII] vs. t in Fig. 3 are (1.8 ± 0.2) × 10−7 M s−1. At the dose rate used in this study, the production rate CRDRG˙eaq is 5.2 × 10⁻⁷ M s−1. This value is close to three times the slopes obtained from the data in Fig. 3, consistent with the prediction of eqn (10).
In all tests with an aerated solution no conversion of CrVI to CrIII was observed. This is because the O2 that is present in the solution provides a preferential partner for removal of ˙eaq− through the reaction:37
| | 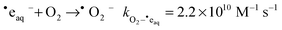 | (17) |
The dissolved oxygen concentration in a fully aerated solution is ∼2 × 10
−4 M and can effectively compete with CrO
42− for ˙e
aq−.
Any chromium reduction products (CrV, CrIV or CrIII) can also react with ˙OH to reform CrVI; the rate constant for the oxidation reaction of CrIII(aq) with ˙OH has been reported to be in the range of 3.1 to 3.8 × 10⁸ M−1 s−1:54,55
| | | CrIII(col) + ˙OH → product kcrIII−˙OH = 3.8 × 10⁸ M−1 s−1 | (18) |
The steady-state concentration of ˙OH would be only slightly higher than that of ˙e
aq−37 (see further analysis below). Thus, this reaction is slow compared to the reduction of Cr
VI (
reaction 4) and hence will not influence the kinetics of the net conversion of Cr
VI to Cr
III until most of the Cr
VI has been converted. Consequently, linear slopes were observed in
Fig. 3 until most of the CrO
42− was reduced.
Hydrogen peroxide is another important water radiolysis product and it can act as both a reductant and an oxidant in reactions with chromium ions:
| | | 2 CrO42− + 3 H2O2 + 2 H2O → 2 Cr(OH)3 + 3 O2 + 4 OH− | (19) |
| | | 2 Cr(OH)3 + 3 H2O2 → 2 CrO42− + 4 H2O + 4 H+ | (20) |
These Fenton-like reactions can explain the negligible net production of H
2O
2. These reactions are important for determining [H
2O
2], but are much slower than
reactions (4) to (18) and hence their contributions to the chromium redox chemistry are negligible.
As [CrIII] increases, reaction (18) provides a pathway for removal of ˙OH. At steady state the time independent behaviour of [˙OH] is given by:37
| | 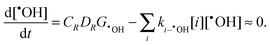 | (21) |
and
| | 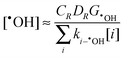 | (22) |
At the start of a test, when [Cr
III] is very low the main paths for removal of ˙OH are
| | | H2O2 + ˙OH → HO2˙ + H2O kH2O2−˙OH = 2.7 × 10⁷ M−1 s−1 | (23) |
| | | H2 + ˙OH → ˙H + H2O kH2−˙OH = 4.2 × 10⁷ M−1 s−1 | (24) |
At early times [˙OH] should be nearly independent of [Cr
VI]
0 and this is what we see in the lower graph of
Fig. 3. In stage 2, where [Cr
III] is high,
reaction (18) becomes the dominant path for removal of ˙OH. This results in a decrease in the [˙OH] and therefore a decrease in the rate of
reaction (24) and a consequent increase in [H
2], again as seen in
Fig. 3. This is the expected behaviour of H
2 as it is well established that the concentration of [H
2] is inversely proportional to [˙OH] in water systems exposed to continuous gamma irradiation.
373.3 Particle growth mechanism
Fig. 9 shows a schematic representation of the mechanism for the radiolytic formation of Cr2O3 nanoparticles. Particle growth in stage 1 is very slow and no appreciable particles could be collected for particle analysis (as discussed above). The Cr(OH)3 that is formed in stage 1 is homogeneously dispersed and particle growth occurs by agglomeration of CrIII driven by Brownian motion. No appreciable conversion of Cr(OH)3 to other oxides occurs until all of the CrVI is consumed. As the particles of Cr(OH)3 grow they begin to dehydrate and the inner oxide becomes Cr2O3. In stage 2, when the most of the CrVI has been reduced, dehydration continues and the water radiolysis products participate in redox reactions with chromium species on the particle surface. Eventually the system will reach a steady state in which the particles are largely Cr2O3 and cyclic reactions of CrIII with ˙OH and H2O2 and CrVI with ˙eaq− and H2O2 occur at the liquid–solid interface:
The final size of the particles formed is determined by the steady-state redox conditions at the particle liquid–solid interface. The existence of adsorbed CrVI on the particles is confirmed by the observation of CrVI on the unwashed particles that were collected (washing removes the soluble CrVI). Distilled water not only dissolves the adsorbed CrVI but also provides a different redox environment, changing the surface potential of the particles. This can promote agglomeration of CrIII particles by Ostwald ripening.56 Thus, when the particles were washed with distilled water after irradiation a wider range of size was observed (Fig. 6).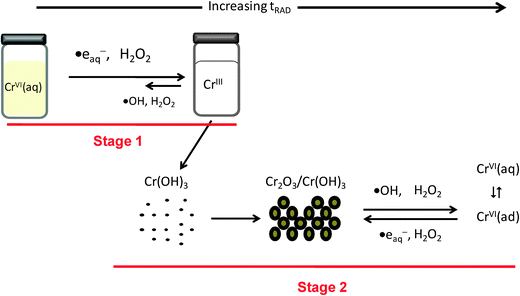 |
| | Fig. 9 Schematic representation of the proposed mechanism for the radiolytic formation of chromium oxide nanoparticles under steady state radiolysis. | |
4. Summary
Uniform-sized CrIII colloidal particles, 9–30 nm in diameter, were formed by gamma-irradiation of de-aerated solutions of dissolved CrVI (as K2Cr2O7) at pHs 6.0, 8.5 and 10.6. A radiation-induced Cr2O3 particle formation and growth mechanism is proposed based on the observed time-dependent behaviours of [CrVI], [CrIII(col)] and [H2], particle analyses by TEM and a range of spectroscopic techniques. In stage 1, the homogeneous aqueous reduction of CrVI to CrIII(col) by ˙eaq− is prevalent while particle growth by agglomeration of CrIII(col) (as Cr(OH)3) by Brownian motion is taking place at a slow rate. As the Cr(OH)3 particles grow, the interior of the particles dehydrates to form Cr2O3 while the outer layer remains hydrated. However, the dehydration rate is very slow since Cr(OH)3 is a relatively stable phase. In stage 2, most of the initial CrVI has been converted to Cr(OH)3 and has condensed onto particles. Redox reactions of chromium species occur on the particle surfaces. The surface redox reactions reach an equilibrium state with cyclic reactions of CrIII oxidation by ˙OH and H2O2 and CrVI reduction by ˙eaq− and H2O2. The final particle size distribution is determined by the steady-state redox conditions that are established at the liquid–solid interface.Acknowledgements
This work was funded under an NSERC (Natural Science and Engineering Research Council of Canada) Discovery grant. Support from a Canada Foundation for Innovation New Opportunity grant and a Ontario Research Fund Excellence in Research: Nuclear Ontario grant are greatly acknowledged for the purchase of the UV-Vis absorption and FTIR spectrometers, respectively. L. M. Alrehaily would like to thank the Ministry of Higher Education in Saudi Arabia for the funding of her graduate study.References
- T. Brock, M. Groteklaes and P. Mischke, in European Coating Handbook, Vincentz, Hannover, Germany, 2000 Search PubMed.
- B. M. Abu-Zied, Appl. Catal., A, 2000, 198, 139 Search PubMed.
- P. Berdhal, Trans. Am. Soc. Mech. Eng. J. Heat Transfer, 1995, 117, 355 Search PubMed.
- H. Kitsunai, K. Hokkirigawa, N. Tsumaki and K. Kato, Wear, 1991, 151, 279 Search PubMed.
- T. Ivanova, K. Gesheva, A. Cziraki, A. Szekeres and E. Vlaikova, J. Phys.: Conf. Ser., 2008, 113, 012030 Search PubMed.
- P. Gibot and L. Vidal, J. Eur. Ceram. Soc., 2010, 30, 911 Search PubMed.
- A. M. L. Medeiros, M. A. R. Miranda, A. S. de Menezes, P. M. Jardim, L. R. D. de Silva, S. T. Gouveia and J. M. Sasaki, J. Metastable Nanocryst. Mater., 2004, 20, 399 Search PubMed.
- Z. Pei, H. Xu and Y. Zhang, J. Alloys Compd., 2009, 468, L5 CrossRef CAS.
- M. D. Lima, R. Bonadimann, M. J. de Addrade, J. C. Toniolo and C. P. Bergmann, J. Eur. Ceram. Soc., 2006, 26, 1213 CrossRef CAS.
- N. Arul Dash, Y. Koltypin and A. Gedanken, Chem. Mater., 1997, 9, 3159 CrossRef.
- G. Peters, K. Jerg and B. Schramn, Mater. Chem. Phys., 1998, 55, 197 Search PubMed.
- Z. Gui, R. Fan, W. Mo, X. Chen, L. Yang and U. Hu, Mater. Res. Bull., 2003, 38, 169 Search PubMed.
- L. Znaidi and C. Pommier, Eur. J. Solid State Inorg. Chem., 1998, 35, 405 Search PubMed.
- A. Kawabata, M. Yoshinaka, K. Hirota and O. Yamaguchi, J. Am. Ceram. Soc., 1995, 78, 2271 CrossRef CAS.
- D. W. Kim, S. I. Shin, J. D. Lee and S. G. Oh, Mater. Lett., 2004, 58, 1894 CrossRef CAS.
- U. Balachandran, R. W. Siegel, Y. X. Liao and T. R. Askew, Nanostruct. Mater., 1995, 5, 505 Search PubMed.
- D. Vollath, D. V. Szabo and J. O. Willis, Mater. Lett., 1996, 29, 271 CrossRef CAS.
- C. Zhu, Y. Hong, J. Zhang and B. Zhou, Key Eng. Mater., 2007, 353, 2111 Search PubMed.
- M.-E. Meyre, M. Treguer-Delapierre and C. Faure, Langmuir, 2008, 24, 4421 CrossRef CAS.
- P. A. Yakabuskie, J. M. Joseph, P. Keech, G. A. Botton, D. Guzonas and J. C. Wren, Phys. Chem. Chem. Phys., 2011, 13, 7198 RSC.
- T. Li, H. G. Park and S.-H. Choi, Mater. Chem. Phys., 2007, 105, 325 CrossRef CAS.
- J. Kotas and Z. Stasicka, Environ. Pollut., 2000, 107, 263 CrossRef CAS.
- Y.-L. Wei, W.-J. Sun, H.-C. Huang, Y.-W. Yang and J.-F. Lee, J. Electron Spectrosc. Relat. Phenom., 2005, 144, 303 Search PubMed.
- S. Aber, A. R. Amani-Ghadim and V. Mirzajani, J. Hazard. Mater., 2009, 171, 484 Search PubMed.
- E. J. Yurkow, J. Hong, S. Min and S. Wang, Environ. Pollut., 2002, 117, 1 Search PubMed.
- M. Pettine, I. Barra, L. Campanella and F. J. Millero, Water Res., 1998, 32, 2807 CrossRef CAS.
- E. Dermou, A. Velissariou, D. Xenos and D. V. Vayenas, J. Hazard. Mater., 2005, B126, 78 Search PubMed.
- S.-J. Yuan, Z. Zheng, Y.-Y. Mu, X. Yu and Y.-F. Zhao, J. Environ. Sci., 2006, 18, 254 Search PubMed.
- J. C. Wren, in ACS Symposium Series: Nuclear Energy and the Environment, ed. C. M. Wai and B. J. Mincher, American Chemical Society, Washington, D.C., 2010, vol. 1046, p. 271 Search PubMed.
- J. W. T. Spinks and R. J. Woods, An Introduction to Radiation Chemistry, Wiley, New York, 1990 Search PubMed.
- J. Belloni, M. Mostafavi, H. Remita, J. L. Marignier and M. O. Delcourt, New. J. Chem., 1998, 22, 1239 RSC.
- Y. Ni, X. Ge, Z. Zhang and Q. Ye, Chem. Mater., 2002, 14, 1048 CrossRef CAS.
- S. Chen, Y. Liu and G. Wu, Nanotechnology, 2005, 16, 2360 CrossRef CAS.
- L. M. Alrehaily, J. M. Joseph, M. C. Biesinger, D. A. Guzonas and J. C. Wren, Phys. Chem. Chem. Phys. Search PubMed , under review.
- F. Djouider and M. S. Aljohani, J. Radioanal. Nucl. Chem., 2010, 285, 417 Search PubMed.
- J. D. Ramsey, L. Xia, M. W. Kendig and R. L. McCreery, Corros. Sci., 2001, 43, 1557 Search PubMed.
- J. M. Joseph, B.-S. Choi, P. A. Yakabuskie and J. C. Wren, Radiat. Phys. Chem., 2008, 77, 1009 CrossRef CAS.
- C. J. Hochanadel, J. Phys. Chem., 1952, 56, 587 CrossRef CAS.
- I. Stefanic and J. A. LaVerne, J. Phys. Chem. A, 2002, 106, 447 CrossRef CAS.
- T. Shigematsu, S. Gohad, H. Yamazaki and Y. Nishikawa, Bull. Inst. Chem. Res., Kyoto Univ., 1977, 55, 429 Search PubMed.
- Hydrolysis of Cations, ed. C. F. Baes and R. E. Mesmer, Krieger Pub. Co., 1986 Search PubMed.
- R. E. Kirk and D. F. Othmer, Kirk-Othmer Encyclopedia of Chemical Technology, John Wiley and Sons, 4th edn, 2003 Search PubMed.
- M. C. Biesinger, B. P. Payne, A. P. Grosvenor, L. W. M. Lau and A. R. Gerson, Appl. Surf. Sci., 2011, 257, 2717 CrossRef CAS.
- Farhataziz and M. A. J. Rodgers, in Radiation Chemistry: Principles and Applications, VCH Publishers, New York, 1987 Search PubMed.
- G. V. Buxton, in Radiation Chemistry, ed. M. Spotheim-Maurizot, M. Mostafavi, T. Douki and J. Belloni, EDP Sciences, France, 2008 Search PubMed.
- E. J. Hart and M. Anbar, The Hydrated Electron, Wiley Interscience, New York, 1970 Search PubMed.
- J. Y.-P. Tong and E. L. King, J. Am. Chem. Soc., 1960, 82, 3805 CrossRef CAS.
- G. V. Buxton and F. Djouider, J. Chem. Soc., Faraday Trans., 1996, 92, 4173 RSC.
- J. J. P. Stewart, J. Mol. Model., 2007, 13, 1173 CrossRef CAS.
- Y. B. Vysotsky, E. A. Belyaeva, V. B. Fainerman, D. Vollhardt, E. V. Aksenenko and R. Miller, J. Phys. Chem. B, 2009, 113, 4347 CrossRef CAS.
- S. Klemme, H. St. C. O'Neill, W. Schnelle and E. Gmelin, Am. Mineral., 2000, 85, 1686 Search PubMed.
- H. A. Schwarz, J. Phys. Chem., 1991, 95, 6697 CrossRef CAS.
- G. V. Buxton, C. L. Greenstock, W. P. Helman and A. B. Ross, J. Phys. Chem. Ref. Data, 1988, 17, 513 CAS.
- G. V. Buxton, F. Djouider, D. A. Lynch and T. N. Malone, J. Chem. Soc., Faraday Trans., 1997, 93, 4265 RSC.
- M. Al-Sheikhly and W. L. McLaughlin, Radiat. Phys. Chem., 1991, 38, 203 Search PubMed.
- R. Boistelle and J. P. Astier, J. Cryst. Growth, 1988, 90, 14 CrossRef CAS.
|
| This journal is © the Owner Societies 2013 |
Click here to see how this site uses Cookies. View our privacy policy here.