Formation of SERS active nanoparticle assemblies via specific carbohydrate–protein interactions†
Derek
Craig
,
Jonathan
Simpson
,
Karen
Faulds
and
Duncan
Graham
*
Centre for Molecular Nanometrology, WestCHEM, Pure and Applied Chemistry, University of Strathclyde, 295 Cathedral Street, Glasgow, G1 1XL, UK. E-mail: Duncan.graham@strath.ac.uk
First published on 22nd October 2012
Abstract
An on/off SERS aggregation system has been designed to investigate carbohydrate–lectin interactions. Detection of the lectin ConA was achieved at pico molar levels. Discrimination was also demonstrated between two different carbohydrate moieties demonstrating the specific interaction between the carbohydrate and specific protein present.
Monomeric binding interactions between carbohydrates and proteins have weak millimolar binding constants.1–3 A multivalent platform is therefore desired for studying carbohydrate–protein interactions. To circumvent this issue our study details the formation of multivalent species, which have been produced via the conjugation of carbohydrates to the surface of nanoparticles.
In recent years the interactions of DNA, proteins and carbohydrates have led to valuable information being obtained about numerous disease states.4 The interactions of carbohydrates and proteins are key to cellular processes such as the interactions of viruses and bacteria, cell differentiation, cell development, cell-to-cell adhesion and cancer metastasis to name but a few examples.5–7 A class of proteins known as lectins are highly specific towards certain carbohydrates.8 Lectins are ubiquitous in nature and are known for their agglutinating activity on a wide variety of cells.9,10 Concanavalin A (ConA) is the most researched lectin and is widely used to characterize glycoproteins and glycolipids present on the surface of various cells.11 ConA exhibits specificity towards α-D-mannosyl and α-D-glucosyl residues.12 The technique of surface enhanced Raman scattering (SERS) can make use of metal nanoparticles as the enhancing surface for Raman scattering and produces molecularly specific spectra with single molecule sensitivity possible.13–15 The multiplexing capabilities of SERS are ideal for the detection of multiple analytes simultaneously due to the ease by which each analyte can be identified in a mixture.16,17 More recently, studies have indicated that significant SERS enhancement can be obtained using nanoparticle assemblies promoted by specific biological interactions such as DNA hybridization and DNA–protein interactions.18,19 Here, we report the first use of SERS to demonstrate the formation of multivalent interactions between dye-coded glyconanoparticles and their partner lectins resulting in the formation of aggregates by measuring the change in SERS enhancement as a result of their specific interaction.
Recent studies to detect the interactions of proteins and carbohydrates have utilised nanomaterials and localized surface plasmon resonance (LSPR) for detection.2 LSPR detects changes in the optical environment of the nanomaterials and as such can be used to detect these interactions. Although simple to use, the change in the LSPR of the metal nanoparticles is limited in sensitivity and provides little information on the nature of the interacting species. In this study, we make use of the fact that aggregated nanoparticles produce a strong electromagnetic field at the interstices between nanoparticles, which results in a significant increase in SERS intensity.20,21 However, it can be difficult to control this aggregation and greatly increase the SERS enhancement in a reproducible manner. Poly-(L-lysine), spermine, sodium chloride and nitric acid amongst others have all been used previously as aggregating agents.22–24 However, these approaches result in a non-specific enhancement occurring.22–24
SERS active glyconanoparticles were produced using a mixed monolayer approach. When designing the glyconanoparticles a number of options were available to link the sugar to the surface however, a short thiol linker attached to the sugar was preferred in tandem with a specific SERS reporter for silver nanoparticles. Mirkin et al., have previously shown that DNA-linked systems exhibit significant changes in their optical properties due to a dependence on the spacer length and proximity of the nanoparticles to each other within the aggregate.25 Therefore, it was essential to use a short spacer ligand to bind the carbohydrate to the nanoparticle surface to greatly increase the surface density and ensure that the aggregated nanoparticles were in the closest proximity possible. The synthesised linker incorporated a lactose derivative for interaction with ConA via the α-D-glucose residues. The SERS reporter used with this linker was a non fluorescent benzotriazole dye, which ensured the SERS analysis was reproducible due to the irreversible adsorption of the dye to the silver nanoparticles.26Fig. 1A shows a conceptual diagram of the functionalised silver nanoparticles. Silver nanoparticles were chosen for use in this study due to the 10 fold increase in scattering efficiency in comparison to gold nanoparticles. The interaction of the lactose functionalised nanoparticles with ConA was performed at physiological pH, 7.4, as at this pH ConA exists as a tetramer.27 Theoretically, four available binding units therefore exist for binding to the α-glucose residues present on the lactose ligands. Consequently, as there are multiple α-glucose residues available then multivalent carbohydrate–lectin interactions can occur at the one time between multiple nanoparticles, thereby, giving rise to an aggregated nanoparticle assembly as shown in Fig. 1B.
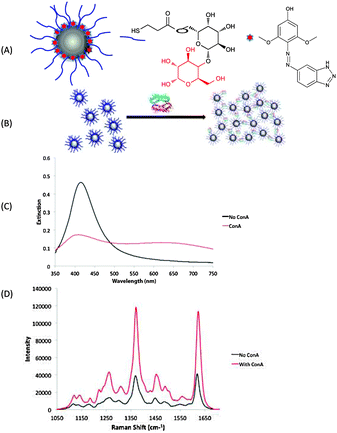 | ||
| Fig. 1 (A) Formation of glyconanoparticles via a mixed monolayer approach. (B) Formation of aggregate structures as a result of ConA interaction with the glyconanoparticles. (C) Extinction spectra and (D) SERS spectra before and after the addition of ConA. SERS spectra averaged from 5 replicates with a 1 s accumulation using 514.5 nm laser excitation. | ||
The formation of dye-coded glyconanoparticles was monitored by extinction spectroscopy and dynamic light scattering (DLS) to ensure no aggregation had occurred prior to addition of ConA. SERS analysis was also performed before exposure to a 1 μM solution of ConA. After 10 minutes of incubation and agitation, further SERS and extinction measurements were obtained. As shown in Fig. 1C, upon exposure to ConA there was a significant change in the extinction spectra of the nanoparticles. More importantly, there is a significant enhancement in SERS intensity occurring thus indicating the formation of aggregates as predicted (Fig. 1D). Upon the carbohydrate–lectin interactions occurring there are slight but non-significant shifts of the benzotriazole dye peaks.
Control measurements were conducted using peanut agglutinin (PNA), which is a tetrameric lectin with no binding affinity towards α-D-glucose residues.28 These results showed no SERS intensity enhancement upon the introduction of PNA in comparison to the enhancement obtained upon addition of ConA (Fig. S1, ESI†) indicating the specific nature of this response.
Previous studies have shown that the interaction of lactose and ConA is reversible in the presence of mannose due to a preferential binding affinity displayed by ConA towards α-D-mannosyl residues.29 Therefore, a solution of 1 mM mannose was incubated for 6 h with the aggregated nanoparticle assemblies. SERS measurements were taken at regular intervals within this time period and these measurements showed a decrease in SERS intensity, which eventually was reduced to a level similar to that of the glyconanoparticles in the absence of ConA (Fig. S2, ESI†) showing that the glyconanoparticles had returned to a non-aggregated state due to the preferred binding of ConA to mannose. The non-aggregated nanoparticles could then be separated from the ConA–mannose complex by centrifugation and the nanoparticles aggregated once again in the presence of ConA to confirm that the integrity of the nanoparticles remained.
An important advantage of using SERS instead of colorimetric techniques is the additional sensitivity afforded, allowing analysis of biomolecules at very low concentrations. As a result, SERS was used to monitor the lowest ConA concentration at which aggregate assemblies continued to form. A calibration study was performed which measured the SERS intensity obtained from glyconanoparticles in the presence of a variety of concentrations of ConA. A linear range of detection was obtained from which the limit of detection (LOD) was calculated to be 40 pM for this system (Fig. 2(ii)). A similar study was undertaken using extinction spectroscopy and an LOD of 78 nM was obtained which was similar to the previous LOD ascertained for colorimetric measurement of these interactions (Fig. 2(i)).8,30 Therefore, the use of SERS is vital in monitoring the formation of these nanoparticle assemblies at exceedingly low concentrations.
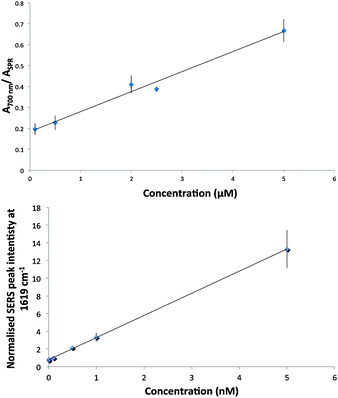 | ||
| Fig. 2 LOD studies of ConA induced aggregation of glyconanoparticles by (i) Extinction spectroscopy and (ii) SERS 1 s accumulation using 514.5 nm laser excitation. Each point represents the mean of 5 replicates and error bars represent ± one standard deviation. | ||
Further investigation of the bio molecularly induced formation of these nanoparticle assemblies used scanning electron microscopy (SEM). Aggregation was induced at concentrations greater than the theoretical LOD. The corresponding SEM images show the formation of aggregate clusters as expected. (Fig. S3, ESI†) As a further test of the sensitivity of this system solutions were analysed at a final concentration of ConA of 40 pM. From these results, it was shown that biomolecularly induced nanoparticle assembly was still occurring at such concentrations.
A second set of carbohydrate nanoparticle conjugates were also designed. A similar mixed monolayer approach was adhered to as previously. This time a short thiol ligand was synthesised which incorporated a galactose derivate and a different benzotriazole dye was used to code the nanoparticle surface for SERS analysis. ConA shares no specific interaction with galactose residues. These nanoparticles were used, as a negative control to prove that the interaction between the lactose encoded nanoparticles and ConA was molecularly specific. The SERS spectra of each of the individual glyconanoparticle solutions are shown in Fig. S4 (ESI†). An equimolar solution of the lactose and galactose coded nanoparticles was analysed by SERS giving rise to a duplex spectrum due to both benzotriazole dyes being present (Fig. 3(i)). ConA was added to a final concentration of 10 nM and over the course of 6 h the SERS analyses of the mixed solution of nanoparticles was monitored. After 6 h of incubation with ConA the most significant enhancement of the SERS intensity of the lactose coded nanoparticles had occurred (Fig. 3(ii)). Thus, as expected the lactose coded nanoparticles formed nanoparticle aggregates due to their interaction with ConA whilst the galactose encoded nanoparticles showed no significant enhancement in SERS intensity. This competitive assembly process is an excellent example of the discriminatory power of this system and indicates the potential for deployment in studies involving a variety of interacting species.
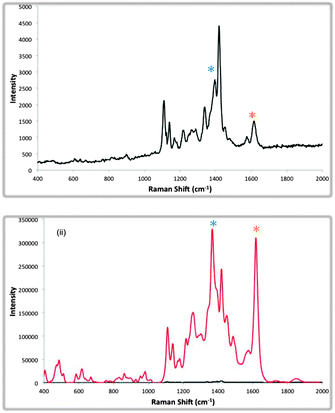 | ||
| Fig. 3 Averaged SERS spectra of 5 replicates at 514.5 nm of (i) a mixed solution of lactose and galactose coded nanoparticles in the absence of ConA and (ii) SERS analysis of the mixed solution after 6 h incubation with ConA. Red line shows the increase in SERS intensity of the duplex due to aggregation. The black line shows the SERS intensity of the non-aggregated duplex. | ||
This study has shown the first example of SERS templated nanoparticle assembly via the interactions of carbohydrates and lectins. Sensitivity has been achieved which is unparalleled by the current detection techniques in this field. The presence of these lectins in a variety of biological species is proof of their importance in studying a wide range of biological interactions. ConA has been utilised as proof of concept and the next phase of development for this research would be to expand to a variety of lectins to study their interactions in a cellular environment.
The authors acknowledge funding from the EPSRC and ACTF. DG acknowledges support from the Royal Society through a Wolfson Research Merit Award.
Notes and references
- O. Martinez-Avila, L. M. Bedoya, M. Marradi, C. Clavel, J. Alcami and S. Penades, Chembiochem, 2009, 10, 1806 CrossRef CAS.
- D. C. Hone, A. H. Haines and D. A. Russell, Langmuir, 2003, 19, 7141 CrossRef CAS.
- A. G. Barrientos, J. M. De La Fuente, T. C. Rojas, A. Fernandez and P. Soledad, Chem.–Eur. J., 2003, 9, 1909 CrossRef CAS.
- S. S. Agasti, S. Rana, M.-H. Park, C. K. Kim, C.-C. You and V. M. Rotello, Adv. Drug Delivery Rev., 2010, 62, 316 CrossRef CAS.
- R. Ahuja, N. K. Singhal, B. Ramanujam, M. Ravikumar and C. P. Rao, J. Org. Chem., 2007, 72, 3430 CrossRef CAS.
- R. Jelinek and S. Kolusheva, Chem. Rev., 2004, 104, 5987 CrossRef CAS.
- N. Sharon, Adv. Exp. Med. Biol., 1996, 408, 1 CrossRef CAS.
- C. L. Schofield, R. A. Field and D. A. Russell, Anal. Chem., 2007, 79, 1356 CrossRef CAS.
- E. Z. M. Martinez-Cruz and F. Cordoba, Biochim. Biophys. Acta, 2001, 1568, 37 CrossRef.
- R. C. M. Silfkin, J. Clin. Microbiol., 1989, 27, 1036 Search PubMed.
- T. D. J. Wang, L. Sun, D. Liu and Z. Wang, Anal. Biochem., 2009, 392, 77 CrossRef.
- X. Wang, O. Ramstrom and M. D. Yan, Anal. Chem., 2010, 82, 9082 CrossRef CAS.
- J. A. Dougan and K. Faulds, Analyst, 2012, 137, 545 RSC.
- I. A. Larmour, K. Faulds and D. Graham, Chem. Sci., 2010, 1, 151 RSC.
- M. Seydack, Biosens. Bioelectron., 2005, 20, 2454 CrossRef CAS.
- K. Faulds, F. McKenzie, W. E. Smith and D. Graham, Angew. Chem., Int. Ed., 2007, 46, 1829 CrossRef CAS.
- K. Faulds, R. Jarvis, W. E. Smith, D. Graham and R. Goodacre, Analyst, 2008, 133, 1505 RSC.
- D. Graham, D. G. Thompson, W. E. Smith and K. Faulds, Nat. Nanotechnol., 2008, 3, 548 CrossRef CAS.
- A. J. Bonham, G. Braun, I. Pavel, M. Moskovits and N. O. Reich, J. Am. Chem. Soc., 2007, 129, 14572 CrossRef CAS.
- M. Moskovits, J. Raman Spectrosc., 2005, 36, 485 CrossRef CAS.
- A. Shkilnyy, M. Souce, P. Dubois, F. Warmont, M.-L. Saboungi and I. Chourpa, Analyst, 2009, 134, 1868 RSC.
- D. Cunningham, R. E. Littleford, W. E. Smith, P. J. Lundahl, I. Khan, D. W. McComb, D. Graham and N. Laforest, Faraday Discuss., 2006, 132, 135 RSC.
- C. J. McHugh, F. T. Docherty, D. Graham and W. E. Smith, Analyst, 2004, 129, 69 RSC.
- A. M. Michaels, J. Jiang and L. Brus, J. Phys. Chem. B, 2000, 104, 11965 CrossRef CAS.
- J. J. Storhoff, A. A. Lazarides, R. C. Mucic, C. A. Mirkin, R. L. Letsinger and G. C. Schatz, J. Am. Chem. Soc., 2000, 122, 4640 CrossRef CAS.
- G. McAnally, C. McLaughlin, R. Brown, D. C. Robson, K. Faulds, D. R. Tackley, W. E. Smith and D. Graham, Analyst, 2002, 127, 838 RSC.
- E. A. Smith, W. D. Thomas, L. L. Kiessling and R. M. Corn, J. Am. Chem. Soc., 2003, 125, 6140 CrossRef CAS.
- S. Cunningham, J. Q. Gerlach, M. Kane and L. Joshi, Analyst, 2010, 135, 2471 RSC.
- D. Page and R. Roy, Glycoconjugate J., 1997, 14, 345 CrossRef CAS.
- C. L. Schofield, A. H. Haines, R. A. Field and D. A. Russell, Langmuir, 2006, 22, 6707 CrossRef CAS.
Footnote |
| † Electronic supplementary information (ESI) available. See DOI: 10.1039/c2cc36949d |
| This journal is © The Royal Society of Chemistry 2013 |