Cationic amphiphilic polysaccharide nanoballs: protein stabilization and intracellular delivery by nano-encapsulation†
Haruko
Takahashi
a,
Yoshiro
Tahara
b,
Shin-ichi
Sawada
ab and
Kazunari
Akiyoshi
*ab
aDepartment of Polymer Chemistry, Graduate School of Engineering, Kyoto University, Kyoto Daigaku Katsura, Nishikyo-ku, Kyoto 615-8510, Japan. E-mail: akiyoshi@bio.polym.kyoto-u.ac.jp; Fax: +81 75 383 2590; Tel: +81 75 383 2589
bJST-ERATO, Bio-nanotransporter project, Kyodai Katsura Venture Plaza, 1-36 Goryo-Ohara, Nishikyo-ku, Kyoto 615-8245, Japan
First published on 15th May 2013
Abstract
A new intracellular protein delivery nanocarrier with protein stabilizing ability was constructed of cationic amphiphilic polysaccharide nanoballs. Amphiphilic enzymatically synthesized glycogen (ESG) made by modification of hydrophobic cholesterol groups to ESG, which is a monodispersed spherical hyper-branched polysaccharide nanoparticle, formed self-assembled cluster nanogels (CHESG nanogels) in water. Cationic amphiphilic ESG derivatives where the diethylethylenediamine (DEAE) group was introduced into CHESG (CHESG-DEAE) were positively charged, monodispersed, and non-aggregated amphiphilic nanoballs with hydrophobic nanodomains provided by the cholesterol groups. The CHESG-DEAE strongly interacted with proteins and stabilized them against thermal denaturation. Furthermore, the cationic CHESG effectively internalized a number of proteins into HeLa cells. This cationic ESG nanoball-based material shows great potential as an effective protein delivery nanocarrier.
Introduction
The development of recombinant DNA technology provides a greater availability of a large number of therapeutic proteins or protein-based antigens for curative medicines or vaccines.1 Protein drugs, however, require special handling to travel from the administration site to their specific target location while escaping degradation by enzymes or denaturation.2,3 Protein delivery systems using intelligent polymeric nanocarriers have gained considerable attention as one of the most promising techniques to overcome these limitations.4 Polysaccharides have been successfully used as template polymers for nanocarriers.5–7 In addition to in vivo degradation by enzymes after administration, therapeutic proteins must also resist various other types of stress such as temperature, mechanical stress, light exposure, and interactions with packaging materials or administration devices.8 Nanoencapsulation, the process of internalizing proteins into nanocapsules, is an approach suitable for protecting proteins from process-related stress.9 We developed an amphiphilic polysaccharide nanogel as an effective nanocarrier for drug delivery systems.10 Cholesterol-bearing pullulan (CHP), where a small number (<5 mol% per glucose unit) of cholesterol groups are linked to the linear polysaccharide pullulan, forms stable nanoparticles in water.11 CHPs behave like hydrated nanometer-sized gels (CHP nanogels) held together via cholesterol nanodomains acting as physical cross-linking points. CHP nanogels can complex soluble proteins such as bovine serum albumin or insulin, and stabilize the proteins against thermal stress by encapsulation.12,13Furthermore, CHPs act as artificial molecular chaperones that assist refolding of denatured proteins to their native forms during the release process.14,15 These unique properties of the nanogels are valuable for their use in protein delivery systems. Cationic CHP nanogels effectively deliver proteins into various cells while maintaining the activities of the proteins in vitro.16 RGD peptide-modified CHPs have been used for cell specific protein delivery targeting integrin overexpressing tumor cells.17 For purposes of developing an antigen protein carrier as a vaccine, in vivo experiments have shown that CHP nanogels are useful for the delivery of cancer vaccines (under clinical trials in immunotherapy18) and for adjuvant-free intranasal vaccines.19
Recently, we published a new amphiphilic nanogel using enzymatically synthesized glycogen (ESG) as the template polysaccharide.20 ESG is a highly branched (1→4)(1→6)-linked α-glucan that is synthesized from short-chain amylose by the cooperative reactions of branching enzyme (BE, EC 2.4.1.18) and amylomaltase (AM, EC 2.4.1.25).21,22 ESG is a natural dendritic molecule and a monodispersed spherical nanoparticle (molecular weight: 2.2 × 10⁶; hydrodynamic radius (RH): 13.5 nm; number-average chain length: 9.3; approximately 1400 non-reducing ends) in the form of a polysaccharide nanoball.20–22 Because ESG has a huge α-macrodextrin component as a core which contains almost all of the α-1,6 linkages, ESG is poorly hydrolyzed by α-amylase, which can degrade only the peripheral parts of the ESG molecule.23,24 From in vivo experiments on ESG, the safety of oral administration was confirmed,25 and the anti-tumor activity in Meth A tumor-bearing mice26 and effects on the plasma glucose level27 were reported. Cholesterol group-modified ESG (CHESG) formed cluster nanogels (amphiphilic polysaccharide nanoballs) approximately 35 nm in diameter by self-assembly in water.20 The CHESG nanogel was capable of stable complexation with a number of proteins and high-performance artificial molecular chaperones for thermal stabilization of enzymes.
Here, we evaluated the potentials of the CHESG nanogel as a protein stabilization agent and an intracellular delivery nanocarrier. We synthesized a cationic amphiphilic ESG derivative (CHESG-DEAE) by introducing N,N-diethylethylenediamine (DEAE) as a cationic group into CHESG. The solution properties of ESG derivatives in water were measured by dynamic light scattering (DLS), size-exclusion chromatography (SEC), multi-angle laser light scattering (MALS), transmission electron microscopy (TEM), and fluorescence spectroscopy. Interactions with proteins and the thermal stabilizing effects of CHESG and CHESG-DEAE were investigated using fluorescence correlation spectroscopy (FCS), atomic force microscopy (AFM) and circular dichroism (CD). Measurement of its intracellular uptake efficiency into HeLa cells using flow cytometry and confocal laser scanning fluorescence microscopy (CLSFM), the suitability of the cationic CHESG nanogel as a protein delivery carrier was estimated.
Experimental methods
Materials
Enzymatically synthesized glycogen (ESG) (Mw = 2.20 × 10⁶ g mol−1, Mw/Mn = 1.41, and RH = 13.5 ± 0.1 nm) was a kind gift from Ezaki Glico Co., Ltd (Osaka, Japan). Cholesterol group-bearing ESG (CHESG) was synthesized and reported previously.20 The degree of substitution (DS) of cholesterol groups in CHESG was 140 per ESG molecule. The molecular weight (Mw) of CHESG was 6.0 × 10⁶, Mw/Mn = 1.11, and RH was 18.1 ± 0.2 nm. Tetramethylrhodamine isothiocyanate (TRITC)-labeled bovine serum albumin (TRITC-BSA) and fluorescein isothiocyanate (FITC)-labeled BSA (FITC-BSA) were purchased from Sigma-Aldrich, Inc. (Saint Louis, MO). TRITC-BSA was used after purification. All other reagents were commercially available and were used without further purification.Synthesis of cationic ESG and CHESG
Cationic ESG and CHESG derivatives (named ESG-DEAE, CHESG-DEAE) were synthesized by modification of N,N-diethylethylenediamine (DEAE) to ESG and CHESG. Dried ESG or CHESG dissolved in dry dimethyl sulfoxide (DMSO) was reacted with 1,1′-carbonyldiimidazole (Sigma-Aldrich, Inc.) at room temperature for 5 h to activate the glucose hydroxyl groups. Then, excess DEAE (Tokyo Chemical Industry Co., Ltd, Tokyo, Japan) was added. The mixture was kept at room temperature for 24 h. The reaction solution was dialyzed against distilled water to remove non-reactive agents and solvents, and lyophilized to give a white powder. The degree of substitution (DS) of the DEAE molecules was determined by 1H-NMR and elemental analysis. 1H-NMR (400 MHz, Bruker Biospin GmbH, Germany; solvent, DMSO-d6–D2O = 9/1 (v/v)): σ 0.9–1.1 (6H, –CH2CH3), 2.8–4.6 (glucose, 2H, 3H, 4H, 5H, and 6H), 4.9–5.5 (glucose, 1H(1→4)). Elemental analysis (CHN CORDER MT-5, Yanako, Kyoto, Japan): ESG-DEAE (C, 41.83%; H, 6.70%; N, 1.89%), CHESG-DEAE (C, 42.78%; H, 6.89%; N, 2.03%). ESG-DEAE and CHESG-DEAE containing 1830 and 1890 DEAE cationic groups per ESG molecule, respectively, were obtained.Preparation of ESG derivative solutions
ESG derivatives were dissolved in phosphate-buffered saline (Dulbecco's PBS, pH 7.4, Sigma) with stirring to give a clear solution. The solution was sonicated at 40 W for 15 min with a sonicator probe (Sonifier 250, Branson Ultrasonics Co., Danbury, CT) and filtered through a 0.22 μm PVDF filter (Millex®-GV, Millipore Co., Bedford, MA).DLS and ζ-potential measurements
DLS measurements were carried out at 25 °C using a Zetasizer Nano ZS (Malvern Instruments Ltd, Malvern, Worcestershire, UK) at a wavelength of 633 nm and a 173° detection angle to determine the size of the ESG derivatives and ESG derivative–protein complexes. The ESG derivatives were suspended at a concentration of 1.0 mg mL−1 in PBS. The ESG derivatives (2.0 mg mL−1)–FITC-BSA (0.044 mg mL−1) complexes were prepared by incubation at 25 °C for 24 h. The measured autocorrelation function was analyzed by the cumulant method. The hydrodynamic radius of the particles was calculated using the Stokes–Einstein equation.ζ-Potential measurements were also carried out at 25 °C using a Zetasizer Nano ZS at a 90° detection angle to investigate the ζ-potential of the ESG derivatives (1.0 mg mL−1) and ESG derivatives (2.0 mg mL−1)–FITC-BSA (0.044 mg mL−1) complexes in PBS. These measurements were performed using a capillary ζ-potential cell in automatic mode.
SEC-MALS
The SEC-MALS system consisted of an RI-8020 refractive index detector (Tosoh Co., Tokyo, Japan), and a DAWN-DSP MALS detector with a laser operated at 690 nm (Wyatt Technology, Santa Barbara, CA), using an SEC column (TSK-gel G6000PWXL-CP, Tosoh Bioscience LLC, PA, ∅ 7.8 mm × 300 mm) eluted with PBS (pH 7.4, Sigma) at a flow rate of 0.5 mL min−1 at 25 °C. Molecular weights and molecular weight distributions were calculated using ASTRA software (Wyatt Technology, Santa Barbara, CA) based on Zimm's equation with a refractive index increment (dn/dc) of 0.149 mL g−1 (reported previously20).Freeze-fracture TEM (FF-TEM)
FF-TEM observations of replicas of samples were performed using a TEM (JEM-1011, JEOL, Tokyo, Japan) at an accelerating voltage of 100 kV. For the replicas, CHESG-DEAE was suspended at a concentration of 14.0 mg mL−1 in milliQ water containing 30% glycerin, and then freeze-fractured. The fracturing and replication were carried out on an FF device (JFD-9010, JEOL, Tokyo, Japan) at −120 °C and 10−5 Pa.Fluorescence spectroscopic measurement
Solutions for analysis were prepared as follows. The stock solution (12 μL) of pyrene (Py) in ethanol (1 × 10⁻⁴ M) was placed in several empty vials. The ethanol was evaporated by a gentle stream of gaseous nitrogen to form a thin film on the bottom of the vials. The ESG derivative solutions (1.2 mL) at a concentration of 10.0 mg mL−1 were added to the vials, giving a final concentration of Py of 1 × 10⁻⁶ M in each vial. The Py aqueous solution (10 mL, final concentration, 1 × 10⁻⁶ M) was also prepared by the addition of PBS instead of nanogel solution. The solutions were stirred at 25 °C for 24 h under light-protected conditions. The emission spectra of Py at the various concentrations (0.001–10.0 mg mL−1) of ESG derivative solutions were measured by gradual dilution by the addition of Py aqueous solution. The concentration of Py was kept at 1 × 10⁻⁶ M. The fluorescence spectra (wavelength 350–500 nm) were recorded on a fluorescence spectrophotometer (FP-6500, JASCO Co., Tokyo, Japan) using the following conditions: excitation at 339 nm, slit width 3 nm for excitation, and 3 nm for emission. The intensities of the bands I1 at 374 nm and I3 at 385 nm were then evaluated, and their ratio was plotted versus the concentration of the ESG derivative.FCS
The binding constants of BSA with the ESG derivatives were estimated by FCS, as previously described.20 FCS measurements were performed using a FluoroPoint-Light (Olympus Co., Tokyo, Japan). Various concentrations of the ESG derivative solutions in PBS were mixed with TRITC-BSA (final concentration 2.5 nM), and incubated at 25 °C for 24 h. All experiments were performed with an acquisition time of 10 s per measurement, with triplicate measurements per sample. The FCS data were analyzed using FluoroPoint-Light software. The binding constants were calculated from triplicate measurements with an Origin 8 (OriginLab Co., Northampton, MA) using the best fit. The protein-binding reaction to the nanogel was represented by eqn (1):| protein + nanogel ⇄ complex | (1) |
The binding constant K can be evaluated according to the following eqn (2)–(4):
 | (2) |
 | (3) |
 | (4) |
Circular dichroism (CD)
The CD spectra were measured using a quartz cuvette with 1 mm light path length and a JASCO J-720 spectropolarimeter (JASCO Co., Tokyo, Japan) under a constant gaseous nitrogen flow at 25 °C. CHESG or CHESG-DEAE was suspended at a concentration of 24.0 mg mL−1 in PBS. Then, 0.528 mg mL−1 of FITC-BSA was added to the CHESG solution, and incubated at 25 °C. The final concentration of CHESG or CHESG was 12.0 mg mL−1 and that of FITC-BSA was 0.264 mg mL−1. After incubation at 25 °C for 24 h, the CD spectra were measured.The change in the secondary structure of FITC-BSA as a function of temperature was estimated by the value of CD ellipticity at 222 nm. FITC-BSA at a concentration of 0.264 mg mL−1 was dissolved in the absence or presence of CHESG or CHESG-DEAE solution (12.0 mg mL−1 in PBS), and incubated at 25 °C for 24 h. Next, the mixture was diluted ten times with PBS buffer to prepare samples for measurement. First, the sample solution was gradually heated from 25 °C to 90 °C at 1.0 °C min−1, and then it was cooled from 90 °C to 25 °C at 1.0 °C min−1. The values of CD ellipticity at 222 nm were recorded by a CD spectropolarimeter using a sealed quartz cuvette with a 10 mm light path length.
Flow cytometry
HeLa cells (DS Pharma Biomedical Co., Ltd, Osaka, Japan) were cultured in a minimum essential medium (MEM) with 10% fetal bovine serum (FBS) and 1% antimycotic antibiotic. Cells were plated in a six-well culture dish at a density of 1.0 × 10⁵ cells per well and cultured for 20 h at 37 °C in 5% CO2. The ESG derivative–BSA complexes were prepared by incubating 6.0 mg mL−1 ESG derivative in PBS solution with 0.132 mg mL−1 FITC-BSA at 25 °C for 24 h. The commercially available protein carrier cationic liposome28 (BioPORTER®, Genlantis, San Diego, CA) complexed with 0.132 mg mL−1 FITC-BSA was prepared by hydrating dry lipid and incubating at 25 °C for 30 min according to the manufacturer's protocol. These carrier–BSA complex solutions were added to fresh MEM (total volume = 1.0 mL, final concentration of ESG derivatives = 120 μg mL−1 and FITC-BSA = 2.64 μg mL−1), and replaced with the pre-cultured medium of cells. After co-incubation for 4 h at 37 °C in 5% CO2, the cells were washed with the medium, trypsinized, and suspended in BD PharMingen™ stain buffer (BD Bioscience, San Diego, CA). Flow cytometry was performed on a Cytomics FC500 (Beckman Coulter Inc., Fullerton, CA) with a 488 nm argon laser. The signal from the FL1 bandpass emission (525 nm) was used for FITC. The histograms of flow cytometry were analyzed using FlowJo software (Tree Star Inc., Ashland, OR).CLSFM observation
HeLa cells were cultured in a glass-bottomed dish (glass diameter = 10 mm) at a density of 2.0 × 10⁴ cells per dish and cultured for 20 h at 37 °C in 5% CO2. After the culture medium was removed, 1.0 mL of fresh MEM containing the ESG-DEAE–BSA complex or the CHESG-DEAE–BSA complex (final concentration of the ESG derivative = 120 μg mL−1 and FITC-BSA = 2.64 μg mL−1) was added to the dishes. After co-incubation for 4 h or 24 h at 37 °C in 5% CO2, the cells were washed three times with a fresh medium and were observed by CLSFM (LSM510META, Carl Zeiss, Germany). To estimate co-localization of BSA and acidic organelles, the complex of CHESG-DEAE and Alexa Fluor 488-labeled BSA (Molecular Probes, Eugene, OR) was used at the same concentration of CHESG-DEAE and BSA described above. 2 μL of Lysotracker® Red (Molecular Probes, Eugene, OR) was added to the glass dish 30 min before observation. The CLSFM observations were carried out with 40× objective at an excitation wavelength of a 488 nm argon laser (for Alexa Fluor 488-labeled BSA) and a 543 nm He–Ne laser (for Lysotracker® Red) detected through 503–530 nm and 550–754 nm bandpass filters, respectively. The co-localization ratios of green and red pixels in 4 h (Fig. 8A) and 24 h (Fig. 8B) were calculated using over 30 cells.29Statistical analysis
In the assessment of co-localization, the results are reported as the mean ± standard deviation. Statistical significance in Fig. 8C was evaluated by t-test using GraphPad Prism-6 Software (GraphPad Software, San Diego, CA).Results and discussion
Synthesis and characterization of cationic ESG and CHESG
Cationic ESG and CHESG (ESG-DEAE, CHESG-DEAE) were synthesized by modification of N,N-diethylethylenediamine (DEAE) to ESG and CHESG (see ESI Scheme S1†). The degrees of substitution (DS) of cationic DEAE groups in ESG-DEAE and CHESG-DEAE were 1830 and 1890 per ESG molecule, respectively. The average RH of the ESG derivative in 1.0 mg mL−1 PBS solution (pH 7.4) was measured by DLS, and the ζ-potential measurement was also performed (Table 1). The size of ESG-DEAE (13.9 nm) was similar to non-modified ESG (13.5 nm), but that of CHESG-DEAE (15.4 nm) was smaller than CHESG (18.1 nm). Although the ζ-potentials of ESG and CHESG were almost neutral (both were −0.9 mV), that of ESG-DEAE and CHESG-DEAE changed to cationic (+8.0 mV and +7.8 mV) by modifying them with cationic DEAE groups.| DS of cholesterol | DS of DEAE | R H (nm) | PDI | ζ-Potential (mV) | M w (×106) | |
|---|---|---|---|---|---|---|
| ESG | — | — | 13.5 ± 0.1 | 0.100 | −0.9 ± 0.3 | 2.1 |
| ESG-DEAE | — | 1830 | 13.9 ± 0.1 | 0.115 | +8.0 ± 0.8 | 1.5 |
| CHESG | 140 | — | 18.1 ± 0.2 | 0.081 | −0.9 ± 0.7 | 6.9 |
| CHESG-DEAE | 140 | 1890 | 15.4 ± 0.1 | 0.091 | +7.8 ± 0.5 | 2.6 |
The molecular weight of compounds in PBS solution was investigated by SEC-MALS (Table 1). In this study, we selected the TSK-gel G6000PWXL-CP column (Tosoh Bioscience LLC) to measure cationic derivatives and obtained unimodal elution profiles with all samples (Fig. S1 of ESI†). The molecular weights of non-ionic ESG and CHESG were Mw = 2.1 × 10⁶ and Mw = 6.9 × 10⁶ which correlated well with results we reported previously19 (Mw = 2.2 × 10⁶ and Mw = 6.0 × 10⁶) using a Sephacryl S-500 column (GE Healthcare). The molecular weight of ESG-DEAE was Mw = 1.5 × 10⁶. The elution peak of ESG-DEAE was detected at almost the same time as ESG. Additionally, DLS measurement indicated that the size and the polydispersity index (PDI) of ESG-DEAE were similar to ESG. Hence, the ESG-DEAE was considered to form cationic polysaccharide nanoparticles like ESG. In the CHESG-DEAE case, however, the elution peak shifted later and the molar-mass distribution curve closer to ESG and ESG-DEAE resulting in significantly decreased molecular weight (Mw = 2.6 × 10⁶, Mw/Mn = 2.28) in addition to diminished size as detected by DLS. Moreover, the TEM image (Fig. 1) showed that CHESG-DEAE existed as one spherical nanoball unlike nonionic CHESG which forms a cluster nanogel by association of some CHESG nanoballs through hydrophobic interactions suggesting that the cationic form of CHESG dissociated from each other due to electrostatic repulsion. The association of CHESG-DEAE in the water is dependent on the balance between the hydrophobic interactions by the cholesterol groups and the electrostatic repulsion by the cationic DEAE groups.
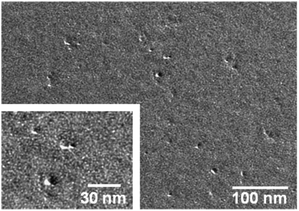 | ||
| Fig. 1 FF-TEM image of CHESG-DEAE. | ||
The presence of hydrophobic nanodomains in CHESG-DEAE was investigated by fluorescence spectroscopy. The emission spectra (wavelength 350–500 nm) of pyrene (Py) were measured at various concentrations (0.001–10.0 mg mL−1) of ESG derivatives in PBS solution. Then we evaluated the intensities of the bands I1 at 374 nm and I3 at 385 nm, and plotted the I1 to I3 ratio versus the ESG derivative concentration (Fig. 2). The I1/I3 ratio for the Py spectra of ESG and ESG-DEAE (around 1.75) did not change as the concentrations varied in a polar medium such as water. On the other hand, the emission of Py in a solution of CHESG was around 1.2, consistent with values for Py in a hydrophobic domain of cholesterol groups as described previously.20 The I1/I3 ratio from the Py spectra of CHESG-DEAE, similarly, was around 1.2, indicating that the hydrophobic domains were maintained for the cationic CHESG derivative. In summary, the cationic CHESG (CHESG-DEAE) forms a positive-charged, monodisperse, and non-assembled amphiphilic nanoparticle with hydrophobic nanodomains through the interaction of cholesterol groups with inner CHESG-DEAE molecules in physiological solutions such as PBS (pH 7.4) (Fig. 3).
![I
1/I3 ratio of Py fluorescence of the ESG derivative solutions as a function of concentration in PBS (pH 7.4) at 25 °C. [Py] = 1 × 10⁻⁶ M.](/image/article/2013/BM/c3bm00178d/c3bm00178d-f2.gif) | ||
| Fig. 2 I 1/I3 ratio of Py fluorescence of the ESG derivative solutions as a function of concentration in PBS (pH 7.4) at 25 °C. [Py] = 1 × 10⁻⁶ M. | ||
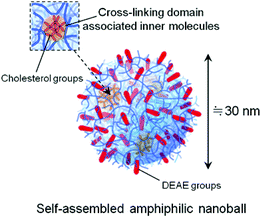 | ||
| Fig. 3 Schematic representation of the CHESG-DEAE nanoball in PBS solution. | ||
Interaction and stabilization of proteins by ESG derivatives
To evaluate the interactions between ESG derivatives and proteins, we performed fluorescence correlation spectroscopy (FCS) measurements. The bovine serum albumin (BSA) (Mw = 66 kDa) labeled tetramethylrhodamine probe (TRITC-BSA) was selected as a model protein. The percentage of free proteins and bound proteins complexed with the nanogel in the nanogel–protein mixture can be detected and discriminated by FCS because the diffusion of free TRITC-BSA is faster than when it is contained in the complex. Fig. 4 shows the binding curve for 2.5 nM TRITC-BSA with various ESG derivatives at increasing concentrations in PBS solution. The binding curve of cationic CHESG-DEAE was shifted to a lower concentration than CHESG indicating that CHESG-DEAE binds more strongly to TRITC-BSA than non-ionic CHESG. The binding constant (K) of CHESG-DEAE calculated from the curve fit was 1.0 (±0.6) × 109, much higher than the K of CHESG (2.5 (±0.6) × 107). Because BSA is an anionic protein (PI = 4.930), the cationic CHESG-DEAE interacts strongly with BSA through both hydrophobic and electrostatic interactions.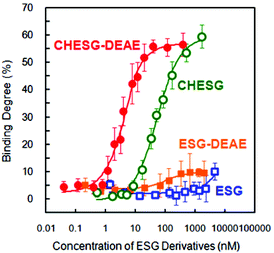 | ||
| Fig. 4 Binding isotherm of TRITC-BSA (2.5 nM) and ESG derivatives in PBS (pH 7.4) at 25 °C estimated by FCS. | ||
The secondary structures of proteins complexed with CHESG or CHESG-DEAE were investigated by circular dichroism (CD) spectra (Fig. 5A). In the previous report,20 we showed that the CD spectrum of the CHESG–BSA complex did not change after complexation, although that of complexed BSA with the CHP nanogel changed drastically.12 This was because BSA associated with the external surface of the CHESG nanogel without significant conformational changes. In the case of the CHESG-DEAE–BSA complex, in an analogous way, the CD spectrum did not change from that of native BSA. The average RH and ζ-potential of the ESG derivative–BSA complexes are listed in Table 2. The RH of the CHESG-DEAE–BSA complex was 19.5 nm, slightly larger than that of CHESG-DEAE (15.4 nm) which correlates with the size change between CHESG (18.1 nm) and the CHESG–BSA complex (26.9 nm). The AFM images showed that the CHESG-DEAE–BSA complex formed nanoparticles with slightly rough and craggy surfaces relative to non-complexed CHESG-DEAE with its smooth surface, but did not aggregate (Fig. S2A and B†). The CHESG-DEAE also interacted with BSA at the surface of the nanoparticle via hydrophobic and electrostatic interactions. ζ-Potential measurements indicated that the cationic derivative complexes (ESG-DEAE and CHESG-DEAE)–BSA maintained a positive charge (+5.6 mV and +6.1 mV, respectively) after complexation (Table 2).
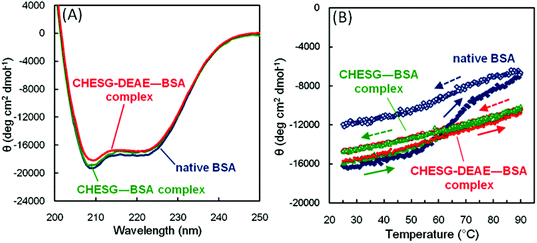 | ||
| Fig. 5 (A) CD spectra of free FITC-BSA, CHESG–BSA complex, and CHESG-DEAE–BSA complex in PBS (pH 7.4) at 25 °C. (B) Changes in the value of CD ellipticity at 222 nm of free FITC-BSA, CHESG–BSA complex, and CHESG-DEAE–BSA complex as a function of temperature in PBS (pH 7.4). | ||
| R H (nm) | PDI | ζ-Potential (mV) | |
|---|---|---|---|
| ESG–BSA | 13.4 ± 0.1 | 0.095 | −3.4 ± 0.8 |
| ESG-DEAE–BSA | 15.3 ± 1.0 | 0.192 | +5.6 ± 1.1 |
| CHESG–BSA | 26.9 ± 0.4 | 0.122 | −2.9 ± 0.6 |
| CHESG-DEAE–BSA | 19.5 ± 0.2 | 0.110 | +6.1 ± 1.1 |
The structural changes in cargo proteins as a function of temperature were investigated by changes in the value of CD ellipticity at 222 nm in the absence or presence of the CHESG or CHESG-DEAE solutions (Fig. 5B). In the native BSA without nanogels, the CD ellipticity value at 222 nm (θ222) increased drastically around 60 °C which is the denaturation temperature of BSA.31 Because the thermal denaturation of proteins is irreversible, the value of θ222 did not recover to that of the native protein after cooling to 25 °C. In the presence of CHESG or CHESG-DEAE, the value of θ222 of complexed BSA gradually increased with no transition point upon heating, and recovered reversibly after cooling to 25 °C. This thermal stabilizing function was also reported for CHP nanogels.12 However, the CHP nanogels changed the secondary structure of BSA after complexation. For both CHESG and CHESG-DEAE, the native secondary structure of BSA was maintained, and stabilized against thermal stress. Thus, the ESG derivatives have the potential to deliver some proteins into cells while maintaining their structures and functions.
Protein intracellular delivery by ESG derivatives
We next investigated the protein delivery efficiency of the ESG derivatives into human cervical cancer (HeLa) cells. First, the cell cytotoxicity of the ESG derivatives was assessed (Fig. S3†). The cell viability in the presence of CHESG-DEAE solution was almost 100% at concentrations up to 1000 μg mL−1, suggesting that the cationic type of CHESG had low cytotoxicity under the normal cell delivery assessment conditions (120 μg mL−1) in a medium similar to non-ionic CHESG.The ESG derivative–BSA complexes were co-incubated with HeLa cells in MEM with 10% FBS. After washing twice, the fluorescence intensities of internalized FITC-BSA delivered by ESG derivatives were measured by flow cytometry (Fig. 6). The cellular uptake efficiencies of FITC-BSA were increased by using cationic carriers, such as ESG-DEAE and CHESG-DEAE, while the cellular uptakes without carrier or with non-ionic ESG and CHESG were very low. Because the cell surface was negatively charged, the cationic derivatives were easily internalized into the cells. In particular, the fluorescence intensity of CHESG-DEAE was comparable to BioPORTER® which is a commercially available protein carrier composed of a cationic liposome28 that displays a fluorescence intensity eighty times higher than BSA alone with no carrier. We reported a cationic CHP nanogel system that the parent polysaccharide, pulluan, is a linear polysaccharide.16 To compare the cationic CHESG (the parent polysaccharide is a dendritic polysaccharide) to cationic CHP, we investigated the cellular uptake of BSA by CHESG-DEAE and DEAE modified CHP (CHP-DEAE) using flow cytometry (Fig. S4†). The CHESG-DEAE delivered BSA into HeLa cells more effectively than CHP-DEAE.
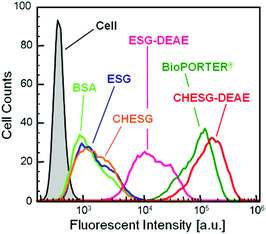 | ||
| Fig. 6 Histograms of the fluorescence intensity of uptake of FITC-BSA to HeLa cells by various carriers evaluated by flow cytometry. | ||
The confocal laser scanning fluorescence microscopy (CLSFM) images (Fig. 7) were well correlated with the cellular uptake efficiency measured by flow cytometry. The fluorescence signal was undetected with FITC-BSA without carriers, but a strong signal could be detected with the delivery of the CHESG-DEAE–BSA complex to cells. Fig. 8 shows the CLSFM image of HeLa cells incubated with the CHESG-DEAE–BSA complex (green) and Lysotracker® Red (red) which is a molecular probe of acidic late endosome and lysosome compartments. The many bright yellow points originating from the merger of green and red signals throughout the cell cytoplasm in Fig. 8A imply that the BSA was effectively delivered by CHESG-DEAE and internalized inside the cells by endocytosis after 4 h similar to cationic CHP.16 After a 24 h incubation, some green signals along with merged yellow points were observed (Fig. 8B). The co-localization ratios of green (Alexa Fluor 488 labeled-BSA) and red (Lysotracker® Red) pixels in Fig. 8A (4 h) and 8B (24 h) were calculated using over 30 cells. The overlay pixel (yellow) after 24 h significantly (p < 0.0001) decreased compared to after 4 h, suggesting that the nanoball–BSA complex or BSA escaped from the endosome into the cell cytoplasm.
![CLSFM images of HeLa cells incubated with free FITC-BSA, ESG-DEAE–BSA complex, and CHESG-DEAE–BSA complex. [ESG derivatives] = 120 μg mL−1, [FITC-BSA] = 2.64 μg mL−1. Scale bar = 50 μm.](/image/article/2013/BM/c3bm00178d/c3bm00178d-f7.gif) | ||
| Fig. 7 CLSFM images of HeLa cells incubated with free FITC-BSA, ESG-DEAE–BSA complex, and CHESG-DEAE–BSA complex. [ESG derivatives] = 120 μg mL−1, [FITC-BSA] = 2.64 μg mL−1. Scale bar = 50 μm. | ||
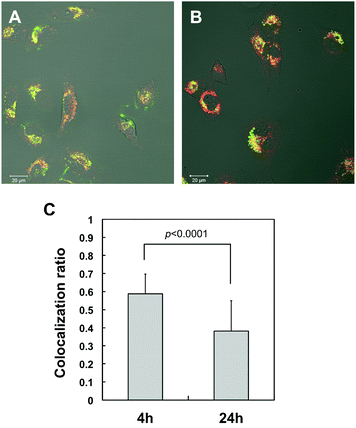 | ||
| Fig. 8 Intracellular distribution of Alexa Fluor 488-labeled BSA delivered by CHESG-DEAE after (A) 4 h and (B) 24 h. An overlay pixel (yellow) shows the Alexa Fluor 488-labeled BSA (green) co-localized with the endosome (red) stained by Lysotracker® Red. Scale bar = 20 μm. (C) The co-localization ratios of green and red pixels in (A) 4 h and (B) 24 h. Statistical significance was evaluated by t-test using over 30 cells. | ||
The recognition by toll-like receptor 2 (TLR-2) and the immunostimulating activity of parent ESGs which have optimized molecular weights are recently reported.32,33 This should accelerate the development of ESG nanoball-based material as an antigen delivery carrier capable of transporting antigen proteins into immune cells, especially macrophages, for purposes of stimulating their activities to induce an immune response. The methodology should support effective vaccine delivery.
Conclusions
Cationic DEAE group-modified ESG and CHESG (ESG-DEAE, CHESG-DEAE) were positively charged and monodisperse polysaccharide nanoballs. The CHESG-DEAE formed non-assembled cationic amphiphilic nanoparticles with hydrophobic nanodomains by aggregation of cholesterol groups interacting with inner CHESG-DEAE molecules. The CHESG-DEAE formed strong and stable complexes with the proteins through hydrophobic and electrostatic interactions. The complexed proteins were stabilized against thermal denaturation by complexation with CHESG or CHESG-DEAE. The thermally denatured protein did not aggregate even at 90 °C when complexed and could be reversibly recovered to its native form upon cooling. For protein delivery, the cationic CHESG was capable of cellular transport of proteins effectively, internalizing a number of proteins into all cells and delivering a portion of the protein to the cytoplasm. The cationic ESG nanoball-based material proved to be useful as a new effective candidate for protein delivery systems.Acknowledgements
The authors thank Dr Hiroki Takata and Dr Takeshi Takaha, Institute of Health Sciences, Ezaki Glico Co., Ltd (Osaka, Japan) for the kind gift of ESG and for helpful discussions. The authors also thank Ms Nogawa (Tokyo Medical and Dental University) for technical help and advice. This work was supported by a Grant-in-Aid for Scientific Research from the Ministry of Education, Culture, Sports, Science and Technology (No. 20240047 and No. 22114009), and by a JSPS research fellowship grant (No. 22-5165).Notes and references
- B. Leader, Q. J. Baca and D. E. Golan, Nat. Rev. Drug Discovery, 2008, 7, 21 CrossRef CAS.
- S. D. Koker, L. J. D. Cock, P. Rivera-Gil, W. J. Parak, R. A. Velty, C. Vervaet, J. P. Remon, J. Grooten and B. G. D. Geest, Adv. Drug Delivery Rev., 2011, 63, 748 CrossRef.
- N. Li, L.-H. Peng, X. Chen, S. Nakagawa and J.-Q. Gao, Vaccine, 2011, 29, 6179 CrossRef CAS.
- K. Y. Lee and S. H. Yuk, Prog. Polym. Sci., 2007, 32, 669 CrossRef CAS.
- Z. Liu, Y. Jiao, Y. Wang, C. Zhou and Z. Zhang, Adv. Drug Delivery Rev., 2008, 60, 1650 CrossRef CAS.
- J. J. Wang, Z. W. Zeng, R. Z. Xiao, T. Xie, G. L. Zhou, X. R. Zhan and S. L. Wang, Int. J. Nanomed., 2011, 6, 765 CAS.
- Y. Song, Y. Zhou and L. Chen, J. Mater. Chem., 2012, 22, 2512 RSC.
- A. Hawe, M. Wiggenhorn, M. V. D. Weert, J. H. O. Garbe, H.-C. Mahler and W. Jiskoot, J. Pharm. Sci., 2012, 101, 895 CrossRef CAS.
- J. Gili, W. Li, R. S. Tuan and M. T. Cicerone, Adv. Mater., 2011, 23, 4861 CrossRef.
- Y. Sasaki and K. Akiyoshi, Chem. Rec., 2010, 10, 366 CAS.
- K. Akiyoshi, S. Deguchi, N. Moriguchi, S. Yamaguchi and J. Sunamoto, Macromolecules, 1993, 26, 3062 CrossRef CAS.
- T. Nishikawa, K. Akiyoshi and J. Sunamoto, J. Am. Chem. Soc., 1996, 118, 6110 CrossRef CAS.
- K. Akiyoshi, S. Kobayashi, S. Shichibe, D. Mix, M. Baudys, S. W. Kim and J. Sunamoto, J. Controlled Release, 1998, 54, 313 CrossRef CAS.
- K. Akiyoshi, Y. Sasaki and J. Sunamoto, Bioconjugate Chem., 1999, 10, 321 CrossRef CAS.
- Y. Nomura, M. Ikeda, N. Yamaguchi, Y. Aoyama and K. Akiyoshi, FEBS Lett., 2003, 553, 271 CrossRef CAS.
- H. Ayame, N. Morimoto and K. Akiyoshi, Bioconjugate Chem., 2008, 19, 882 CrossRef CAS.
- A. Shimoda, S. Sawada and K. Akiyoshi, Macromol. Biosci., 2011, 11, 882 CrossRef CAS.
- K. Tsuji, T. Hamada, A. Uenaka, H. Wada, E. Sato, M. Isobe, K. Asagoe, O. Yamasaki, H. Shiku, G. Ritter, R. Murphy, E. W. Hoffman, L. J. Old, E. Nakayama and E. Iwatsuki, Cancer Immunol. Immunother., 2008, 57, 1429 CrossRef.
- T. Nochi, Y. Yuki, H. Takahashi, S. Sawada, M. Mejima, T. Kohda, N. Harada II., G. Kong, A. Sato, N. Kataoka, D. Tokuhara, S. Kurokawa, Y. Takahashi, H. Tsukada, S. Kozaki, K. Akiyoshi and H. Kiyono, Nat. Mater., 2010, 9, 572 CrossRef CAS.
- H. Takahashi, S. Sawada and K. Akiyoshi, ACS Nano, 2011, 5, 337 CrossRef CAS.
- H. Kajiura, R. Kakutani, T. Akiyama, H. Takata and T. Kuriki, Biocatal. Biotransform., 2008, 26, 133 CrossRef CAS.
- H. Kajiura, H. Takata, T. Akiyama, R. Kakutani, T. Furuyashiki, I. Kojima, T. Harui and T. Kuriki, Biologia, 2011, 66, 387 CrossRef CAS.
- H. Takata, H. Kajiura, T. Furuyashiki, R. Kakutani and T. Kuriki, Carbohydr. Res., 2009, 344, 654 CrossRef CAS.
- H. Kajiura, H. Takata, T. Kuriki and S. Kitamura, Carbohydr. Res., 2010, 345, 817 CrossRef CAS.
- S. Tafazoli, A. W. Wong, H. Kajiura, R. Kakutani, T. Furuyashiki, H. Takata and T. Kuriki, Regul. Toxicol. Pharmacol., 2010, 57, 210 CrossRef CAS.
- K. Ryoyama, Y. Kidachi, H. Yamaguchi, H. Kajiura and H. Takata, Biosci., Biotechnol., Biochem., 2004, 68, 2332 CrossRef CAS.
- K. Inagaki, K. Ishihara, M. Ishida, A. Watanabe, M. Fujiwara, Y. Komatsu, M. Shirai, Y. Kato, A. Takanezawa, T. Furuyashiki, H. Takata and Y. Seyama, J. Nutr. Sci. Vitaminol., 2011, 57, 170 CrossRef CAS.
- O. Zelphati, Y. Wang, S. Kitada, J. C. Reed, P. L. Felgner and J. Corbeil, J. Biol. Chem., 2001, 276, 35103 CrossRef CAS.
- Y. Lee, T. Ishii, H. Cabral, H. J. Kim, J.-H. Seo, N. Nishiyama, H. Oshima, K. Osada and K. Kataoka, Angew. Chem., Int. Ed., 2009, 48, 5309 CrossRef CAS.
- R. L. Moritz and R. J. Simpson, Nat. Methods, 2005, 2, 863 CrossRef CAS.
- K. Takeda, A. Wada, K. Yamamoto, Y. Moriyama and K. Aoki, J. Protein Chem., 1989, 8, 653 CrossRef CAS.
- R. Kakutani, Y. Adachi, H. Kajiura, H. Takata, T. Kuriki and N. Ohno, Carbohydr. Res., 2007, 342, 2371 CrossRef CAS.
- R. Kakutani, Y. Adachi, H. Takata, T. Kuriki and N. Ohno, Glycobiology, 2012, 22, 146 CrossRef CAS.
Footnote |
| † Electronic supplementary information (ESI) available: Synthetic scheme, elution profiles of SEC-MALS, AFM images, cytotoxicity assay, and histograms of flow cytometry. See DOI: 10.1039/c3bm00178d |
| This journal is © The Royal Society of Chemistry 2013 |
