Circular dichroism of multi-component assemblies for chiral amine recognition and rapid ee determination†
Pedro
Metola
a,
Eric V.
Anslyn
*a,
Tony D.
James
*b and
Steven D.
Bull
*c
aDepartment of Chemistry and Biochemistry, The University of Texas at Austin, Austin, Texas 78712, USA. E-mail: anslyn@austin.utexas.edu; Fax: +1-512-471-7791; Tel: +1-512-471-0068
bDepartment of Chemistry, University of Bath, Bath, BA2 7AY, UK. E-mail: t.d.james@bath.ac.uk; Fax: +44 (0) 1225 386231; Tel: +44 (0) 1225 383810
cDepartment of Chemistry, University of Bath, Bath, BA2 7AY, UK. E-mail: s.d.bull@bath.ac.uk; Fax: +44 (0) 1225 386231; Tel: +44 (0)1225 383551
First published on 22nd September 2011
Abstract
Upon mixing a chiral amine, enantiopure BINOL, and o-formyl phenyl boronic acid, the three components assemble efficiently and rapidly into chiral host–guest structures that produce distinct circular dichroism signals for each enantiomer of the amine. Employing BINOL and two derivatives to create an array of receptors, the CD signals resulting from several α-chiral primary amines were processed by principal component analysis and linear discriminant analysis to give satisfactory discrimination of the amines studied. Not only was the system able to differentiate the analytes chemoselectively and enantioselectively, but it also allowed for the rapid determination of chiral amineee values.
Introduction
The traditional method for obtaining and optimizing asymmetric catalysts is characterized by a trial and error process, where a potential catalyst is synthesized, its efficiency evaluated, and the results used to redesign the original compound. This process undergoes iterative cycles until a satisfactory degree of enantiopurity in the products is obtained.1 As of this moment, the leading techniques for analysis of chiral products are chiral HPLC and GC.2 Although these chromatographic methods provide highly accurate values of enantiomeric excess (ee), they are not easily amenable to rapid screening of hundreds to thousands of reactions, making the analysis of the ee rate-limiting when such large numbers of reactions are considered. In contrast, optical techniques are in general simple, affordable, and fast.3 Therefore, exploiting optical techniques for the aforementioned purpose could potentially allow for rapid and inexpensive screening of large numbers of asymmetric reactions, hastening the optimization of reaction conditions and catalyst structure.Both pharmaceutical and agricultural chemists employ α-chiral amines as versatile building blocks and intermediates in the synthesis of target products.4 Methods for the preparation of chiral amines continue to be developed, with chiral transition metal catalysts often being used for the enantioselective hydrogenation of imines.5 It is for these types of transformations that an improvement in efficiency could be derived directly from the application of simple and rapid methods for the analysis of the enantiopurity of α-chiral primary amines.
Our group has recently published a method for the analysis of ee and total concentration of α-chiral amines in which the target amine is converted into a diamine, that when complexed with a chiral Cu(I) host gives a distinctive signal change in circular dichroism spectroscopy (CD).6 This method is, however, limited by the derivatization step that can take up to two hours, a low signal intensity, short wavelengths for λmax values, and the requirement of a preformed metal-complex host. It was thus evident that room for improvement was still possible, and one approach to devise a better system is described herein.
While pursuing this goal our interest was piqued by an assembly process studied by the Bull and James groups.7 In the Bull–James system, an α-chiral primary amine, o-formyl phenyl boronic acid (FPBA), and enantiopure 1,1′-bi-2-naphthol (BINOL) assemble rapidly upon mixing, leading to characteristic 1H-NMR spectroscopic shifts for each enantiomer of the amine (Scheme 1). This system has also been used for electrochemical ee determination.8 A particularly interesting feature of this condensation is the fact that the three components are required for the reaction to achieve completion.
 | ||
| Scheme 1 Assembly developed by the Bull and James groups. | ||
We hypothesized that upon formation of the assembly the twist angle of BINOL would be altered, which in turn would translate into a modulated exciton-coupled circular dichroism (ECCD) signal that could be monitored through CD spectroscopy. Alternatively, formation of an imine-coordinated boronate ester could give rise to an induced CD signal by virtue of the chiral derivatization of the aryl boronic acid. Working with these postulates, we set up a series of experiments using several different BINOL derivatives as host for the analysis of α-chiral primary amines (Scheme 2). Having a collection of hosts readily available through this fast three-component assembly would allow us to utilize chemometric tools like principal component analysis (PCA) and linear discriminant analysis (LDA) to process the data collected. The fact that CD spectroscopy, especially in combination with a plate loader, is able to perform rapid analysis, coupled with the speed of the assembly reaction and its relative simplicity, made the proposed system a promising approach.
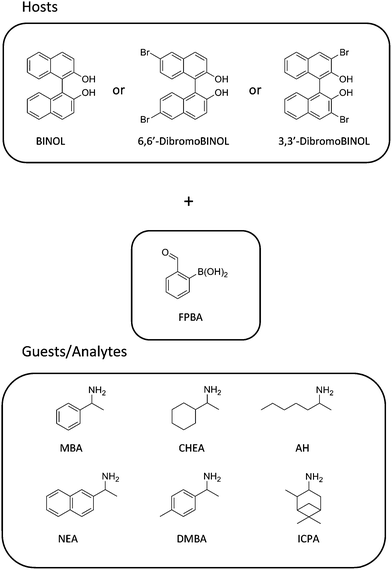 | ||
| Scheme 2 Structures of the compounds used as hosts and guests/analytes. | ||
Results and discussion
CD Titrations
The Bull-James 1H-NMR chiral shift protocol was originally carried out in chloroform. In order to obtain a satisfactory CD response upon assembly, the procedure was transitioned to acetonitrile because its spectral cut-off point at 195 nm makes acetonitrile a more suitable solvent for CD spectroscopy than chloroform. Further, the assembly was simultaneously confirmed in acetonitrile by 1H-NMR. The CD tests using equimolecular amounts of (S)-BINOL and FPBA (this combination herein referred to as the “host”), along with an equivalent of α-methyl benzylamine (MBA) (Fig. 1A) showed a difference in the signal with (R)- or (S)-MBA upon assembly. In contrast, no CD signal modulation occurs when only (S)-BINOL is combined with FPBA (“S-host”), indicating that there is either no condensation or that the torsion angle of (S)-BINOL is not modified to a significant extent when condensation occurs. The effect of the two enantiomers of MBA on the (S)-BINOL CD signal between 250 and 270 nm occurs in opposite directions, which could mean that the chirality of the amine induces twists in the dihedral angle of (S)-BINOL in opposite directions. Alternatively, the CD spectra of enantiomeric imine coordinated boronic acids would add or subtract from the BINOL CD spectra if the two spectra overlapped. When using (R)-BINOL (Fig. 1B) the changes in the signal are of the same intensity as with (S)-BINOL, but in opposite sign.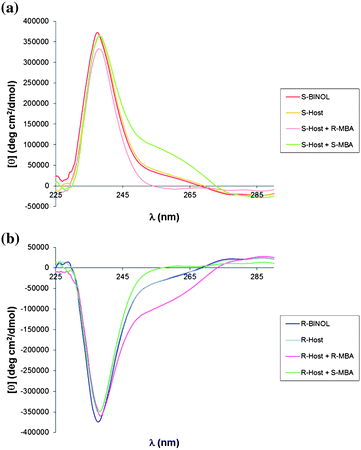 | ||
| Fig. 1 A) CD spectra of the assembly with (S)-BINOL, B) CD spectra of the assembly with (R)-BINOL. | ||
With these simple CD studies serving as a proof of principle, we undertook CD titrations to determine the stoichiometry of the assembly reaction (Fig. 2A and 2B). The wavelength chosen for these titrations was 253 nm, for it consistently showed the greatest difference in signal between the (R)- and (S)-amines (i.e. 98941 deg*cm2/dmol for the case of (R)- and (S)-MBA). As expected, the reaction reaches saturation when one equivalent of the amine is added to an equimolar mixture of BINOL and FPBA.
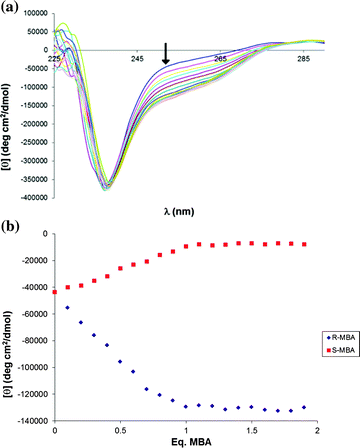 | ||
| Fig. 2 A) CD spectra for the titration of (R)-MBA into (R)-BINOL, B) CD titration of (R)- and (S)-MBA into (R)-BINOL. | ||
Upon examination of these results, it seemed evident that the signal that appears after completion of the assembly (between 250 nm and 265 nm) did not correspond to a significant variation in the twist angle of BINOL (whose characteristic Cotton Effect signal shows at around 240 nm9 and modulates only slightly when the other two components are added). Molecular modeling experiments using Spartan confirmed that the dihedral angle of BINOL experienced no distortion in the product of assembly. We therefore concluded that the arising signal at 250 nm could be due to the aromatic ring in FPBA becoming CD-active upon formation of the imine-coordinated boronate ester. A simple CD experiment in which FPBA was combined with an equimolecular amount of (R)-MBA confirmed this second hypothesis when a signal with the expected negative sign appeared around 250 nm (Fig. 3).
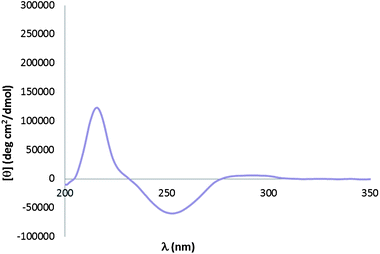 | ||
| Fig. 3 CD spectrum for an equimolecular mixture of FPBA and (R)-MBA. | ||
A chemo- and enantioselective differential array
Once the assembly was found to differentiate the enantiomers of MBA via CD and the origin of the signal created was well understood, we sought to test the general utility by varying analytes and hosts. A series of commercially available α-chiral primary amines was used to explore the viability and limitations: cyclohexylethylamine (CHEA), 2-aminoheptane (AH), 1-(1-naphthyl)-ethylamine (NEA), α,4-dimethylbenzylamine (DMBA), and isopinocampheylamine (IPCA). These analytes were chosen to include a variety of α-primary amine structures; from those containing linear aliphatic substituents to others with aromatic groups attached to the stereocenter of the amine. The assembly reaction with these guests was verified via1H-NMR at one equivalent of amine, and the CD spectra showed responses similar to MBA although with intensity and shape differences (see ESI†).With the goal of obtaining an assembly that would provide amine and chirality differentiation, we tested the reaction with a collection of BINOL analogues (Scheme 3). The 1H-NMR tests showed that for 6,6′-dibromoBINOL and 3,3′-dibromoBINOL the assembly went to completion with one equivalent of the amine, while 3,3′-dianthracenylBINOL proved too sterically constrained to lead to assembly.
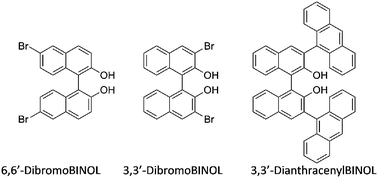 | ||
| Scheme 3 BINOL analogues tested. | ||
For the case of 6,6′-dibromoBINOL, the CD spectra have a distinctive shape pattern different from the one assigned to the assemblies with regular BINOL (Fig. 4), which adds variance to the system. The presence of the bromine atoms in the naphthalenic rings of this BINOL analogue are believed to cause the signal that appeared around 255 nm in the case of regular BINOL to shift towards longer wavelengths, be it by virtue of resonance or inductive effect.
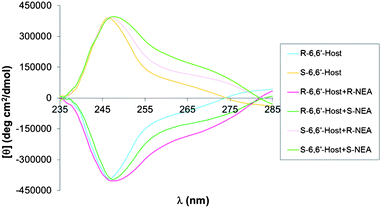 | ||
| Fig. 4 CD spectra for the assembly of 6,6′-dibromoBINOL, FPBA and NEA. | ||
When 3,3′-dibromoBINOL was used in the assembly the signal for the BINOL moiety is greatly increased (Fig. 5). A plausible explanation for this phenomenon could be that the two bromine substituents in positions 3 and 3′ are bulky enough and close enough to the two hydroxyl groups in 2 and 2′ that completion of the assembly reaction does indeed cause a distortion between the two naphthalenic rings in accordance with our original hypothesis.
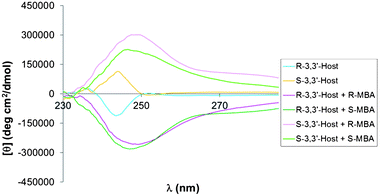 | ||
| Fig. 5 CD spectra for the assembly of 3,3′-dibromoBINOL, FPBA, and MBA. | ||
With an array of sensors in hand that give different signals for the amine analytes, it was possible to gather data to discriminate them based on their identities and handedness. The data generated with a series of receptors is often processed using supervised and unsupervised statistical analysis tools. In order to analyze the data obtained using the combination of our three sensors and six analytes we employed two different chemometric tools: Principal component analysis and linear discriminant analysis.
Principal component analysis (PCA) is an unsupervised technique (meaning the data is entered without a previous identification step) that is used to reduce the dimensionality of the data space. It achieves this by employing linear algebra to create a number of orthogonal axes called components that represent decreasing extents of variance within the system, with the first component being responsible for the most variance, and so forth.10
The data gathered for these analyses came from equimolecular mixtures of all the amines, FPBA, and three BINOLs: (R)-BINOL, (S)-6,6′-dibromoBINOL, and (R)-3,3′-dibromoBINOL. All experiments were repeated 5 times to ensure reproducibility and the signal at three different wavelengths for each BINOL analogue was recorded. The different amines showed effective separation (Fig. 6) allowing for discrimination based on absolute configuration. All the R enantiomers were located on the left half of the graph with respect to F1 with all the S enantiomers on the right side; the only outlier being AH. Further, PCA finds that the system can also separate the amines based on their identity, with those containing aromatic rings as substituents appearing separated from those with aliphatic groups due to greater modulation in the intensity of the CD signals. In fact, upon further inspection of the 2D PCA graphs it can be determined that the main component corresponds to chirality, with F2 and F3 representing variance amongst amines with aromatic and aliphatic groups (see ESI†).
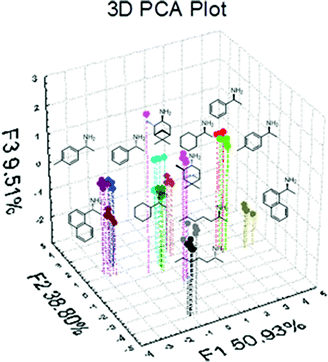 | ||
| Fig. 6 Principal component analysis plot. | ||
Linear discriminant analysis (LDA) creates a series of linear equations that maximize the separation between different classes of analytes and minimize the separation within those classes. Being a supervised technique, it requires that the analytes be assigned to a particular group before starting the analysis.11
Using the same conditions and data space collected for the PCA case, the LDA plot showed tight clustering of each group, a visual indicator that the system was able to discriminate α-chiral primary amines both chemo- and enantioselectively (Fig. 7). In order to assess the predictive power of this LDA study, a jackknife analysis test was performed and showed 100% predictive power. In this type of self-evaluation tool, the program leaves out one data point while the rest of the data space is used to create a classification system. The excluded point is then assigned to a group using the system created. This process is repeated for every data point and the overall outcome translated into a confidence level. A score of 100% in the jackknife analysis indicates that our system, thanks to the incorporation of three different sensing assemblies and taking into account the shape of the signal (by using readings at three separate wavelengths for each ensemble) can effectively identify and classify the target amines.
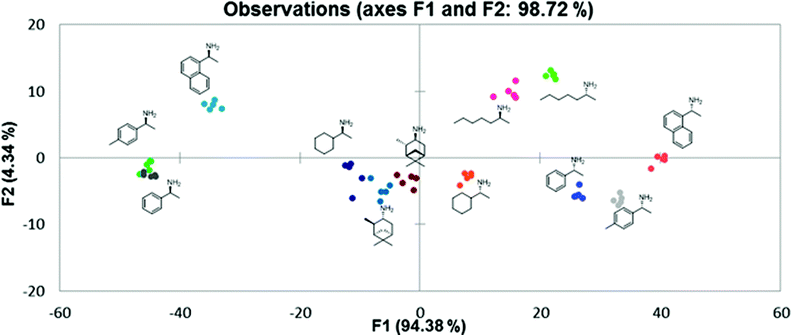 | ||
| Fig. 7 Linear discriminant analysis plot. | ||
Ee determination
As mentioned in the introduction, one goal of this project was to improve our previous primary amineee analysis system. In order to determine ee with this approach a calibration curve was obtained by plotting the CD readings of a series of samples of known enantiomeric composition versus their ee values using (R)-BINOL, FPBA and MBA, and employing 5 replicates of each data point for reproducibility purposes (Scheme 4, Fig. 8). Once a linear equation was fit to the data a number of “unknown” samples were analyzed using the system, and the ee results obtained were compared to the actual values, with an average absolute error of 5.8% (Table 1), with the greatest errors appearing when determining low ee values. It should be mentioned that these low ee values are usually the least important when trying to optimize performance of asymmetric catalysts. It is also noteworthy that the assembly only takes around 10 min to achieve completion and can be run in parallel for all unknowns. Another advantageous property of this system is the fact that as long as the saturation point (1 equivalent; Fig. 2B) is reached, the concentration of amine has no influence on the ee analysis. Finally, the analysis step takes about 2 min per sample, which effectively places this method in the realm of very rapid analysis. | ||
| Scheme 4 Reaction used for calibration curve. | ||
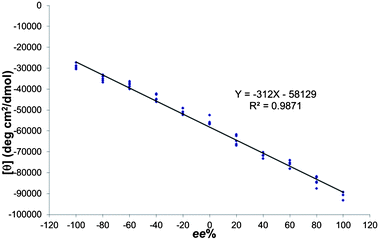 | ||
| Fig. 8 Calibration curve. | ||
| Sample | Real ee% | Calculated ee% |
|---|---|---|
| 1 | −10 | −1.5 |
| 2 | 30 | 36.3 |
| 3 | −70 | −62.3 |
| 4 | 80 | 78.2 |
| 5 | −50 | −48.6 |
Conclusions
We have described a technique that discriminates α-chiral primary amines based on chemical identity and chirality, while also being able to determine ee, using the optical technique of circular dichroism spectroscopy. An array of sensing ensembles was easily obtained by taking advantage of the one-step, fast, and simple three-component assembly of the target amine with enantiopure BINOLs and an achiral boronic acid. The variance of the optical data when processed by statistical analysis techniques allows for fingerprinting chemoselectively and enantioselectively. We have also proven that the system could be used to determine the ee of the parent amines with high accuracy, in fairly short times, while using relatively cheap commercially available materials.Acknowledgements
We gratefully acknowledge the financial support from the National Institutes of Health (GM77437) and the Welch Foundation (F-1151).Notes and references
- (a) D. Wahler and J.-L. Reymond, Curr. Opin. Biotechnol., 2001, 12, 535–544 CrossRef CAS; (b) J. P. Stambuli and J. F. Hartwig, Curr. Opin. Chem. Biol., 2003, 7, 420–426 CrossRef CAS; (c) C. Gennari and U. Piarulli, Chem. Rev., 2003, 103, 3071–3100 CrossRef CAS.
- (a) C. J. Welch, T. Szczerba and S. R. J. Perrin, J. Chromatogr., A, 1997, 758, 93–98 CrossRef; (b) C. J. Welch, B. Grau, J. Moore and D. J. Mathre, J. Org. Chem., 2001, 66, 6836–6837 CrossRef CAS; (c) C. J. Welch, F. Fleitz, F. Antia, P. Yehl, R. Waters, N. Ikemoto, I. J. D. Armstrong and D. J. Mathre, Org. Process Res. Dev., 2004, 8, 186–191 CrossRef CAS; (d) M. S. Sigman and E. N. Jacobsen, J. Am. Chem. Soc., 1998, 120, 4901–4902 CrossRef CAS; (e) C. Wolf and P. A. Hawes, J. Org. Chem., 2002, 67, 2727–2729 CrossRef CAS.
- (a) J. Lin, H. C. Zhang and L. Pu, Org. Lett., 2002, 4, 3297–3300 CrossRef CAS; (b) S. J. Lee and W. Lin, J. Am. Chem. Soc., 2002, 124, 4554–4555 CrossRef CAS; (c) K. H. Ahn, H.-Y. Ku, Y. Kim, S.-G. Kim, Y. K. Kim, H. S. Son and J. K. Ku, Org. Lett., 2003, 5, 1419–1422 CrossRef CAS; (d) R. Corradini, C. Paganuzzi, R. Marchelli, S. Pagliari, S. Sforza, A. Dossena, G. Galaverna and A. Duchateau, J. Mater. Chem., 2005, 15, 2741–2746 RSC; (e) S. Liu, J. P. C. Pestano and C. Wolf, J. Org. Chem., 2008, 73, 4267–4270 CrossRef CAS.
- K. G. Gadamasetti and T. Braish, Process Chemistry in the Pharmaceutical Industry, Vol. 2, CRC Press, New York, 1973 Search PubMed.
- (a) G. Hou, F. Gosselin, W. Li, C. McWilliams, Y. Sun, M. Weisel, P. D. O′Shea, C. Chen, I. W. Davies and X. Zhang, J. Am. Chem. Soc., 2009, 131, 9882–9883 CrossRef CAS; (b) H. Braun, H. Felber, G. Knesse, A. Ritter, F. P. Schmidtchen and A. Schneider, Tetrahedron, 2001, 57, 3313–3328 Search PubMed; (c) R. Kadyrov and T. H. Riermeier, Angew. Chem., 2003, 115, 5630–5632 ( Angew. Chem., Int. Ed. , 2003 , 42 , 5472 ) CrossRef; (d) X. Huang, M. Ortiz-Marciales, K. Huang, V. Stepanenko, F. G. Merced, A. M. Ayala, W. Correa and M. De Jesus, Org. Lett., 2007, 9, 1793–1795 CrossRef CAS; (e) G.-Q. Lin, M.-H. Xu, Y.-W. Zhong and X.-W. Sun, Acc. Chem. Res., 2008, 41, 831–840 CrossRef CAS; (f) R. Hili, S. Baktharaman and A. K. Yudin, Eur. J. Org. Chem., 2008, 31, 5201–5213 CrossRef.
- S. Nieto, J. M. Dragna and E. V. Anslyn, Chem.–Eur. J., 2010, 16, 227–232 CrossRef CAS.
- (a) Y. Perez-Fuertes, A. M. Kelly, S. Arimori, S. D. Bull and T. D. James, Org. Lett., 2006, 8, 1971–1974 CrossRef; (b) Y. Perez-Fuertes, A. M. Kelly, J. S. Fossey, M. E. Powell, S. D. Bull and T. D. James, Nat. Protoc., 2008, 3, 210–214 CrossRef CAS.
- G. Mirri, S. D. Bull, P. N. Horton, T. D. James, L. Male and J. H. R. Tucker, J. Am. Chem. Soc., 2010, 132, 8903–8905 CrossRef CAS.
- I. Hanazaki and H. Akimoto, J. Am. Chem. Soc., 1972, 94, 4102–4106 CrossRef CAS.
- (a) P. C. Jurs, G. A. Bakken and H. E. McClellan, Chem. Rev., 2000, 100, 2649–2678 CrossRef CAS; (b) I. T. Joliffe, Principal Component Analysis, 2nd ed, Springer-Verlag, New York, 2002 Search PubMed.
- R. A. Johnson and D. W. Winchern, Applied Multivariate Statistical Analysis, Prentice-Hall, Englewood Cliffs, N.J, 1982 Search PubMed.
Footnote |
| † Electronic supplementary information (ESI) available: Detailed procedures, characterization data, and additional plots. See DOI: 10.1039/c1sc00496d |
| This journal is © The Royal Society of Chemistry 2012 |
